The median household income in Le Mars, IA in 2022 was $72,706, which was 4.3% greater than the median annual income of $69,588 across the entire state of Iowa. Compared to the median income of $38,892 in 2000 this represents an increase of 46.5%. The per capita income in 2022 was $38,216, which means an increase of 48.7% compared to 2000 when it was $19,598.
Whole page based on the data from 2000 / 2022 when the population of Le Mars, Iowa was 9,237 / 10,588
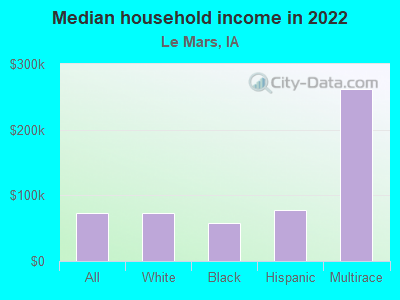
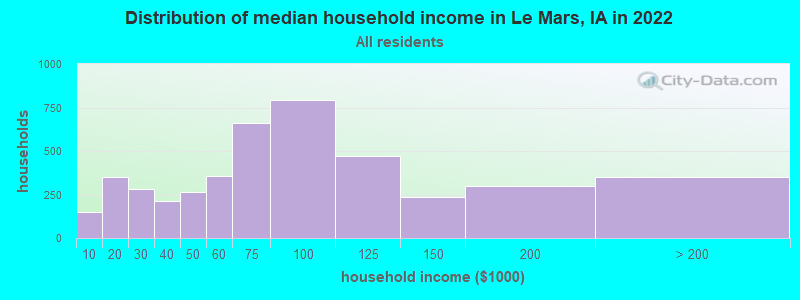
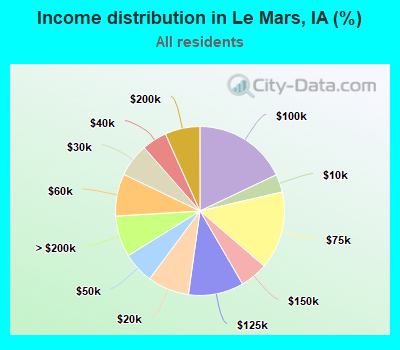
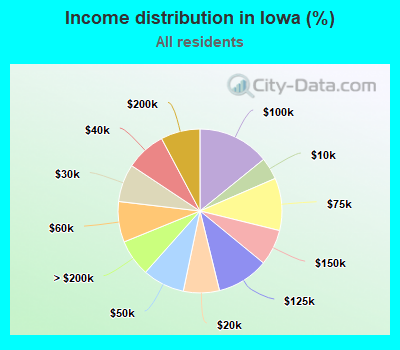
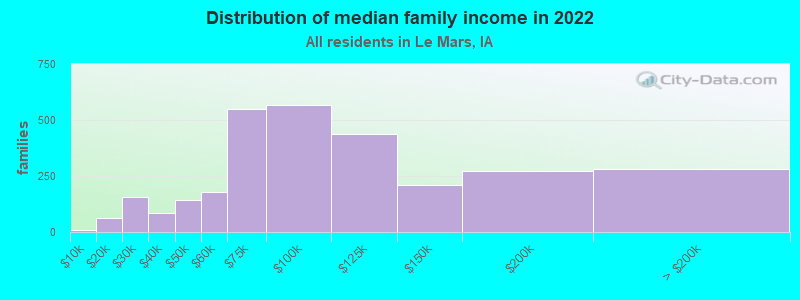
Income statistics for all residents
Median household income in Le Mars, IA in 2022:
Le Mars:
$72,707
State:
$69,588
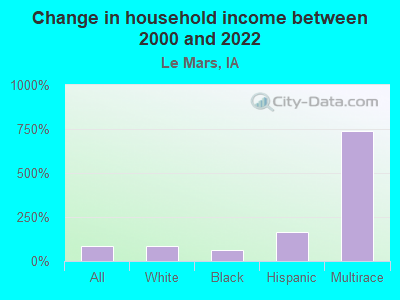
Change in median household income between 2000 and 2022:
Le Mars, Iowa:
+86.9%
Iowa:
+76.3%
Number of households with income < $10k:
Le Mars:
3.4% (152)
State:
4.3% (57,792)
Number of households with income $10k - 20k:
Le Mars:
8.0% (353)
State:
7.1% (94,476)
Number of households with income $20k - 30k:
Le Mars:
6.3% (281)
State:
7.5% (99,451)
Number of households with income $30k - 40k:
Le Mars:
4.8% (212)
State:
7.9% (105,366)
Number of households with income $40k - 50k:
Le Mars:
6.0% (265)
State:
8.3% (110,374)
Number of households with income $50k - 60k:
Le Mars:
8.1% (359)
Iowa:
8.0% (106,753)
Number of households with income $60k - 75k:
Le Mars:
14.9% (660)
Iowa:
10.3% (137,637)
Number of households with income $75k - 100k:
Le Mars:
18.0% (795)
State:
14.2% (188,515)
Number of households with income $100k - 125k:
Le Mars:
10.6% (469)
Iowa:
10.3% (136,469)
Number of households with income $125k - 150k:
Le Mars:
5.3% (235)
Iowa:
7.1% (94,270)
Number of households with income $150k - 200k:
Le Mars:
6.7% (297)
Iowa:
7.8% (103,165)
Number of households with income > $200k:
Le Mars:
7.9% (349)
State:
7.3% (96,727)
Aggregate household income in Le Mars in 2022: $399,821,217
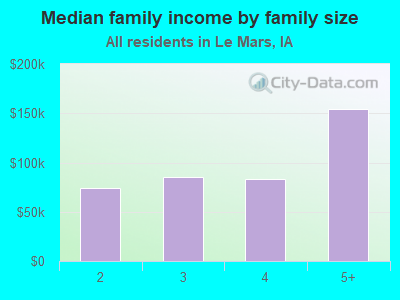
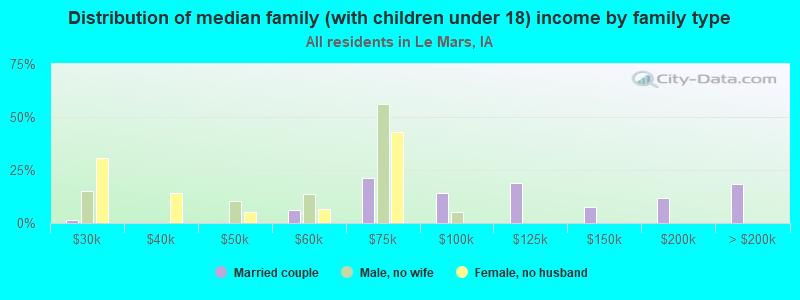
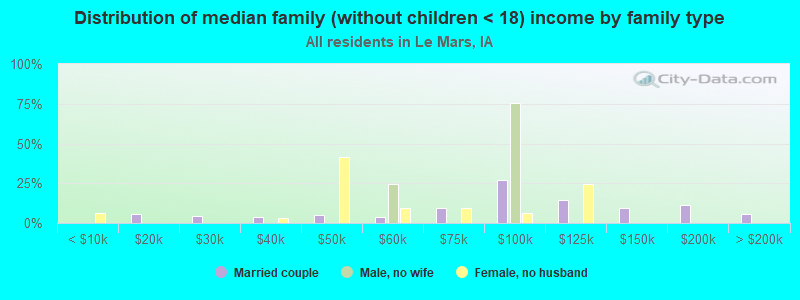
Median family income in Le Mars in 2022:
Le Mars:
$85,736
Iowa:
$90,851
Number of families with income < $10k:
Le Mars:
0.3% (8)
State:
2.5% (20,874)
Number of families with income $10k - 20k:
Le Mars:
2.1% (62)
State:
3.2% (26,365)
Number of families with income $20k - 30k:
Le Mars:
5.3% (157)
Iowa:
4.3% (35,635)
Number of families with income $30k - 40k:
Le Mars:
2.9% (85)
Iowa:
5.4% (44,304)
Number of families with income $40k - 50k:
Le Mars:
4.8% (142)
State:
6.8% (55,757)
Number of families with income $50k - 60k:
Le Mars:
6.1% (180)
Iowa:
6.7% (55,443)
Number of families with income $60k - 75k:
Le Mars:
18.6% (548)
State:
10.2% (83,983)
Number of families with income $75k - 100k:
Le Mars:
19.3% (568)
State:
16.5% (135,546)
Number of families with income $100k - 125k:
Le Mars:
14.8% (436)
State:
13.2% (108,552)
Number of families with income $125k - 150k:
Le Mars:
7.0% (208)
State:
9.7% (79,659)
Number of families with income $150k - 200k:
Le Mars:
9.3% (273)
State:
11.0% (90,640)
Number of families with income > $200k:
Le Mars:
9.5% (281)
State:
10.4% (85,202)
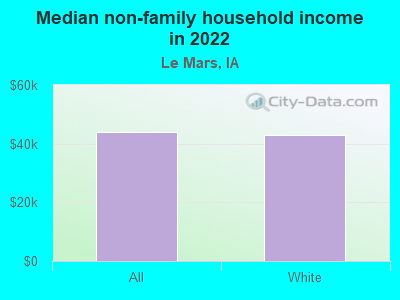
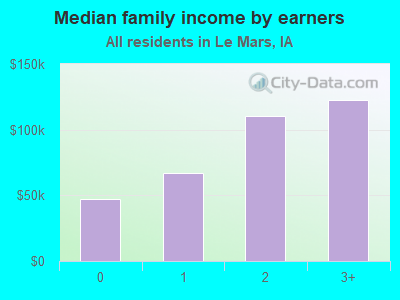
Median non-family income in Le Mars in 2022:
Le Mars:
$43,960
State:
$41,504
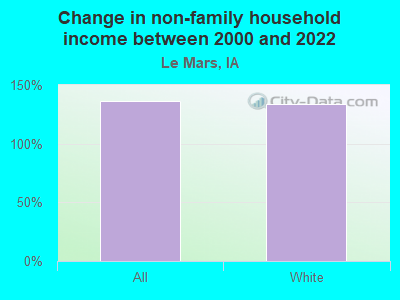
Change in median non-family income between 2000 and 2022:
Le Mars, Iowa:
+136.4%
Iowa:
+84.8%
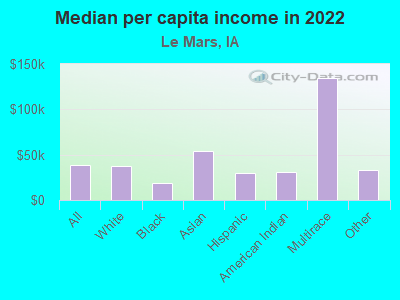
Median per capita income in Le Mars in 2022:
Le Mars:
$38,217
State:
$38,917
Change in median per capita income between 2000 and 2022:
Le Mars, Iowa:
+95.0%
State:
+97.8%
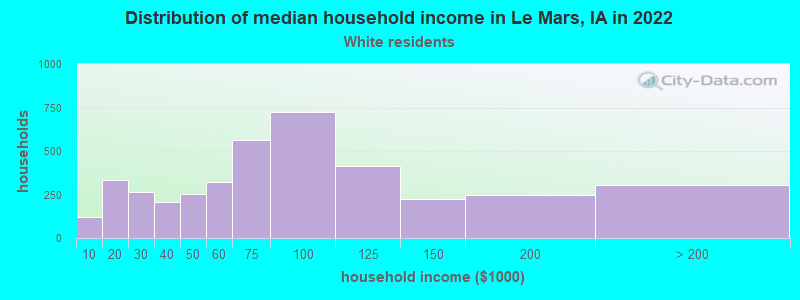
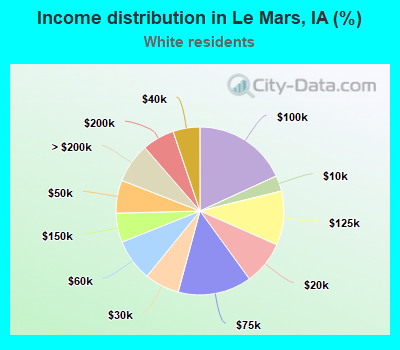
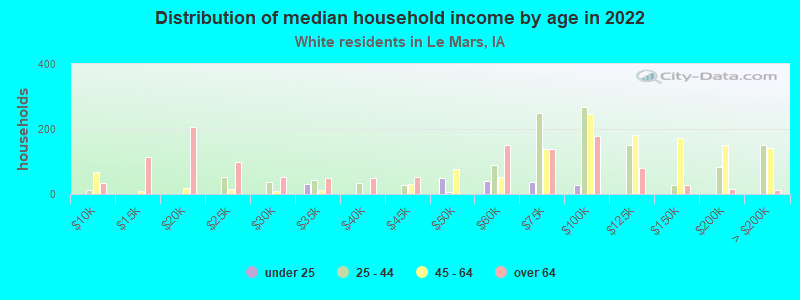
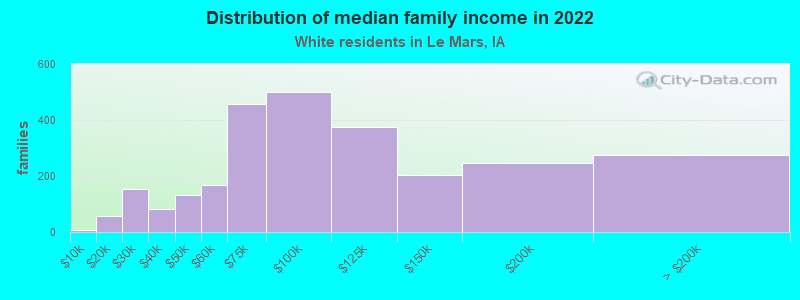
Income statistics for White residents
Median household income in Le Mars, IA in 2022:
Le Mars:
$72,504
State:
$71,725
Change in median household income between 2000 and 2022:
Le Mars, Iowa:
+85.2%
Iowa:
+79.7%
Number of households with income < $10k:
Le Mars:
3.0% (120)
Iowa:
4.0% (47,459)
Number of households with income $10k - 20k:
Le Mars:
8.4% (336)
State:
6.7% (78,901)
Number of households with income $20k - 30k:
Le Mars:
6.7% (267)
State:
7.1% (83,759)
Number of households with income $30k - 40k:
Le Mars:
5.2% (207)
Iowa:
7.7% (90,779)
Number of households with income $40k - 50k:
Le Mars:
6.4% (254)
Iowa:
8.0% (93,777)
Number of households with income $50k - 60k:
Le Mars:
8.1% (324)
State:
8.0% (94,176)
Number of households with income $60k - 75k:
Le Mars:
14.2% (566)
State:
10.5% (123,053)
Number of households with income $75k - 100k:
Le Mars:
18.2% (726)
State:
14.4% (168,483)
Number of households with income $100k - 125k:
Le Mars:
10.4% (416)
Iowa:
10.6% (124,515)
Number of households with income $125k - 150k:
Le Mars:
5.6% (224)
State:
7.4% (87,043)
Number of households with income $150k - 200k:
Le Mars:
6.2% (248)
Iowa:
7.8% (91,953)
Number of households with income > $200k:
Le Mars:
7.7% (306)
State:
7.6% (88,587)
Aggregate household income in Le Mars in 2022: $347,980,285
Median family income in Le Mars in 2022:
Le Mars:
$86,821
State:
$93,591
Number of families with income < $10k:
Le Mars:
0.3% (7)
State:
2.1% (15,266)
Number of families with income $10k - 20k:
Le Mars:
2.1% (57)
State:
2.7% (19,465)
Number of families with income $20k - 30k:
Le Mars:
5.8% (155)
State:
4.0% (28,678)
Number of families with income $30k - 40k:
Le Mars:
3.1% (82)
State:
5.0% (36,249)
Number of families with income $40k - 50k:
Le Mars:
5.0% (133)
Iowa:
6.3% (45,169)
Number of families with income $50k - 60k:
Le Mars:
6.4% (169)
Iowa:
6.7% (48,577)
Number of families with income $60k - 75k:
Le Mars:
17.2% (457)
State:
10.4% (75,030)
Number of families with income $75k - 100k:
Le Mars:
18.8% (500)
State:
16.7% (120,450)
Number of families with income $100k - 125k:
Le Mars:
14.1% (375)
State:
13.8% (99,746)
Number of families with income $125k - 150k:
Le Mars:
7.7% (205)
State:
10.2% (73,833)
Number of families with income $150k - 200k:
Le Mars:
9.3% (248)
Iowa:
11.3% (81,189)
Number of families with income > $200k:
Le Mars:
10.3% (275)
Iowa:
10.8% (77,838)
Median non-family income in Le Mars in 2022:
Le Mars:
$42,895
Iowa:
$41,981
Change in median non-family income between 2000 and 2022:
Le Mars, Iowa:
+134.0%
Iowa:
+85.4%
Median per capita income in Le Mars in 2022:
Le Mars:
$37,682
Iowa:
$41,266
Change in median per capita income between 2000 and 2022:
Le Mars, Iowa:
+90.3%
State:
+105.0%
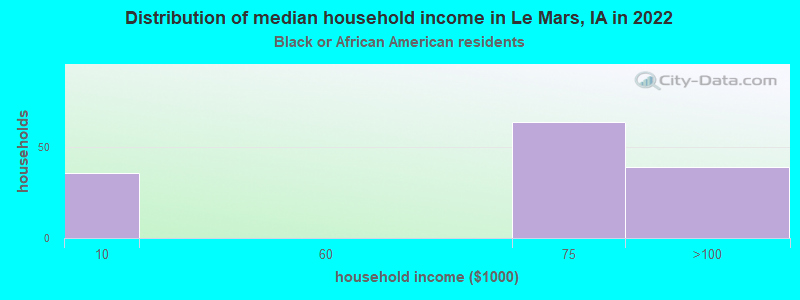
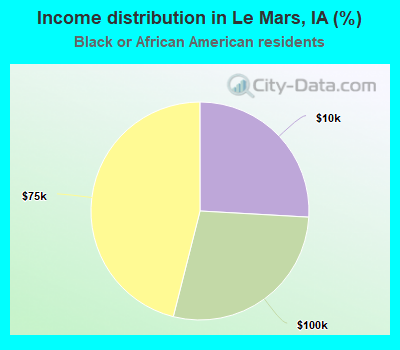
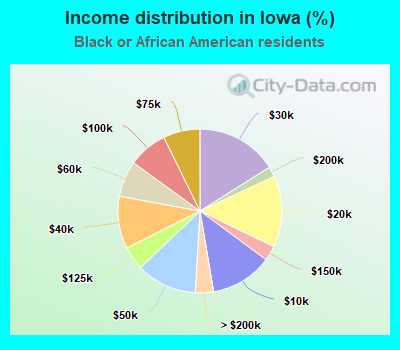
Income statistics for Black or African American residents
Median household income in Le Mars, IA in 2022:
Le Mars:
$57,689
State:
$38,071
Change in median household income between 2000 and 2022:
Le Mars, Iowa:
+63.4%
Iowa:
+52.7%
Number of households with income < $10k:
Le Mars:
25.9% (36)
State:
12.2% (5,111)
Number of households with income $10k - 20k:
Le Mars:
0.0% (0)
State:
14.1% (5,893)
Number of households with income $20k - 30k:
Le Mars:
0.0% (0)
Iowa:
16.1% (6,716)
Number of households with income $30k - 40k:
Le Mars:
0.0% (0)
Iowa:
10.4% (4,328)
Number of households with income $40k - 50k:
Le Mars:
0.0% (0)
State:
12.0% (4,997)
Number of households with income $50k - 60k:
Le Mars:
0.0% (0)
Iowa:
7.1% (2,970)
Number of households with income $60k - 75k:
Le Mars:
46.0% (64)
Iowa:
7.2% (3,030)
Number of households with income $75k - 100k:
Le Mars:
28.1% (39)
Iowa:
7.7% (3,238)
Number of households with income $100k - 125k:
Le Mars:
0.0% (0)
State:
4.7% (1,946)
Number of households with income $125k - 150k:
Le Mars:
0.0% (0)
Iowa:
3.0% (1,236)
Number of households with income $150k - 200k:
Le Mars:
0.0% (0)
Iowa:
2.0% (841)
Number of households with income > $200k:
Le Mars:
0.0% (0)
State:
3.6% (1,503)
Aggregate household income in Le Mars in 2022: $9,352,602
Median per capita income in Le Mars in 2022:
Le Mars:
$18,445
State:
$21,456
Change in median per capita income between 2000 and 2022:
Le Mars, Iowa:
+36.2%
State:
+73.0%
Income statistics for Asian residents
Median per capita income in Le Mars in 2022:
Le Mars:
$54,340
State:
$40,609
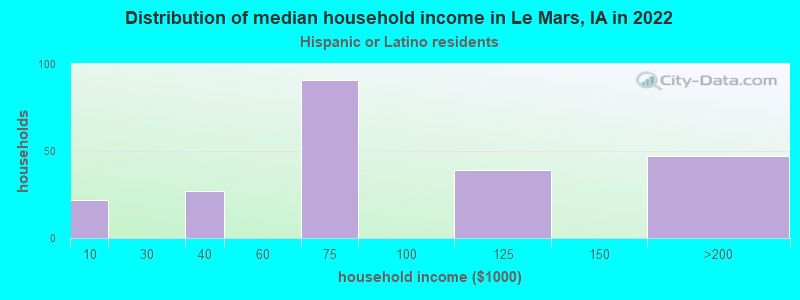
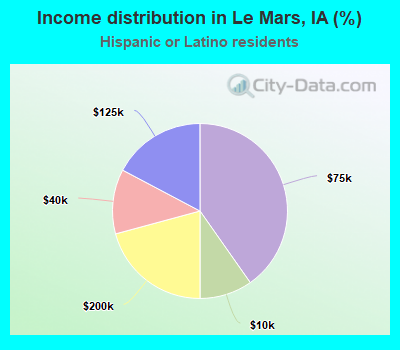
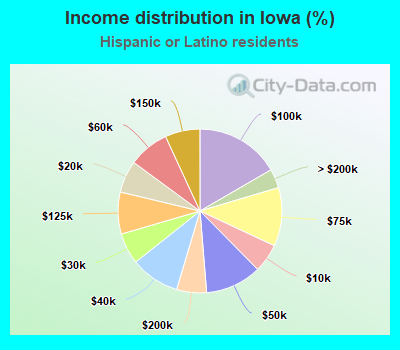
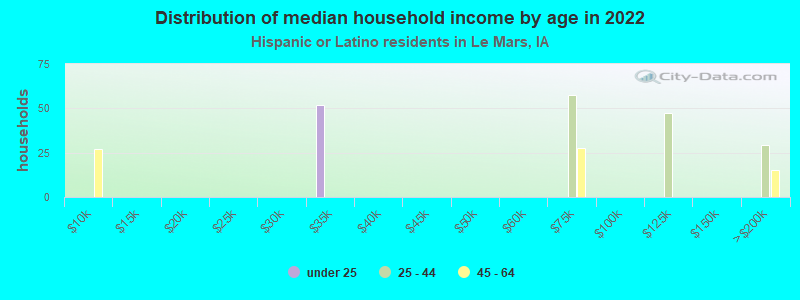
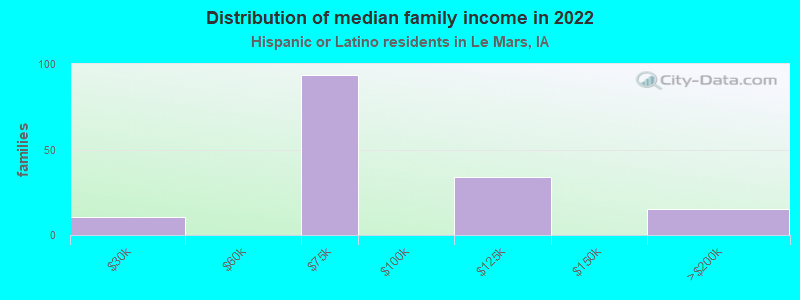
Income statistics for Hispanic or Latino residents
Median household income in Le Mars, IA in 2022:
Le Mars:
$78,418
State:
$64,447
Number of households with income < $10k:
Le Mars:
9.7% (22)
State:
5.6% (3,540)
Number of households with income $10k - 20k:
Le Mars:
0.0% (0)
State:
6.3% (3,979)
Number of households with income $20k - 30k:
Le Mars:
0.0% (0)
State:
6.1% (3,857)
Number of households with income $30k - 40k:
Le Mars:
11.9% (27)
Iowa:
9.7% (6,099)
Number of households with income $40k - 50k:
Le Mars:
0.0% (0)
State:
11.1% (6,971)
Number of households with income $50k - 60k:
Le Mars:
0.0% (0)
Iowa:
8.0% (5,046)
Number of households with income $60k - 75k:
Le Mars:
40.3% (91)
State:
11.6% (7,267)
Number of households with income $75k - 100k:
Le Mars:
0.0% (0)
State:
16.6% (10,454)
Number of households with income $100k - 125k:
Le Mars:
17.3% (39)
State:
8.3% (5,202)
Number of households with income $125k - 150k:
Le Mars:
0.0% (0)
State:
6.9% (4,319)
Number of households with income $150k - 200k:
Le Mars:
20.8% (47)
State:
5.9% (3,708)
Number of households with income > $200k:
Le Mars:
0.0% (0)
Iowa:
3.8% (2,363)
Aggregate household income in Le Mars in 2022: $20,662,797
Median family income in Le Mars in 2022:
Le Mars:
$81,994
State:
$72,372
Number of families with income $20k - 30k:
Le Mars:
6.7% (10)
State:
4.8% (2,087)
Number of families with income $60k - 75k:
Le Mars:
61.3% (94)
State:
12.2% (5,315)
Number of families with income $100k - 125k:
Le Mars:
22.1% (34)
Iowa:
8.2% (3,571)
Number of families with income $150k - 200k:
Le Mars:
9.9% (15)
Iowa:
6.5% (2,824)
Median per capita income in Le Mars in 2022:
Le Mars:
$29,938
State:
$23,112
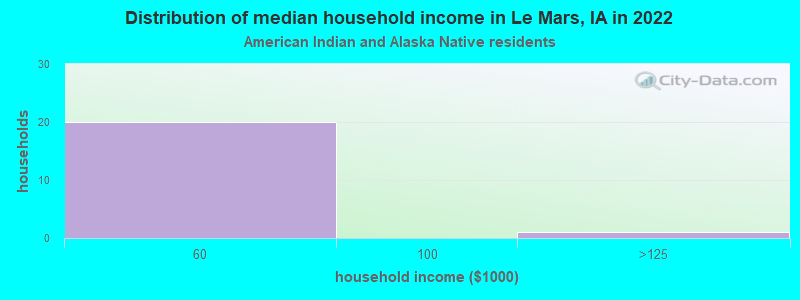
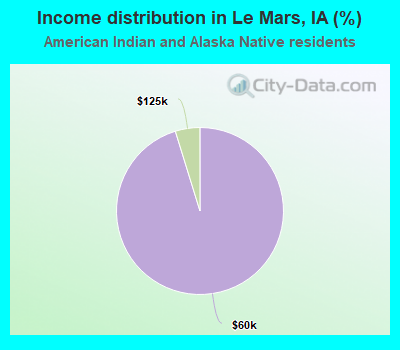
Income statistics for American Indian and Alaska Native residents
Number of households with income < $10k:
Le Mars:
0.0% (0)
State:
2.1% (82)
Number of households with income $10k - 20k:
Le Mars:
0.0% (0)
Iowa:
10.5% (419)
Number of households with income $20k - 30k:
Le Mars:
0.0% (0)
Iowa:
10.1% (403)
Number of households with income $30k - 40k:
Le Mars:
0.0% (0)
State:
30.2% (1,198)
Number of households with income $40k - 50k:
Le Mars:
0.0% (0)
State:
6.5% (260)
Number of households with income $50k - 60k:
Le Mars:
95.2% (20)
State:
15.7% (624)
Number of households with income $60k - 75k:
Le Mars:
0.0% (0)
State:
4.8% (192)
Number of households with income $75k - 100k:
Le Mars:
0.0% (0)
State:
10.6% (423)
Number of households with income $100k - 125k:
Le Mars:
4.8% (1)
Iowa:
3.6% (143)
Number of households with income $125k - 150k:
Le Mars:
0.0% (0)
State:
1.8% (70)
Number of households with income $150k - 200k:
Le Mars:
0.0% (0)
Iowa:
0.9% (37)
Number of households with income > $200k:
Le Mars:
0.0% (0)
State:
3.0% (121)
Aggregate household income in Le Mars in 2022: $3,457,635
Median per capita income in Le Mars in 2022:
Le Mars:
$30,578
Iowa:
$19,255
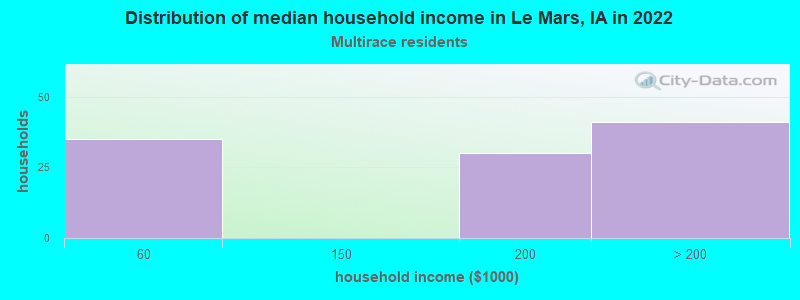
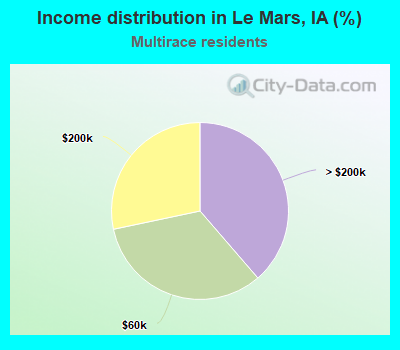
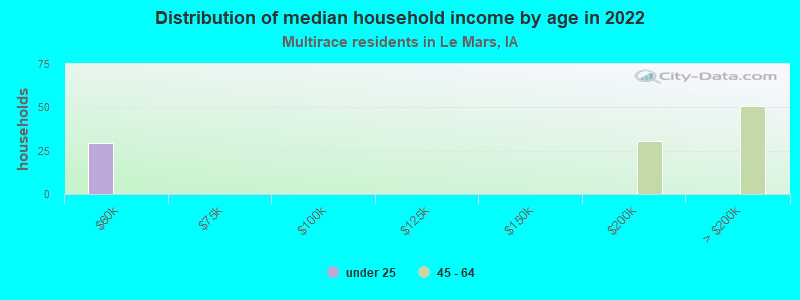
Income statistics for Multirace residents
Median household income in Le Mars, IA in 2022:
Le Mars:
$261,303
Iowa:
$61,568
Number of households with income < $10k:
Le Mars:
0.0% (0)
Iowa:
4.6% (2,786)
Number of households with income $10k - 20k:
Le Mars:
0.0% (0)
Iowa:
10.1% (6,104)
Number of households with income $20k - 30k:
Le Mars:
0.0% (0)
State:
6.9% (4,195)
Number of households with income $30k - 40k:
Le Mars:
0.0% (0)
State:
8.7% (5,248)
Number of households with income $40k - 50k:
Le Mars:
0.0% (0)
Iowa:
8.6% (5,226)
Number of households with income $50k - 60k:
Le Mars:
33.0% (35)
Iowa:
9.9% (5,986)
Number of households with income $60k - 75k:
Le Mars:
0.0% (0)
State:
11.4% (6,890)
Number of households with income $75k - 100k:
Le Mars:
0.0% (0)
Iowa:
15.2% (9,183)
Number of households with income $100k - 125k:
Le Mars:
0.0% (0)
State:
6.7% (4,072)
Number of households with income $125k - 150k:
Le Mars:
0.0% (0)
State:
4.8% (2,917)
Number of households with income $150k - 200k:
Le Mars:
28.3% (30)
State:
9.0% (5,446)
Number of households with income > $200k:
Le Mars:
38.7% (41)
State:
4.0% (2,392)
Aggregate household income in Le Mars in 2022: $35,830,605
Median per capita income in Le Mars in 2022:
Le Mars:
$134,178
State:
$24,977
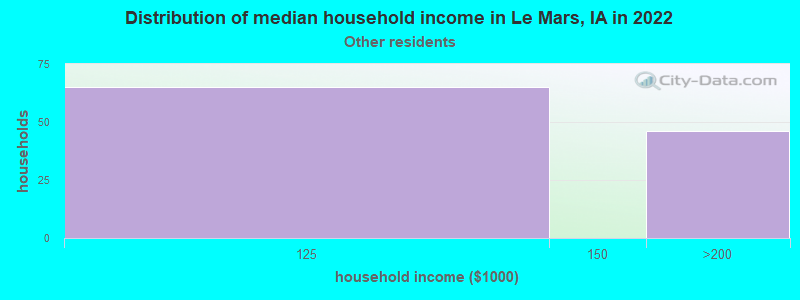
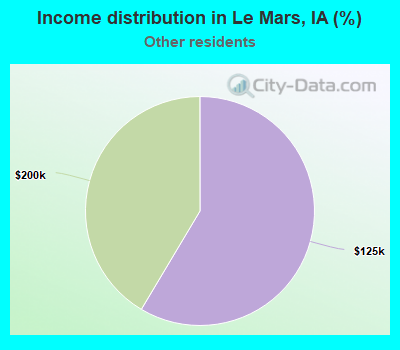
Income statistics for other residents
Number of households with income < $10k:
Le Mars:
0.0% (0)
State:
4.3% (1,004)
Number of households with income $10k - 20k:
Le Mars:
0.0% (0)
State:
8.5% (1,988)
Number of households with income $20k - 30k:
Le Mars:
0.0% (0)
State:
3.9% (900)
Number of households with income $30k - 40k:
Le Mars:
0.0% (0)
State:
10.5% (2,454)
Number of households with income $40k - 50k:
Le Mars:
0.0% (0)
State:
13.6% (3,166)
Number of households with income $50k - 60k:
Le Mars:
0.0% (0)
State:
6.7% (1,550)
Number of households with income $60k - 75k:
Le Mars:
0.0% (0)
State:
9.8% (2,286)
Number of households with income $75k - 100k:
Le Mars:
0.0% (0)
Iowa:
18.0% (4,187)
Number of households with income $100k - 125k:
Le Mars:
58.6% (65)
State:
10.3% (2,387)
Number of households with income $125k - 150k:
Le Mars:
0.0% (0)
Iowa:
5.1% (1,196)
Number of households with income $150k - 200k:
Le Mars:
41.4% (46)
State:
5.5% (1,285)
Number of households with income > $200k:
Le Mars:
0.0% (0)
State:
3.8% (879)
Aggregate household income in Le Mars in 2022: $5,670,367
Median per capita income in Le Mars in 2022:
Le Mars:
$32,985
State:
$24,763
Discuss Le Mars, Iowa (IA) on our hugely popular Iowa forum.