The median household income in Lowell, MI in 2022 was $60,323, which was 11.0% less than the median annual income of $66,986 across the entire state of Michigan. Compared to the median income of $42,326 in 2000 this represents an increase of 29.8%. The per capita income in 2022 was $30,711, which means an increase of 41.9% compared to 2000 when it was $17,843.
Whole page based on the data from 2000 / 2022 when the population of Lowell, Michigan was 4,013 / 4,138
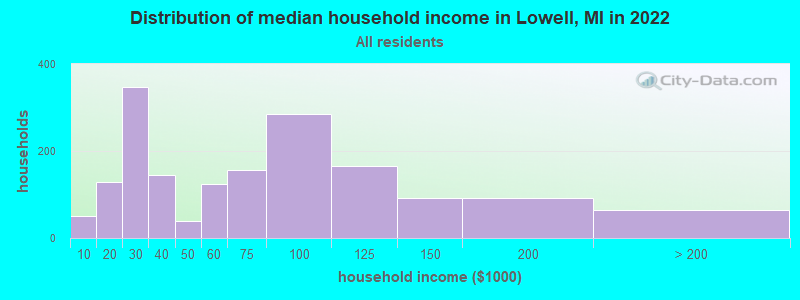
Income statistics for all residents
Median household income in Lowell, MI in 2022:
Lowell:
$60,324
State:
$66,986
Change in median household income between 2000 and 2022:
Lowell, Michigan:
+42.5%
Michigan:
+50.0%
Number of households with income < $10k:
Lowell:
3.0% (50)
State:
5.7% (231,223)
Number of households with income $10k - 20k:
Lowell:
7.6% (128)
State:
7.5% (306,955)
Number of households with income $20k - 30k:
Lowell:
20.5% (346)
State:
7.9% (324,153)
Number of households with income $30k - 40k:
Lowell:
8.6% (145)
Michigan:
8.3% (341,408)
Number of households with income $40k - 50k:
Lowell:
2.3% (39)
State:
7.9% (322,255)
Number of households with income $50k - 60k:
Lowell:
7.3% (124)
State:
7.5% (305,914)
Number of households with income $60k - 75k:
Lowell:
9.2% (156)
Michigan:
10.1% (414,440)
Number of households with income $75k - 100k:
Lowell:
16.9% (285)
State:
13.2% (538,299)
Number of households with income $100k - 125k:
Lowell:
9.8% (165)
State:
9.7% (396,282)
Number of households with income $125k - 150k:
Lowell:
5.5% (93)
State:
6.7% (273,144)
Number of households with income $150k - 200k:
Lowell:
5.5% (93)
State:
7.5% (305,077)
Number of households with income > $200k:
Lowell:
3.8% (64)
State:
8.1% (330,644)
Aggregate household income in Lowell in 2022: $123,901,197
Median family income in Lowell in 2022:
Lowell:
$77,587
State:
$85,865
Number of families with income $10k - 20k:
Lowell:
0.9% (10)
State:
3.9% (100,567)
Number of families with income $20k - 30k:
Lowell:
15.2% (158)
State:
5.0% (127,320)
Number of families with income $30k - 40k:
Lowell:
8.1% (84)
Michigan:
6.4% (163,565)
Number of families with income $40k - 50k:
Lowell:
4.3% (44)
State:
6.8% (172,384)
Number of families with income $50k - 60k:
Lowell:
8.4% (87)
State:
7.1% (179,870)
Number of families with income $60k - 75k:
Lowell:
4.8% (49)
Michigan:
10.3% (263,723)
Number of families with income $75k - 100k:
Lowell:
23.4% (242)
State:
15.0% (383,364)
Number of families with income $100k - 125k:
Lowell:
14.9% (154)
State:
11.8% (301,751)
Number of families with income $125k - 150k:
Lowell:
7.4% (77)
State:
8.6% (220,338)
Number of families with income $150k - 200k:
Lowell:
6.5% (68)
State:
10.2% (259,462)
Number of families with income > $200k:
Lowell:
6.1% (63)
State:
11.3% (287,206)
Median non-family income in Lowell in 2022:
Lowell:
$30,791
State:
$40,459
Change in median non-family income between 2000 and 2022:
Lowell, Michigan:
+31.5%
State:
+54.5%
Median per capita income in Lowell in 2022:
Lowell:
$30,712
State:
$38,151
Change in median per capita income between 2000 and 2022:
Lowell, Michigan:
+72.1%
State:
+72.1%
Income statistics for White residents
Median household income in Lowell, MI in 2022:
Lowell:
$59,887
State:
$71,609
Change in median household income between 2000 and 2022:
Lowell, Michigan:
+40.4%
State:
+52.9%
Number of households with income < $10k:
Lowell:
3.0% (50)
State:
4.4% (140,440)
Number of households with income $10k - 20k:
Lowell:
6.2% (103)
State:
6.5% (205,547)
Number of households with income $20k - 30k:
Lowell:
22.1% (367)
Michigan:
7.6% (242,254)
Number of households with income $30k - 40k:
Lowell:
9.7% (161)
State:
8.1% (257,175)
Number of households with income $40k - 50k:
Lowell:
2.3% (38)
State:
7.8% (246,839)
Number of households with income $50k - 60k:
Lowell:
6.8% (113)
State:
7.4% (233,723)
Number of households with income $60k - 75k:
Lowell:
9.5% (157)
Michigan:
10.4% (328,664)
Number of households with income $75k - 100k:
Lowell:
16.3% (271)
State:
13.6% (431,867)
Number of households with income $100k - 125k:
Lowell:
9.8% (162)
State:
10.3% (325,164)
Number of households with income $125k - 150k:
Lowell:
5.2% (87)
Michigan:
7.1% (226,232)
Number of households with income $150k - 200k:
Lowell:
5.4% (90)
Michigan:
8.1% (255,445)
Number of households with income > $200k:
Lowell:
3.7% (62)
State:
8.7% (276,727)
Aggregate household income in Lowell in 2022: $119,284,719
Median family income in Lowell in 2022:
Lowell:
$79,221
Michigan:
$90,317
Number of families with income $10k - 20k:
Lowell:
0.8% (8)
State:
3.2% (64,106)
Number of families with income $20k - 30k:
Lowell:
18.8% (195)
Michigan:
4.6% (91,551)
Number of families with income $30k - 40k:
Lowell:
9.3% (97)
Michigan:
5.9% (117,356)
Number of families with income $40k - 50k:
Lowell:
4.1% (42)
State:
6.4% (127,491)
Number of families with income $50k - 60k:
Lowell:
7.3% (76)
Michigan:
6.8% (135,883)
Number of families with income $60k - 75k:
Lowell:
4.5% (46)
State:
10.5% (209,130)
Number of families with income $75k - 100k:
Lowell:
21.5% (224)
Michigan:
15.5% (309,815)
Number of families with income $100k - 125k:
Lowell:
14.7% (153)
State:
12.4% (248,235)
Number of families with income $125k - 150k:
Lowell:
6.8% (70)
Michigan:
9.2% (182,895)
Number of families with income $150k - 200k:
Lowell:
6.5% (68)
State:
11.0% (218,573)
Number of families with income > $200k:
Lowell:
5.8% (61)
Michigan:
12.0% (239,713)
Median non-family income in Lowell in 2022:
Lowell:
$31,660
State:
$42,438
Change in median non-family income between 2000 and 2022:
Lowell, Michigan:
+34.9%
State:
+56.8%
Median per capita income in Lowell in 2022:
Lowell:
$30,362
State:
$41,514
Change in median per capita income between 2000 and 2022:
Lowell, Michigan:
+68.7%
State:
+75.2%
Income statistics for Black or African American residents
Median per capita income in Lowell in 2022:
Lowell:
$12,777
State:
$25,207
Income statistics for Hispanic or Latino residents
Median household income in Lowell, MI in 2022:
Lowell:
$32,891
Michigan:
$62,497
Change in median household income between 2000 and 2022:
Lowell, Michigan:
+65.7%
State:
+62.4%
Number of households with income < $10k:
Lowell:
0.0% (0)
State:
6.0% (10,028)
Number of households with income $10k - 20k:
Lowell:
18.0% (9)
Michigan:
6.5% (10,959)
Number of households with income $20k - 30k:
Lowell:
0.0% (0)
State:
9.1% (15,369)
Number of households with income $30k - 40k:
Lowell:
58.0% (29)
State:
7.9% (13,373)
Number of households with income $40k - 50k:
Lowell:
0.0% (0)
State:
9.1% (15,369)
Number of households with income $50k - 60k:
Lowell:
0.0% (0)
State:
8.9% (14,990)
Number of households with income $60k - 75k:
Lowell:
24.0% (12)
State:
11.5% (19,325)
Number of households with income $75k - 100k:
Lowell:
0.0% (0)
State:
14.9% (25,158)
Number of households with income $100k - 125k:
Lowell:
0.0% (0)
Michigan:
8.8% (14,758)
Number of households with income $125k - 150k:
Lowell:
0.0% (0)
State:
5.3% (8,915)
Number of households with income $150k - 200k:
Lowell:
0.0% (0)
State:
6.7% (11,249)
Number of households with income > $200k:
Lowell:
0.0% (0)
State:
5.3% (8,978)
Aggregate household income in Lowell in 2022: $2,549,518
Median per capita income in Lowell in 2022:
Lowell:
$15,993
Michigan:
$25,462
Change in median per capita income between 2000 and 2022:
Lowell, Michigan:
+63.7%
State:
+83.3%
Income statistics for Multirace residents
Aggregate household income in Lowell in 2022: $8,762,867
Median per capita income in Lowell in 2022:
Lowell:
$14,754
State:
$26,098
Change in median per capita income between 2000 and 2022:: -39.6%
Lowell, Michigan:
-39.6%
Michigan:
+106.5%
Income statistics for other residents
Median per capita income in Lowell in 2022:
Lowell:
$885
State:
$27,114
Discuss Lowell, Michigan (MI) on our hugely popular Michigan forum.