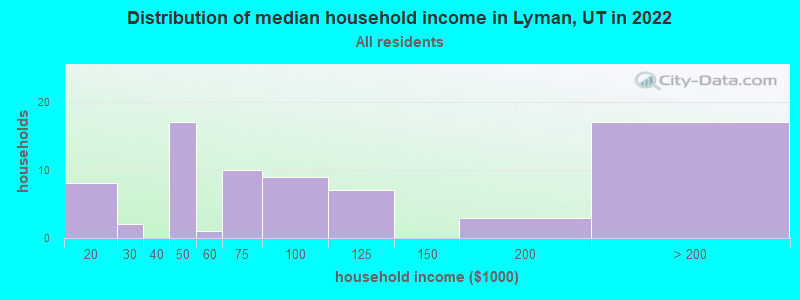
The median household income in Lyman, UT in 2022 was $69,315, which was 28.6% less than the median annual income of $89,168 across the entire state of Utah. Compared to the median income of $36,607 in 2000 this represents an increase of 47.2%. The per capita income in 2022 was $37,298, which means an increase of 66.5% compared to 2000 when it was $12,493.
Whole page based on the data from 2000 / 2022 when the population of Lyman, Utah was 234 / 206
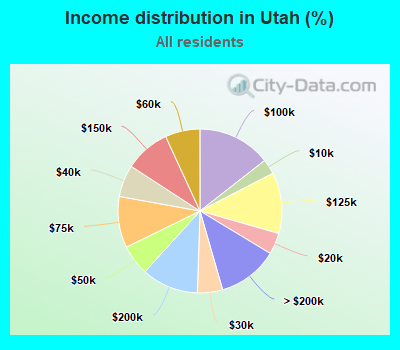
Income statistics for all residents
Median household income in Lyman, UT in 2022:
Lyman:
$69,315
State:
$89,168
Change in median household income between 2000 and 2022:
Lyman, Utah:
+89.3%
Utah:
+95.0%
Number of households with income < $10k:
Lyman:
0.0% (0)
State:
3.0% (33,488)
Number of households with income $10k - 20k:
Lyman:
10.8% (8)
State:
4.2% (47,659)
Number of households with income $20k - 30k:
Lyman:
2.7% (2)
State:
5.0% (55,999)
Number of households with income $30k - 40k:
Lyman:
0.0% (0)
State:
6.3% (71,296)
Number of households with income $40k - 50k:
Lyman:
23.0% (17)
State:
6.0% (68,315)
Number of households with income $50k - 60k:
Lyman:
1.4% (1)
Utah:
6.9% (77,538)
Number of households with income $60k - 75k:
Lyman:
13.5% (10)
State:
10.1% (114,168)
Number of households with income $75k - 100k:
Lyman:
12.2% (9)
Utah:
14.4% (163,156)
Number of households with income $100k - 125k:
Lyman:
9.5% (7)
Utah:
12.0% (135,990)
Number of households with income $125k - 150k:
Lyman:
0.0% (0)
State:
9.0% (101,240)
Number of households with income $150k - 200k:
Lyman:
4.1% (3)
Utah:
11.2% (126,570)
Number of households with income > $200k:
Lyman:
23.0% (17)
State:
11.9% (134,241)
Aggregate household income in Lyman in 2022: $8,695,539
Median family income in Lyman in 2022:
Lyman:
$72,800
State:
$102,177
Number of families with income $10k - 20k:
Lyman:
10.5% (8)
State:
2.3% (18,773)
Number of families with income $40k - 50k:
Lyman:
23.5% (17)
State:
5.0% (41,732)
Number of families with income $50k - 60k:
Lyman:
1.4% (1)
State:
6.3% (52,232)
Number of families with income $60k - 75k:
Lyman:
13.6% (10)
State:
10.0% (83,144)
Number of families with income $75k - 100k:
Lyman:
12.5% (9)
State:
15.0% (124,641)
Number of families with income $100k - 125k:
Lyman:
10.2% (7)
State:
13.7% (113,484)
Number of families with income $150k - 200k:
Lyman:
4.6% (3)
State:
13.1% (108,726)
Number of families with income > $200k:
Lyman:
23.7% (17)
Utah:
14.1% (117,149)
Median income for 2 person families:
Lyman:
$85,966
State:
$83,851
Median per capita income in Lyman in 2022:
Lyman:
$37,299
State:
$38,514
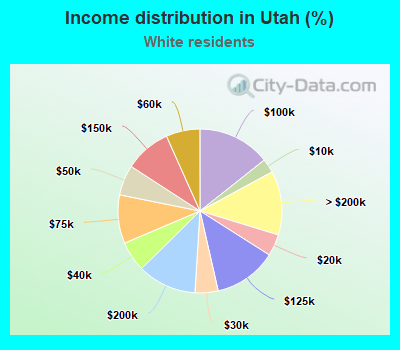
Income statistics for White residents
Median household income in Lyman, UT in 2022:
Lyman:
$69,710
State:
$92,391
Change in median household income between 2000 and 2022:
Lyman, Utah:
+90.4%
State:
+98.1%
Number of households with income < $10k:
Lyman:
0.0% (0)
State:
2.8% (26,009)
Number of households with income $10k - 20k:
Lyman:
11.0% (8)
State:
4.3% (40,322)
Number of households with income $20k - 30k:
Lyman:
2.7% (2)
State:
4.6% (42,908)
Number of households with income $30k - 40k:
Lyman:
0.0% (0)
State:
6.0% (56,214)
Number of households with income $40k - 50k:
Lyman:
23.3% (17)
State:
6.0% (56,454)
Number of households with income $50k - 60k:
Lyman:
1.4% (1)
State:
6.7% (63,011)
Number of households with income $60k - 75k:
Lyman:
12.3% (9)
Utah:
9.6% (90,095)
Number of households with income $75k - 100k:
Lyman:
12.3% (9)
State:
14.3% (135,141)
Number of households with income $100k - 125k:
Lyman:
9.6% (7)
State:
12.4% (117,040)
Number of households with income $125k - 150k:
Lyman:
0.0% (0)
State:
9.2% (86,215)
Number of households with income $150k - 200k:
Lyman:
4.1% (3)
State:
11.6% (109,741)
Number of households with income > $200k:
Lyman:
23.3% (17)
State:
12.6% (118,969)
Aggregate household income in Lyman in 2022: $8,469,048
Median family income in Lyman in 2022:
Lyman:
$73,251
State:
$106,188
Number of families with income $10k - 20k:
Lyman:
10.8% (8)
State:
2.1% (14,402)
Number of families with income $40k - 50k:
Lyman:
24.1% (17)
State:
4.8% (33,337)
Number of families with income $50k - 60k:
Lyman:
1.4% (1)
State:
5.8% (40,104)
Number of families with income $60k - 75k:
Lyman:
12.9% (9)
Utah:
9.3% (63,976)
Number of families with income $75k - 100k:
Lyman:
12.4% (9)
State:
15.1% (103,561)
Number of families with income $100k - 125k:
Lyman:
10.3% (7)
State:
14.3% (98,194)
Number of families with income $150k - 200k:
Lyman:
4.6% (3)
State:
13.8% (94,743)
Number of families with income > $200k:
Lyman:
23.6% (17)
Utah:
15.2% (104,236)
Median per capita income in Lyman in 2022:
Lyman:
$37,813
State:
$41,454
Discuss Lyman, Utah (UT) on our hugely popular Utah forum.