The median household income in Lyman, WA in 2022 was $78,250, which was 16.7% less than the median annual income of $91,306 across the entire state of Washington. Compared to the median income of $34,318 in 2000 this represents an increase of 56.1%. The per capita income in 2022 was $32,930, which means an increase of 48.3% compared to 2000 when it was $17,014.
Whole page based on the data from 2000 / 2022 when the population of Lyman, Washington was 409 / 391
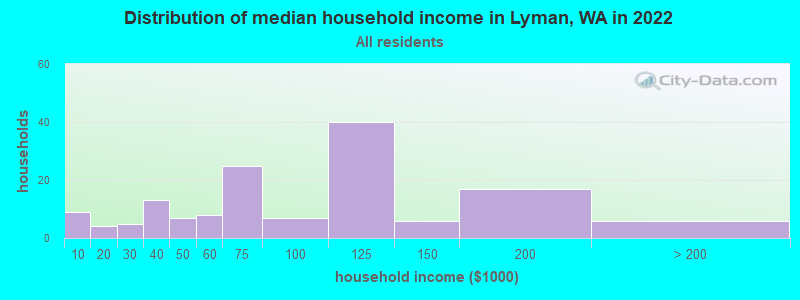
Income statistics for all residents
Median household income in Lyman, WA in 2022:
Lyman:
$78,251
State:
$91,306
Change in median household income between 2000 and 2022:
Lyman, Washington:
+128.0%
State:
+99.5%
Number of households with income < $10k:
Lyman:
6.1% (9)
State:
4.5% (139,331)
Number of households with income $10k - 20k:
Lyman:
2.7% (4)
State:
5.0% (154,508)
Number of households with income $20k - 30k:
Lyman:
3.4% (5)
State:
5.4% (166,555)
Number of households with income $30k - 40k:
Lyman:
8.8% (13)
Washington:
5.5% (170,324)
Number of households with income $40k - 50k:
Lyman:
4.8% (7)
Washington:
6.0% (183,941)
Number of households with income $50k - 60k:
Lyman:
5.4% (8)
State:
6.1% (187,395)
Number of households with income $60k - 75k:
Lyman:
17.0% (25)
State:
8.7% (266,771)
Number of households with income $75k - 100k:
Lyman:
4.8% (7)
State:
13.1% (404,672)
Number of households with income $100k - 125k:
Lyman:
27.2% (40)
State:
11.0% (337,911)
Number of households with income $125k - 150k:
Lyman:
4.1% (6)
Washington:
8.0% (244,934)
Number of households with income $150k - 200k:
Lyman:
11.6% (17)
Washington:
10.5% (323,812)
Number of households with income > $200k:
Lyman:
4.1% (6)
Washington:
16.2% (499,799)
Aggregate household income in Lyman in 2022: $12,565,266
Median family income in Lyman in 2022:
Lyman:
$105,861
Washington:
$109,192
Number of families with income < $10k:
Lyman:
2.9% (3)
Washington:
2.9% (55,953)
Number of families with income $20k - 30k:
Lyman:
1.7% (2)
State:
3.2% (61,974)
Number of families with income $30k - 40k:
Lyman:
4.3% (5)
State:
4.1% (80,240)
Number of families with income $40k - 50k:
Lyman:
7.3% (8)
Washington:
4.9% (94,310)
Number of families with income $50k - 60k:
Lyman:
0.7% (1)
State:
5.3% (101,674)
Number of families with income $60k - 75k:
Lyman:
26.8% (30)
State:
8.2% (158,348)
Number of families with income $75k - 100k:
Lyman:
2.8% (3)
Washington:
13.8% (267,812)
Number of families with income $100k - 125k:
Lyman:
32.8% (37)
Washington:
12.4% (240,213)
Number of families with income $125k - 150k:
Lyman:
0.6% (1)
State:
9.3% (180,011)
Number of families with income $150k - 200k:
Lyman:
15.1% (17)
Washington:
13.0% (250,874)
Number of families with income > $200k:
Lyman:
4.9% (6)
Washington:
20.4% (393,898)
Median non-family income in Lyman in 2022:
Lyman:
$32,153
State:
$57,299
Change in median non-family income between 2000 and 2022:
Lyman, Washington:
+13.8%
State:
+94.9%
Median per capita income in Lyman in 2022:
Lyman:
$32,931
State:
$50,764
Change in median per capita income between 2000 and 2022:
Lyman, Washington:
+93.5%
State:
+121.0%
Income statistics for White residents
Median household income in Lyman, WA in 2022:
Lyman:
$83,865
Washington:
$91,916
Change in median household income between 2000 and 2022:
Lyman, Washington:
+142.0%
State:
+95.4%
Number of households with income < $10k:
Lyman:
3.1% (4)
Washington:
4.3% (95,850)
Number of households with income $10k - 20k:
Lyman:
2.4% (3)
State:
4.8% (106,421)
Number of households with income $20k - 30k:
Lyman:
3.9% (5)
State:
5.5% (122,860)
Number of households with income $30k - 40k:
Lyman:
10.2% (13)
State:
5.4% (119,627)
Number of households with income $40k - 50k:
Lyman:
6.3% (8)
State:
5.9% (132,276)
Number of households with income $50k - 60k:
Lyman:
4.7% (6)
State:
6.1% (136,212)
Number of households with income $60k - 75k:
Lyman:
15.0% (19)
Washington:
8.8% (196,086)
Number of households with income $75k - 100k:
Lyman:
5.5% (7)
State:
13.4% (299,192)
Number of households with income $100k - 125k:
Lyman:
26.8% (34)
State:
11.3% (252,209)
Number of households with income $125k - 150k:
Lyman:
3.9% (5)
State:
7.9% (175,962)
Number of households with income $150k - 200k:
Lyman:
13.4% (17)
Washington:
10.7% (239,156)
Number of households with income > $200k:
Lyman:
4.7% (6)
Washington:
16.1% (359,917)
Aggregate household income in Lyman in 2022: $11,716,526
Median family income in Lyman in 2022:
Lyman:
$115,284
State:
$112,511
Number of families with income $20k - 30k:
Lyman:
2.2% (2)
State:
2.9% (39,288)
Number of families with income $30k - 40k:
Lyman:
5.5% (5)
Washington:
3.6% (50,190)
Number of families with income $40k - 50k:
Lyman:
8.9% (9)
Washington:
4.6% (63,009)
Number of families with income $50k - 60k:
Lyman:
0.7% (1)
State:
5.0% (69,270)
Number of families with income $60k - 75k:
Lyman:
23.1% (22)
State:
8.2% (112,369)
Number of families with income $75k - 100k:
Lyman:
3.2% (3)
State:
14.1% (194,214)
Number of families with income $100k - 125k:
Lyman:
31.7% (31)
State:
13.2% (182,184)
Number of families with income $125k - 150k:
Lyman:
0.8% (1)
State:
9.5% (130,928)
Number of families with income $150k - 200k:
Lyman:
17.9% (17)
Washington:
13.7% (188,621)
Number of families with income > $200k:
Lyman:
6.0% (6)
State:
20.8% (285,982)
Median non-family income in Lyman in 2022:
Lyman:
$31,907
Washington:
$56,103
Change in median non-family income between 2000 and 2022:
Lyman, Washington:
+9.1%
State:
+87.7%
Median per capita income in Lyman in 2022:
Lyman:
$38,404
Washington:
$55,212
Change in median per capita income between 2000 and 2022:
Lyman, Washington:
+119.9%
Washington:
+123.8%
Income statistics for Hispanic or Latino residents
Median per capita income in Lyman in 2022:
Lyman:
$3,341
Washington:
$28,252
Income statistics for Multirace residents
Median household income in Lyman, WA in 2022:
Lyman:
$73,752
Washington:
$84,303
Change in median household income between 2000 and 2022:
Lyman, Washington:
+78.8%
State:
+125.7%
Number of households with income < $10k:
Lyman:
33.3% (7)
State:
4.3% (12,040)
Number of households with income $10k - 20k:
Lyman:
0.0% (0)
Washington:
6.6% (18,437)
Number of households with income $20k - 30k:
Lyman:
0.0% (0)
Washington:
5.2% (14,559)
Number of households with income $30k - 40k:
Lyman:
0.0% (0)
State:
6.7% (18,491)
Number of households with income $40k - 50k:
Lyman:
0.0% (0)
Washington:
6.3% (17,459)
Number of households with income $50k - 60k:
Lyman:
9.5% (2)
State:
6.9% (19,086)
Number of households with income $60k - 75k:
Lyman:
28.6% (6)
State:
9.1% (25,310)
Number of households with income $75k - 100k:
Lyman:
0.0% (0)
State:
13.5% (37,493)
Number of households with income $100k - 125k:
Lyman:
28.6% (6)
State:
10.7% (29,626)
Number of households with income $125k - 150k:
Lyman:
0.0% (0)
State:
8.6% (23,899)
Number of households with income $150k - 200k:
Lyman:
0.0% (0)
State:
10.2% (28,214)
Number of households with income > $200k:
Lyman:
0.0% (0)
State:
11.9% (32,947)
Aggregate household income in Lyman in 2022: $948,449
Median per capita income in Lyman in 2022:
Lyman:
$14,042
State:
$32,496
Discuss Lyman, Washington (WA) on our hugely popular Washington forum.