The median household income in Lyndhurst, VA in 2022 was $86,166, which was about the same as the median annual income of $85,873 across the entire state of Virginia. Compared to the median income of $45,165 in 2000 this represents an increase of 47.6%. The per capita income in 2022 was $29,886, which means an increase of 38.2% compared to 2000 when it was $18,467.
Whole page based on the data from 2000 / 2022 when the population of Lyndhurst, Virginia was 1,527 / 1,764
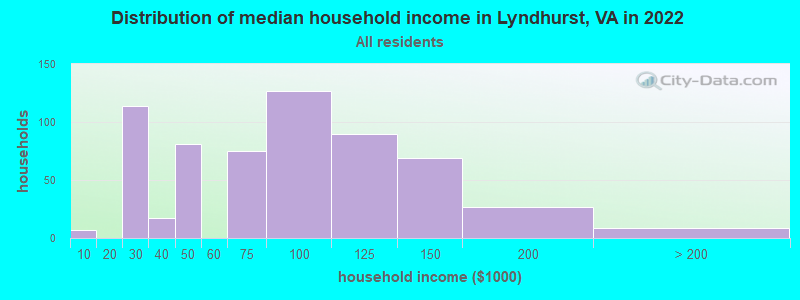
Income statistics for all residents
Median household income in Lyndhurst, VA in 2022:
Lyndhurst:
$86,167
Virginia:
$85,873
Change in median household income between 2000 and 2022:
Lyndhurst, Virginia:
+90.8%
State:
+84.0%
Number of households with income < $10k:
Lyndhurst:
1.1% (7)
Virginia:
4.9% (165,315)
Number of households with income $10k - 20k:
Lyndhurst:
0.0% (0)
State:
5.9% (199,380)
Number of households with income $20k - 30k:
Lyndhurst:
18.5% (114)
State:
6.0% (202,243)
Number of households with income $30k - 40k:
Lyndhurst:
2.8% (17)
State:
6.1% (205,967)
Number of households with income $40k - 50k:
Lyndhurst:
13.1% (81)
Virginia:
6.4% (215,648)
Number of households with income $50k - 60k:
Lyndhurst:
0.0% (0)
Virginia:
6.2% (210,516)
Number of households with income $60k - 75k:
Lyndhurst:
12.2% (75)
State:
8.6% (292,112)
Number of households with income $75k - 100k:
Lyndhurst:
20.6% (127)
State:
12.2% (412,198)
Number of households with income $100k - 125k:
Lyndhurst:
14.6% (90)
Virginia:
10.3% (348,998)
Number of households with income $125k - 150k:
Lyndhurst:
11.2% (69)
State:
7.7% (261,236)
Number of households with income $150k - 200k:
Lyndhurst:
4.4% (27)
State:
10.3% (347,282)
Number of households with income > $200k:
Lyndhurst:
1.5% (9)
State:
15.4% (519,712)
Aggregate household income in Lyndhurst in 2022: $48,951,483
Median family income in Lyndhurst in 2022:
Lyndhurst:
$82,777
Virginia:
$107,101
Number of families with income $20k - 30k:
Lyndhurst:
13.7% (66)
Virginia:
4.0% (87,860)
Number of families with income $30k - 40k:
Lyndhurst:
7.7% (37)
State:
4.7% (103,002)
Number of families with income $40k - 50k:
Lyndhurst:
3.3% (16)
State:
5.4% (118,579)
Number of families with income $60k - 75k:
Lyndhurst:
21.4% (103)
State:
8.2% (180,564)
Number of families with income $75k - 100k:
Lyndhurst:
17.0% (82)
State:
12.6% (277,221)
Number of families with income $100k - 125k:
Lyndhurst:
19.9% (95)
State:
11.3% (248,485)
Number of families with income $125k - 150k:
Lyndhurst:
12.1% (58)
State:
9.0% (197,999)
Number of families with income $150k - 200k:
Lyndhurst:
4.9% (23)
Virginia:
12.7% (278,323)
Median non-family income in Lyndhurst in 2022:
Lyndhurst:
$28,712
State:
$51,436
Change in median non-family income between 2000 and 2022:
Lyndhurst, Virginia:
+67.0%
Virginia:
+73.5%
Median per capita income in Lyndhurst in 2022:
Lyndhurst:
$29,886
Virginia:
$47,199
Change in median per capita income between 2000 and 2022:
Lyndhurst, Virginia:
+61.8%
State:
+96.9%
Income statistics for White residents
Median household income in Lyndhurst, VA in 2022:
Lyndhurst:
$85,685
State:
$91,924
Change in median household income between 2000 and 2022:
Lyndhurst, Virginia:
+86.4%
State:
+81.9%
Number of households with income < $10k:
Lyndhurst:
0.0% (0)
State:
4.1% (90,549)
Number of households with income $10k - 20k:
Lyndhurst:
0.0% (0)
Virginia:
5.2% (114,324)
Number of households with income $20k - 30k:
Lyndhurst:
17.8% (103)
State:
5.7% (125,676)
Number of households with income $30k - 40k:
Lyndhurst:
2.9% (17)
Virginia:
5.5% (121,220)
Number of households with income $40k - 50k:
Lyndhurst:
14.0% (81)
State:
6.0% (133,011)
Number of households with income $50k - 60k:
Lyndhurst:
0.0% (0)
Virginia:
6.2% (136,856)
Number of households with income $60k - 75k:
Lyndhurst:
13.3% (77)
Virginia:
8.4% (186,094)
Number of households with income $75k - 100k:
Lyndhurst:
19.5% (113)
Virginia:
12.5% (277,077)
Number of households with income $100k - 125k:
Lyndhurst:
14.5% (84)
State:
10.8% (237,562)
Number of households with income $125k - 150k:
Lyndhurst:
11.6% (67)
State:
8.0% (177,532)
Number of households with income $150k - 200k:
Lyndhurst:
4.8% (28)
State:
11.0% (242,106)
Number of households with income > $200k:
Lyndhurst:
1.7% (10)
State:
16.6% (366,064)
Aggregate household income in Lyndhurst in 2022: $47,765,794
Median family income in Lyndhurst in 2022:
Lyndhurst:
$82,807
State:
$114,708
Number of families with income $20k - 30k:
Lyndhurst:
13.9% (66)
State:
3.5% (49,027)
Number of families with income $30k - 40k:
Lyndhurst:
8.5% (40)
State:
3.8% (53,514)
Number of families with income $40k - 50k:
Lyndhurst:
3.3% (16)
State:
4.7% (66,206)
Number of families with income $60k - 75k:
Lyndhurst:
22.8% (107)
State:
8.2% (116,265)
Number of families with income $75k - 100k:
Lyndhurst:
15.7% (74)
Virginia:
12.9% (183,581)
Number of families with income $100k - 125k:
Lyndhurst:
18.7% (88)
Virginia:
11.9% (168,950)
Number of families with income $125k - 150k:
Lyndhurst:
12.0% (57)
State:
9.5% (134,452)
Number of families with income $150k - 200k:
Lyndhurst:
5.0% (24)
Virginia:
13.8% (195,800)
Median non-family income in Lyndhurst in 2022:
Lyndhurst:
$27,877
State:
$53,785
Change in median non-family income between 2000 and 2022:
Lyndhurst, Virginia:
+27.0%
Virginia:
+70.5%
Median per capita income in Lyndhurst in 2022:
Lyndhurst:
$31,310
Virginia:
$53,456
Change in median per capita income between 2000 and 2022:
Lyndhurst, Virginia:
+65.3%
State:
+99.2%
Income statistics for Black or African American residents
Aggregate household income in Lyndhurst in 2022: $4,702,106
Median per capita income in Lyndhurst in 2022:
Lyndhurst:
$36,579
State:
$34,599
Income statistics for Asian residents
Median per capita income in Lyndhurst in 2022:
Lyndhurst:
$50,298
State:
$56,055
Income statistics for Hispanic or Latino residents
Number of households with income < $10k:
Lyndhurst:
0.0% (0)
Virginia:
4.6% (11,664)
Number of households with income $10k - 20k:
Lyndhurst:
0.0% (0)
Virginia:
4.9% (12,443)
Number of households with income $20k - 30k:
Lyndhurst:
0.0% (0)
State:
5.9% (14,859)
Number of households with income $30k - 40k:
Lyndhurst:
0.0% (0)
State:
6.8% (17,059)
Number of households with income $40k - 50k:
Lyndhurst:
100.0% (35)
Virginia:
6.4% (16,261)
Number of households with income $50k - 60k:
Lyndhurst:
0.0% (0)
State:
6.9% (17,468)
Number of households with income $60k - 75k:
Lyndhurst:
0.0% (0)
Virginia:
9.6% (24,193)
Number of households with income $75k - 100k:
Lyndhurst:
0.0% (0)
Virginia:
13.2% (33,405)
Number of households with income $100k - 125k:
Lyndhurst:
0.0% (0)
State:
10.5% (26,356)
Number of households with income $125k - 150k:
Lyndhurst:
0.0% (0)
State:
8.1% (20,494)
Number of households with income $150k - 200k:
Lyndhurst:
0.0% (0)
State:
9.5% (23,943)
Number of households with income > $200k:
Lyndhurst:
0.0% (0)
State:
13.5% (33,987)
Aggregate household income in Lyndhurst in 2022: $6,689,025
Median per capita income in Lyndhurst in 2022:
Lyndhurst:
$16,862
State:
$32,277
Income statistics for Multirace residents
Median per capita income in Lyndhurst in 2022:
Lyndhurst:
$7,942
State:
$34,385
Discuss Lyndhurst, Virginia (VA) on our hugely popular Virginia forum.