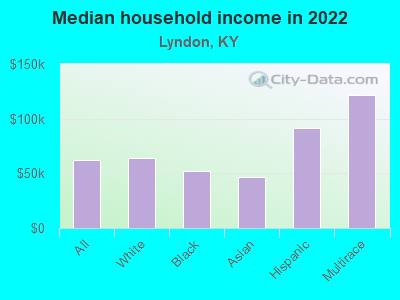
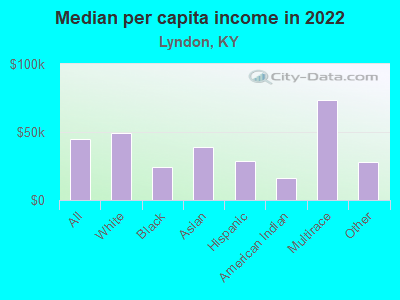
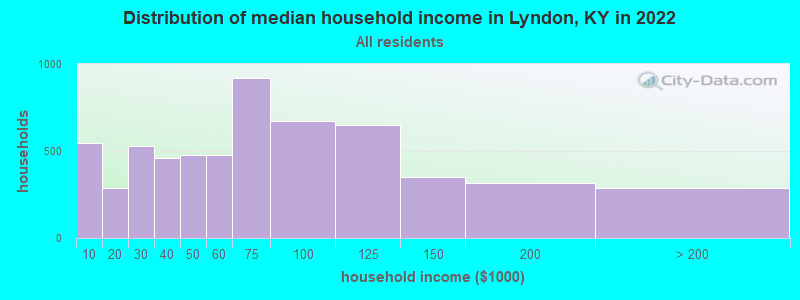
The median household income in Lyndon, KY in 2022 was $62,191, which was 4.6% greater than the median annual income of $59,341 across the entire state of Kentucky. Compared to the median income of $42,974 in 2000 this represents an increase of 30.9%. The per capita income in 2022 was $44,692, which means an increase of 40.9% compared to 2000 when it was $26,394.
Whole page based on the data from 2000 / 2022 when the population of Lyndon, Kentucky was 9,369 / 10,915
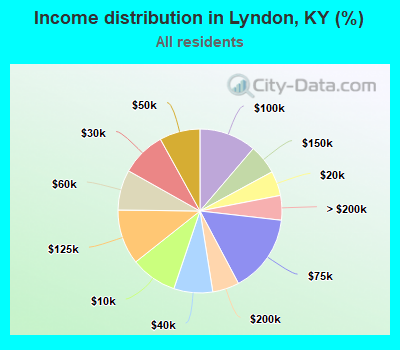
Income statistics for all residents
Median household income in Lyndon, KY in 2022:
Lyndon:
$62,192
State:
$59,341
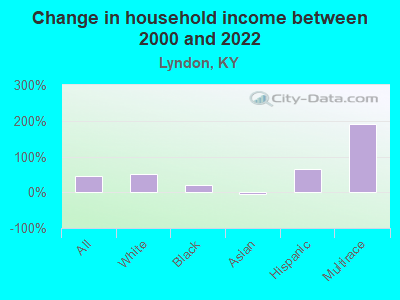
Change in median household income between 2000 and 2022:
Lyndon, Kentucky:
+44.7%
State:
+76.2%
Number of households with income < $10k:
Lyndon:
9.2% (547)
State:
6.8% (123,697)
Number of households with income $10k - 20k:
Lyndon:
4.9% (290)
State:
10.0% (182,645)
Number of households with income $20k - 30k:
Lyndon:
8.8% (527)
State:
9.0% (164,092)
Number of households with income $30k - 40k:
Lyndon:
7.7% (457)
Kentucky:
9.1% (165,607)
Number of households with income $40k - 50k:
Lyndon:
8.0% (478)
State:
8.0% (146,315)
Number of households with income $50k - 60k:
Lyndon:
8.0% (475)
State:
7.7% (140,671)
Number of households with income $60k - 75k:
Lyndon:
15.4% (920)
State:
9.8% (180,002)
Number of households with income $75k - 100k:
Lyndon:
11.2% (671)
Kentucky:
12.6% (230,239)
Number of households with income $100k - 125k:
Lyndon:
10.9% (648)
Kentucky:
9.0% (164,398)
Number of households with income $125k - 150k:
Lyndon:
5.8% (349)
State:
5.9% (108,602)
Number of households with income $150k - 200k:
Lyndon:
5.3% (315)
State:
6.2% (112,813)
Number of households with income > $200k:
Lyndon:
4.9% (290)
Kentucky:
6.0% (109,599)
Aggregate household income in Lyndon in 2022: $494,251,478
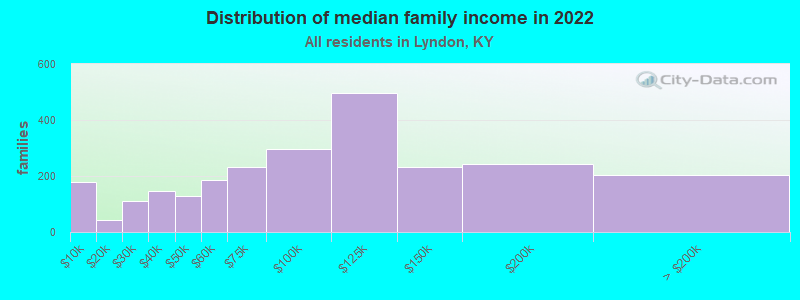
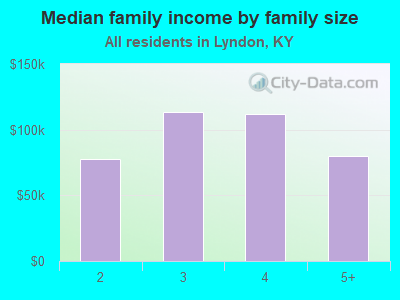
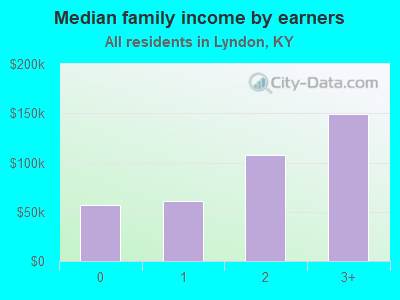
Median family income in Lyndon in 2022:
Lyndon:
$94,996
Kentucky:
$76,119
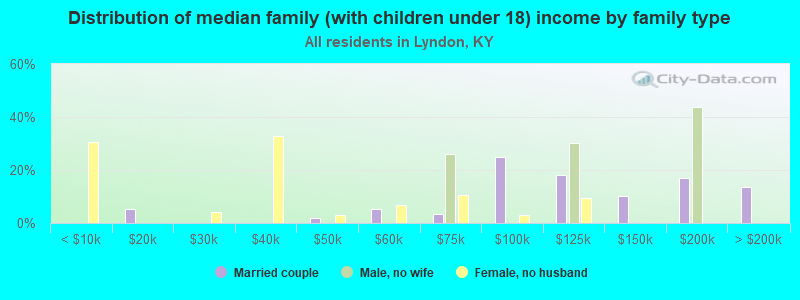
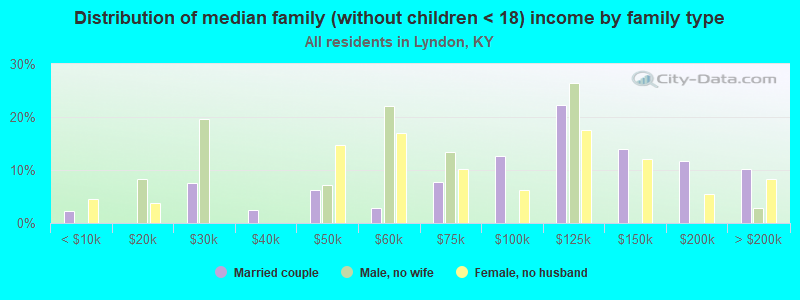
Number of families with income < $10k:
Lyndon:
7.2% (179)
State:
4.3% (50,255)
Number of families with income $10k - 20k:
Lyndon:
1.8% (44)
State:
5.4% (62,899)
Number of families with income $20k - 30k:
Lyndon:
4.4% (111)
State:
6.5% (76,765)
Number of families with income $30k - 40k:
Lyndon:
5.9% (147)
State:
8.1% (95,183)
Number of families with income $40k - 50k:
Lyndon:
5.1% (128)
State:
7.1% (83,575)
Number of families with income $50k - 60k:
Lyndon:
7.4% (186)
Kentucky:
7.4% (86,258)
Number of families with income $60k - 75k:
Lyndon:
9.3% (231)
State:
10.3% (121,229)
Number of families with income $75k - 100k:
Lyndon:
11.9% (296)
Kentucky:
14.7% (172,722)
Number of families with income $100k - 125k:
Lyndon:
19.9% (497)
State:
11.5% (134,935)
Number of families with income $125k - 150k:
Lyndon:
9.3% (232)
Kentucky:
7.9% (93,107)
Number of families with income $150k - 200k:
Lyndon:
9.7% (243)
Kentucky:
8.4% (98,984)
Number of families with income > $200k:
Lyndon:
8.1% (202)
Kentucky:
8.2% (96,213)
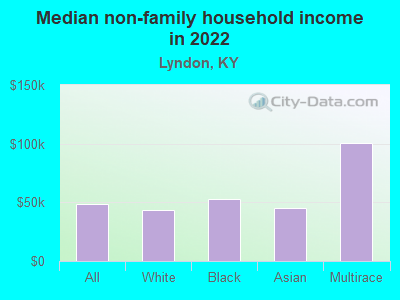
Median non-family income in Lyndon in 2022:
Lyndon:
$48,581
State:
$33,993
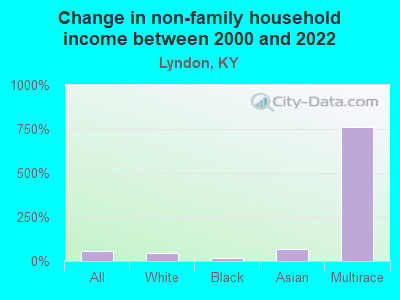
Change in median non-family income between 2000 and 2022:
Lyndon, Kentucky:
+59.5%
State:
+79.2%
Median per capita income in Lyndon in 2022:
Lyndon:
$44,692
State:
$33,980
Change in median per capita income between 2000 and 2022:
Lyndon, Kentucky:
+69.3%
State:
+87.8%
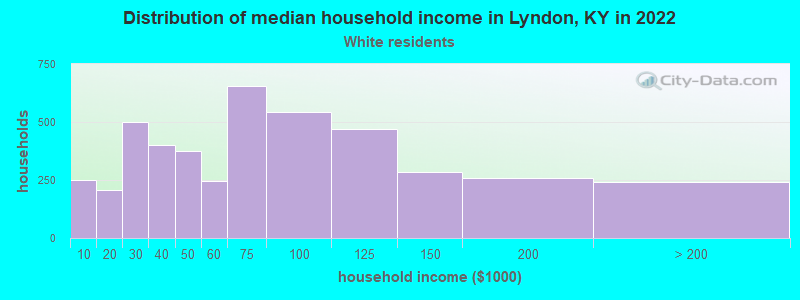
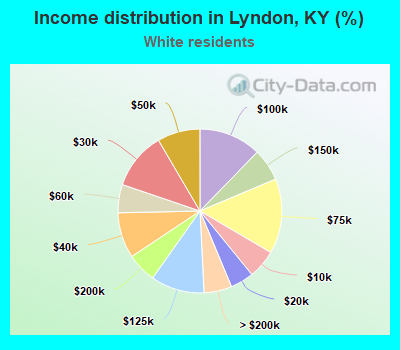
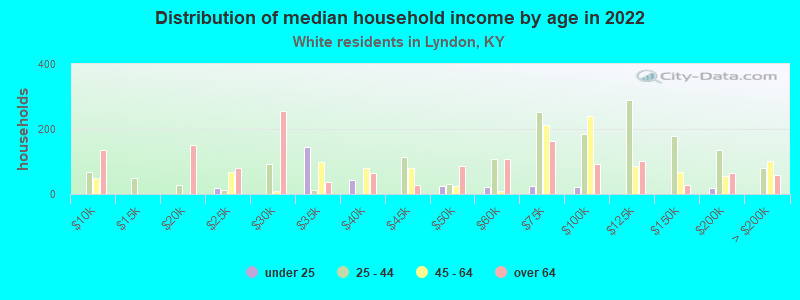
Income statistics for White residents
Median household income in Lyndon, KY in 2022:
Lyndon:
$64,255
State:
$60,987
Change in median household income between 2000 and 2022:
Lyndon, Kentucky:
+49.9%
State:
+76.2%
Number of households with income < $10k:
Lyndon:
5.7% (251)
State:
6.2% (96,690)
Number of households with income $10k - 20k:
Lyndon:
4.6% (205)
State:
9.7% (151,125)
Number of households with income $20k - 30k:
Lyndon:
11.3% (502)
State:
8.9% (139,532)
Number of households with income $30k - 40k:
Lyndon:
9.0% (399)
State:
9.1% (142,284)
Number of households with income $40k - 50k:
Lyndon:
8.4% (374)
State:
7.7% (121,151)
Number of households with income $50k - 60k:
Lyndon:
5.6% (247)
Kentucky:
7.7% (119,790)
Number of households with income $60k - 75k:
Lyndon:
14.8% (655)
State:
9.9% (154,174)
Number of households with income $75k - 100k:
Lyndon:
12.3% (544)
Kentucky:
12.8% (199,740)
Number of households with income $100k - 125k:
Lyndon:
10.6% (469)
State:
9.4% (146,284)
Number of households with income $125k - 150k:
Lyndon:
6.4% (283)
State:
6.0% (94,180)
Number of households with income $150k - 200k:
Lyndon:
5.8% (259)
State:
6.4% (100,702)
Number of households with income > $200k:
Lyndon:
5.5% (243)
Kentucky:
6.3% (98,502)
Aggregate household income in Lyndon in 2022: $378,595,230
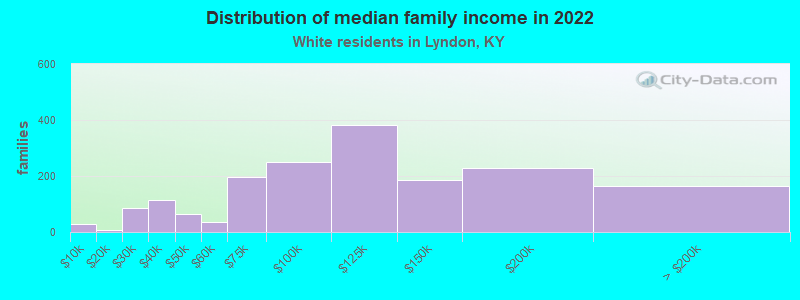
Median family income in Lyndon in 2022:
Lyndon:
$109,748
Kentucky:
$78,353
Number of families with income < $10k:
Lyndon:
1.7% (29)
State:
3.7% (37,075)
Number of families with income $10k - 20k:
Lyndon:
0.4% (6)
State:
4.9% (49,864)
Number of families with income $20k - 30k:
Lyndon:
4.9% (86)
Kentucky:
6.4% (64,043)
Number of families with income $30k - 40k:
Lyndon:
6.5% (113)
State:
8.0% (81,080)
Number of families with income $40k - 50k:
Lyndon:
3.8% (66)
State:
6.9% (69,099)
Number of families with income $50k - 60k:
Lyndon:
2.0% (34)
State:
7.2% (72,955)
Number of families with income $60k - 75k:
Lyndon:
11.2% (195)
Kentucky:
10.4% (104,587)
Number of families with income $75k - 100k:
Lyndon:
14.4% (251)
Kentucky:
15.0% (151,545)
Number of families with income $100k - 125k:
Lyndon:
21.9% (381)
State:
11.9% (120,340)
Number of families with income $125k - 150k:
Lyndon:
10.6% (185)
State:
8.1% (81,620)
Number of families with income $150k - 200k:
Lyndon:
13.1% (228)
State:
8.8% (89,097)
Number of families with income > $200k:
Lyndon:
9.5% (165)
State:
8.6% (86,849)
Median non-family income in Lyndon in 2022:
Lyndon:
$43,299
State:
$34,415
Change in median non-family income between 2000 and 2022:
Lyndon, Kentucky:
+44.8%
State:
+78.3%
Median per capita income in Lyndon in 2022:
Lyndon:
$49,162
Kentucky:
$35,352
Change in median per capita income between 2000 and 2022:
Lyndon, Kentucky:
+80.5%
State:
+90.2%
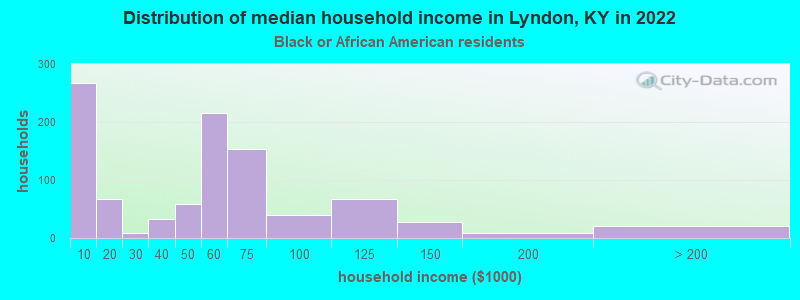
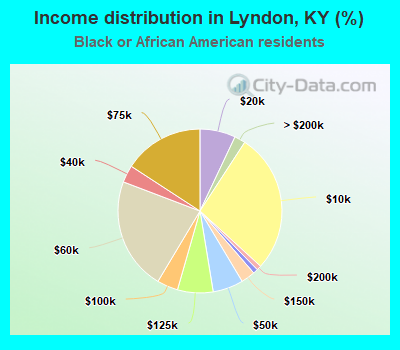
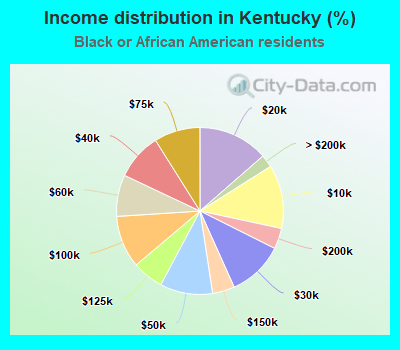
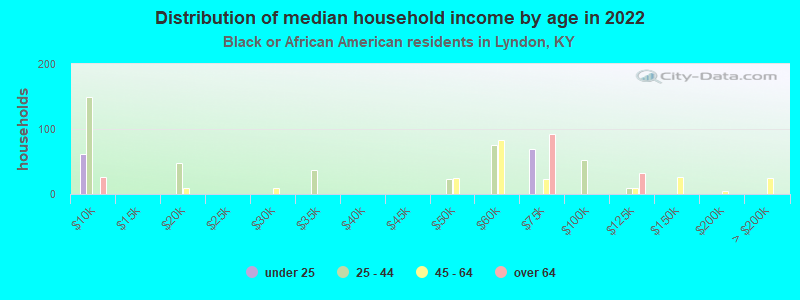
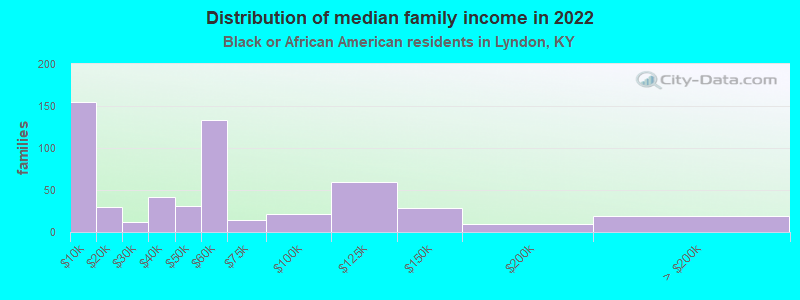
Income statistics for Black or African American residents
Median household income in Lyndon, KY in 2022:
Lyndon:
$51,683
State:
$43,977
Change in median household income between 2000 and 2022:
Lyndon, Kentucky:
+20.5%
State:
+81.1%
Number of households with income < $10k:
Lyndon:
27.6% (267)
State:
12.3% (17,072)
Number of households with income $10k - 20k:
Lyndon:
7.0% (68)
Kentucky:
13.6% (18,796)
Number of households with income $20k - 30k:
Lyndon:
0.9% (9)
Kentucky:
10.9% (15,069)
Number of households with income $30k - 40k:
Lyndon:
3.4% (33)
Kentucky:
9.0% (12,510)
Number of households with income $40k - 50k:
Lyndon:
6.0% (58)
State:
10.2% (14,121)
Number of households with income $50k - 60k:
Lyndon:
22.2% (215)
Kentucky:
8.1% (11,147)
Number of households with income $60k - 75k:
Lyndon:
15.8% (153)
Kentucky:
8.9% (12,361)
Number of households with income $75k - 100k:
Lyndon:
4.1% (40)
State:
10.1% (14,009)
Number of households with income $100k - 125k:
Lyndon:
7.0% (68)
State:
6.1% (8,400)
Number of households with income $125k - 150k:
Lyndon:
2.8% (27)
State:
4.3% (5,950)
Number of households with income $150k - 200k:
Lyndon:
0.9% (9)
State:
4.0% (5,560)
Number of households with income > $200k:
Lyndon:
2.2% (21)
Kentucky:
2.5% (3,413)
Aggregate household income in Lyndon in 2022: $49,953,623
Median family income in Lyndon in 2022:
Lyndon:
$49,924
State:
$54,745
Number of families with income < $10k:
Lyndon:
28.1% (155)
Kentucky:
10.8% (8,429)
Number of families with income $10k - 20k:
Lyndon:
5.5% (30)
State:
8.3% (6,488)
Number of families with income $20k - 30k:
Lyndon:
2.2% (12)
Kentucky:
8.4% (6,585)
Number of families with income $30k - 40k:
Lyndon:
7.7% (42)
Kentucky:
9.2% (7,211)
Number of families with income $40k - 50k:
Lyndon:
5.7% (31)
Kentucky:
9.2% (7,186)
Number of families with income $50k - 60k:
Lyndon:
24.0% (133)
State:
9.4% (7,355)
Number of families with income $60k - 75k:
Lyndon:
2.5% (14)
State:
9.3% (7,238)
Number of families with income $75k - 100k:
Lyndon:
3.7% (21)
State:
11.3% (8,866)
Number of families with income $100k - 125k:
Lyndon:
10.8% (60)
State:
8.4% (6,549)
Number of families with income $125k - 150k:
Lyndon:
5.0% (28)
State:
6.4% (5,019)
Number of families with income $150k - 200k:
Lyndon:
1.6% (9)
State:
6.1% (4,785)
Number of families with income > $200k:
Lyndon:
3.4% (19)
State:
3.1% (2,439)
Median non-family income in Lyndon in 2022:
Lyndon:
$53,155
State:
$27,637
Change in median non-family income between 2000 and 2022:
Lyndon, Kentucky:
+16.3%
State:
+76.6%
Median per capita income in Lyndon in 2022:
Lyndon:
$24,169
Kentucky:
$27,117
Change in median per capita income between 2000 and 2022:
Lyndon, Kentucky:
+3.1%
Kentucky:
+104.9%
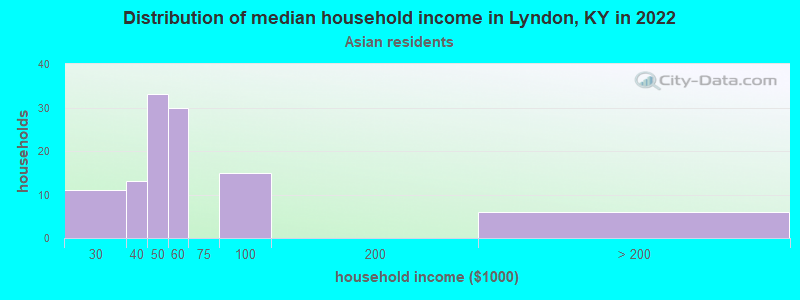
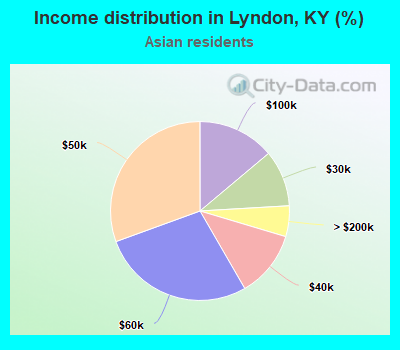
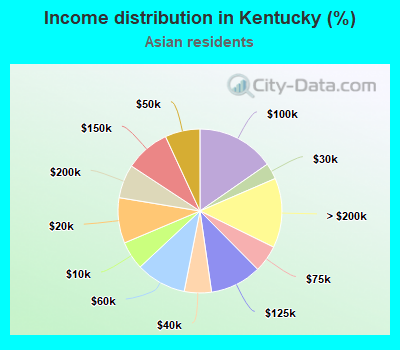
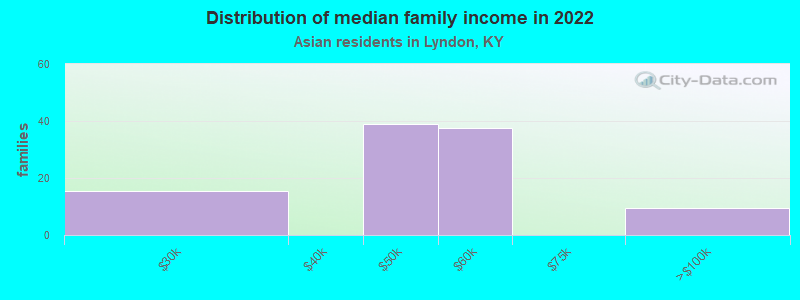
Income statistics for Asian residents
Median household income in Lyndon, KY in 2022:
Lyndon:
$46,319
State:
$84,447
Change in median household income between 2000 and 2022:: -5.0%
Lyndon, Kentucky:
-5.0%
Kentucky:
+82.7%
Number of households with income < $10k:
Lyndon:
0.0% (0)
State:
5.6% (1,233)
Number of households with income $10k - 20k:
Lyndon:
0.0% (0)
Kentucky:
9.0% (1,974)
Number of households with income $20k - 30k:
Lyndon:
10.2% (11)
Kentucky:
3.2% (700)
Number of households with income $30k - 40k:
Lyndon:
12.0% (13)
State:
5.4% (1,181)
Number of households with income $40k - 50k:
Lyndon:
30.6% (33)
State:
6.9% (1,517)
Number of households with income $50k - 60k:
Lyndon:
27.8% (30)
State:
9.9% (2,187)
Number of households with income $60k - 75k:
Lyndon:
0.0% (0)
Kentucky:
5.3% (1,173)
Number of households with income $75k - 100k:
Lyndon:
13.9% (15)
Kentucky:
15.3% (3,377)
Number of households with income $100k - 125k:
Lyndon:
0.0% (0)
State:
10.1% (2,234)
Number of households with income $125k - 150k:
Lyndon:
0.0% (0)
State:
8.9% (1,949)
Number of households with income $150k - 200k:
Lyndon:
0.0% (0)
Kentucky:
6.6% (1,463)
Number of households with income > $200k:
Lyndon:
5.6% (6)
State:
13.8% (3,028)
Aggregate household income in Lyndon in 2022: $6,916,312
Median family income in Lyndon in 2022:
Lyndon:
$38,732
Kentucky:
$97,608
Number of families with income $20k - 30k:
Lyndon:
15.2% (15)
Kentucky:
4.8% (706)
Number of families with income $40k - 50k:
Lyndon:
38.5% (39)
State:
5.2% (771)
Number of families with income $50k - 60k:
Lyndon:
37.0% (37)
State:
8.0% (1,177)
Number of families with income $75k - 100k:
Lyndon:
9.3% (9)
State:
17.0% (2,506)
Median non-family income in Lyndon in 2022:
Lyndon:
$45,442
State:
$44,541
Change in median non-family income between 2000 and 2022:
Lyndon, Kentucky:
+70.7%
State:
+83.8%
Median per capita income in Lyndon in 2022:
Lyndon:
$38,830
State:
$42,939
Change in median per capita income between 2000 and 2022:
Lyndon, Kentucky:
+45.1%
State:
+76.3%
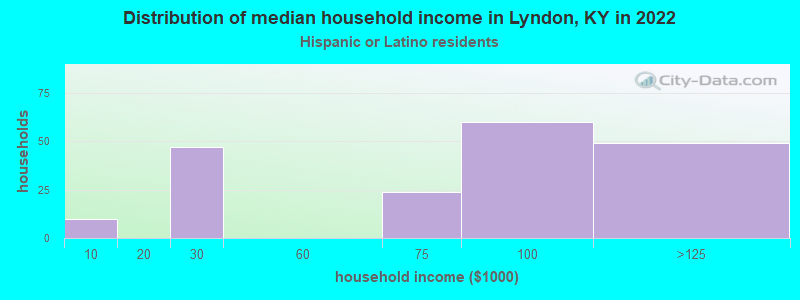
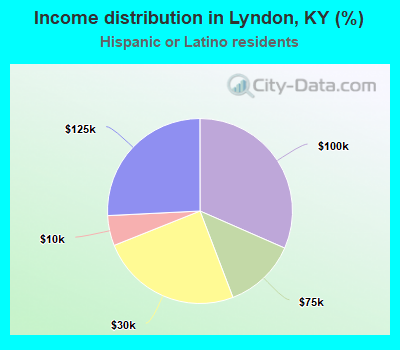
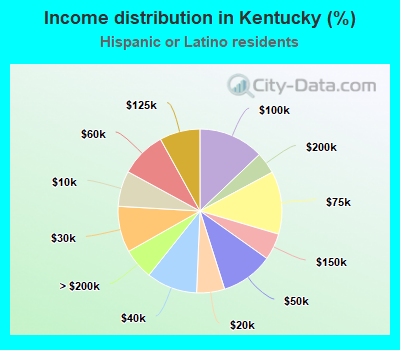
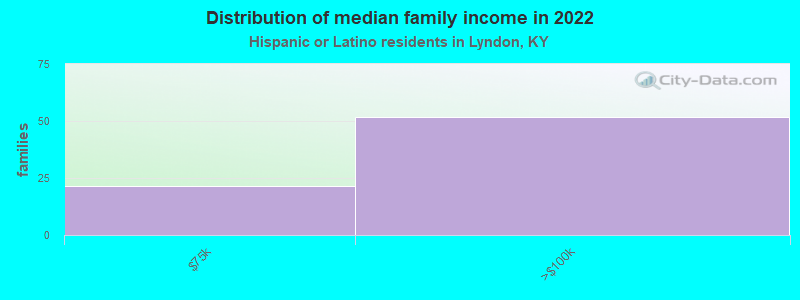
Income statistics for Hispanic or Latino residents
Median household income in Lyndon, KY in 2022:
Lyndon:
$91,874
State:
$57,971
Change in median household income between 2000 and 2022:
Lyndon, Kentucky:
+65.0%
State:
+96.2%
Number of households with income < $10k:
Lyndon:
5.3% (10)
Kentucky:
7.0% (3,568)
Number of households with income $10k - 20k:
Lyndon:
0.0% (0)
Kentucky:
5.5% (2,811)
Number of households with income $20k - 30k:
Lyndon:
24.7% (47)
State:
9.1% (4,637)
Number of households with income $30k - 40k:
Lyndon:
0.0% (0)
State:
10.0% (5,109)
Number of households with income $40k - 50k:
Lyndon:
0.0% (0)
State:
10.3% (5,241)
Number of households with income $50k - 60k:
Lyndon:
0.0% (0)
Kentucky:
9.1% (4,609)
Number of households with income $60k - 75k:
Lyndon:
12.6% (24)
State:
12.4% (6,299)
Number of households with income $75k - 100k:
Lyndon:
31.6% (60)
State:
12.9% (6,562)
Number of households with income $100k - 125k:
Lyndon:
25.8% (49)
State:
8.0% (4,066)
Number of households with income $125k - 150k:
Lyndon:
0.0% (0)
State:
5.3% (2,685)
Number of households with income $150k - 200k:
Lyndon:
0.0% (0)
State:
4.3% (2,173)
Number of households with income > $200k:
Lyndon:
0.0% (0)
State:
6.1% (3,099)
Aggregate household income in Lyndon in 2022: $18,710,978
Median family income in Lyndon in 2022:
Lyndon:
$91,546
State:
$58,603
Number of families with income $60k - 75k:
Lyndon:
29.1% (21)
State:
10.1% (3,652)
Number of families with income $75k - 100k:
Lyndon:
70.9% (52)
State:
13.4% (4,856)
Median per capita income in Lyndon in 2022:
Lyndon:
$28,542
State:
$24,650
Change in median per capita income between 2000 and 2022:
Lyndon, Kentucky:
+47.8%
State:
+106.1%
Income statistics for American Indian and Alaska Native residents
Median per capita income in Lyndon in 2022:
Lyndon:
$15,882
Kentucky:
$18,045
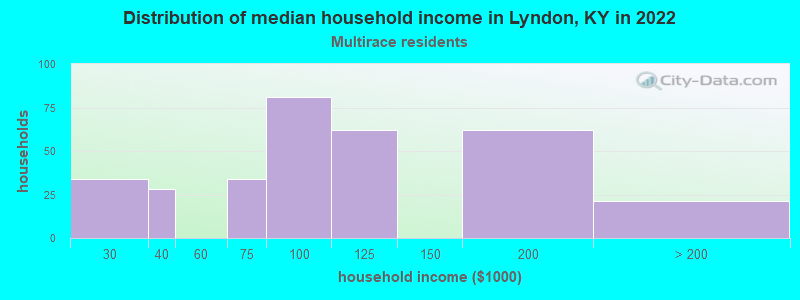
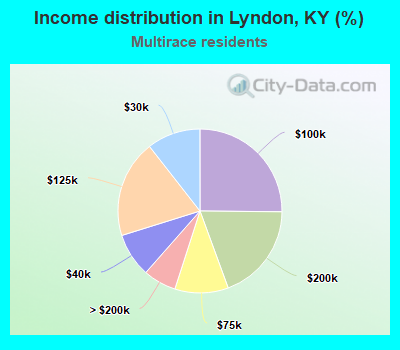
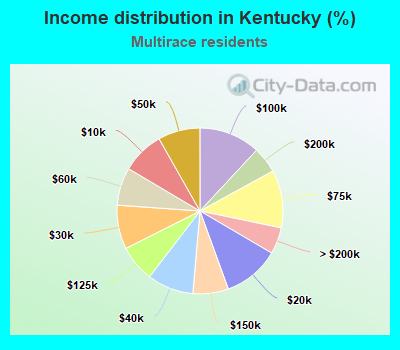
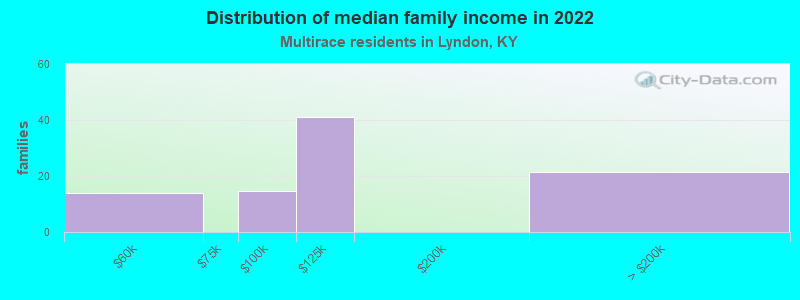
Income statistics for Multirace residents
Median household income in Lyndon, KY in 2022:
Lyndon:
$121,836
State:
$56,359
Number of households with income < $10k:
Lyndon:
0.0% (0)
State:
8.3% (6,780)
Number of households with income $10k - 20k:
Lyndon:
0.0% (0)
State:
11.0% (9,005)
Number of households with income $20k - 30k:
Lyndon:
10.6% (34)
State:
8.6% (7,004)
Number of households with income $30k - 40k:
Lyndon:
8.7% (28)
Kentucky:
9.0% (7,406)
Number of households with income $40k - 50k:
Lyndon:
0.0% (0)
State:
8.2% (6,707)
Number of households with income $50k - 60k:
Lyndon:
0.0% (0)
State:
7.4% (6,048)
Number of households with income $60k - 75k:
Lyndon:
10.6% (34)
State:
11.2% (9,202)
Number of households with income $75k - 100k:
Lyndon:
25.2% (81)
State:
11.9% (9,767)
Number of households with income $100k - 125k:
Lyndon:
19.3% (62)
Kentucky:
7.1% (5,846)
Number of households with income $125k - 150k:
Lyndon:
0.0% (0)
State:
6.9% (5,667)
Number of households with income $150k - 200k:
Lyndon:
19.3% (62)
State:
5.1% (4,171)
Number of households with income > $200k:
Lyndon:
6.5% (21)
State:
5.2% (4,241)
Aggregate household income in Lyndon in 2022: $65,080,292
Median family income in Lyndon in 2022:
Lyndon:
$117,831
State:
$67,296
Number of families with income $50k - 60k:
Lyndon:
15.5% (14)
Kentucky:
7.3% (3,995)
Number of families with income $75k - 100k:
Lyndon:
16.0% (15)
Kentucky:
13.8% (7,574)
Number of families with income $100k - 125k:
Lyndon:
45.1% (41)
State:
8.8% (4,835)
Number of families with income > $200k:
Lyndon:
23.5% (21)
Kentucky:
7.1% (3,913)
Median non-family income in Lyndon in 2022:
Lyndon:
$100,328
Kentucky:
$33,660
Median per capita income in Lyndon in 2022:
Lyndon:
$73,377
State:
$25,670
Income statistics for other residents
Number of households with income < $10k:
Lyndon:
0.0% (0)
Kentucky:
7.2% (1,360)
Number of households with income $10k - 20k:
Lyndon:
0.0% (0)
Kentucky:
8.0% (1,524)
Number of households with income $20k - 30k:
Lyndon:
0.0% (0)
State:
8.6% (1,635)
Number of households with income $30k - 40k:
Lyndon:
0.0% (0)
State:
11.1% (2,110)
Number of households with income $40k - 50k:
Lyndon:
0.0% (0)
State:
12.0% (2,269)
Number of households with income $50k - 60k:
Lyndon:
0.0% (0)
Kentucky:
5.1% (964)
Number of households with income $60k - 75k:
Lyndon:
100.0% (35)
Kentucky:
13.0% (2,456)
Number of households with income $75k - 100k:
Lyndon:
0.0% (0)
State:
17.5% (3,305)
Number of households with income $100k - 125k:
Lyndon:
0.0% (0)
State:
7.6% (1,433)
Number of households with income $125k - 150k:
Lyndon:
0.0% (0)
State:
3.4% (649)
Number of households with income $150k - 200k:
Lyndon:
0.0% (0)
Kentucky:
4.4% (833)
Number of households with income > $200k:
Lyndon:
0.0% (0)
State:
2.1% (395)
Aggregate household income in Lyndon in 2022: $6,543,214
Median per capita income in Lyndon in 2022:
Lyndon:
$27,822
Kentucky:
$20,913
Change in median per capita income between 2000 and 2022:
Lyndon, Kentucky:
+70.6%
State:
+98.1%
Discuss Lyndon, Kentucky (KY) on our hugely popular Kentucky forum.