The median household income in Maltby, WA in 2022 was $163,812, which was 44.3% greater than the median annual income of $91,306 across the entire state of Washington. Compared to the median income of $77,534 in 2000 this represents an increase of 52.7%. The per capita income in 2022 was $67,708, which means an increase of 56.7% compared to 2000 when it was $29,330.
Whole page based on the data from 2000 / 2022 when the population of Maltby, Washington was 8,267 / 11,508
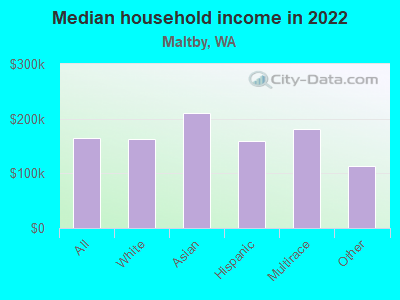
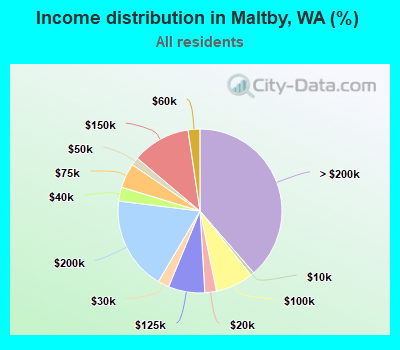
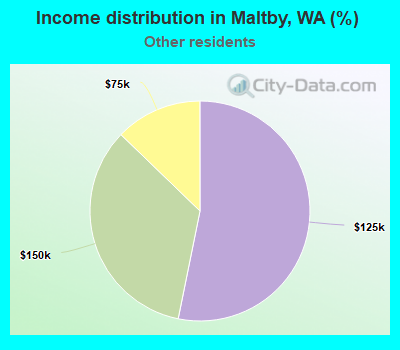
Income statistics for all residents
Median household income in Maltby, WA in 2022:
Maltby:
$163,812
Washington:
$91,306
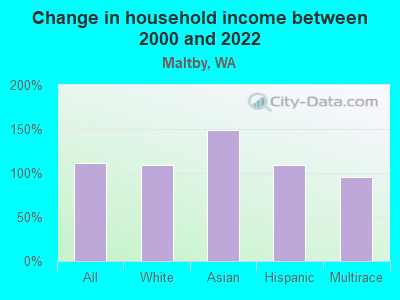
Change in median household income between 2000 and 2022:
Maltby, Washington:
+111.3%
State:
+99.5%
Number of households with income < $10k:
Maltby:
0.7% (28)
State:
4.5% (139,331)
Number of households with income $10k - 20k:
Maltby:
2.3% (90)
State:
5.0% (154,508)
Number of households with income $20k - 30k:
Maltby:
2.2% (88)
State:
5.4% (166,555)
Number of households with income $30k - 40k:
Maltby:
2.8% (109)
State:
5.5% (170,324)
Number of households with income $40k - 50k:
Maltby:
1.6% (63)
State:
6.0% (183,941)
Number of households with income $50k - 60k:
Maltby:
2.3% (92)
Washington:
6.1% (187,395)
Number of households with income $60k - 75k:
Maltby:
4.8% (192)
State:
8.7% (266,771)
Number of households with income $75k - 100k:
Maltby:
7.5% (296)
Washington:
13.1% (404,672)
Number of households with income $100k - 125k:
Maltby:
7.2% (285)
State:
11.0% (337,911)
Number of households with income $125k - 150k:
Maltby:
11.5% (457)
State:
8.0% (244,934)
Number of households with income $150k - 200k:
Maltby:
18.5% (732)
Washington:
10.5% (323,812)
Number of households with income > $200k:
Maltby:
38.6% (1,530)
Washington:
16.2% (499,799)
Aggregate household income in Maltby in 2022: $753,762,504
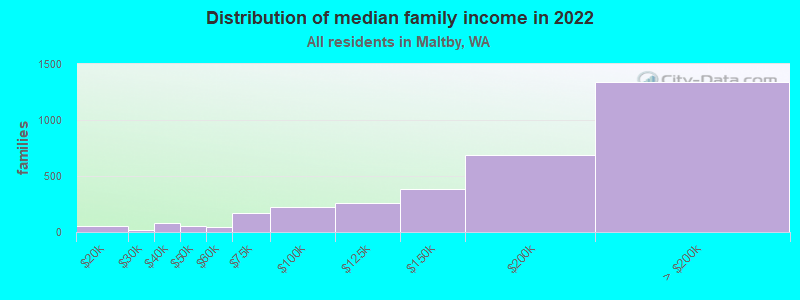
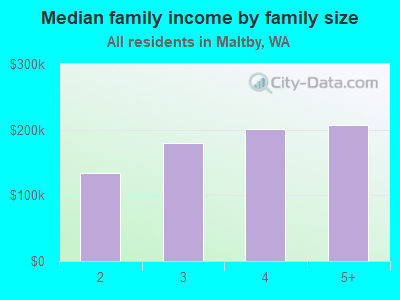
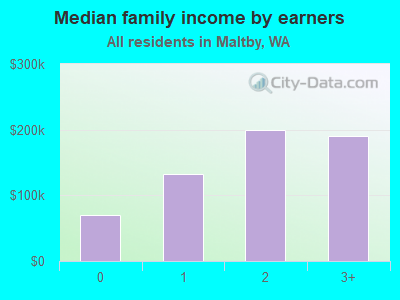
Median family income in Maltby in 2022:
Maltby:
$174,788
State:
$109,192
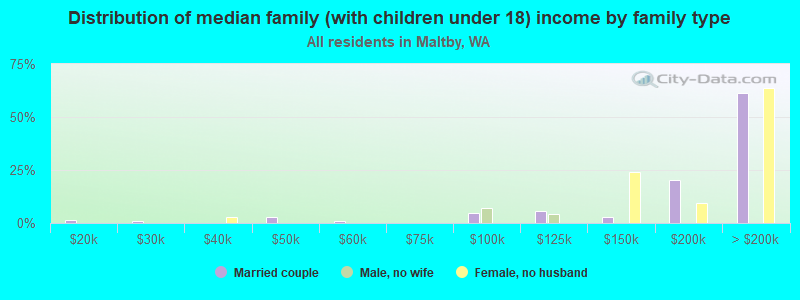
Number of families with income $10k - 20k:
Maltby:
1.7% (55)
State:
2.6% (50,138)
Number of families with income $20k - 30k:
Maltby:
0.7% (22)
Washington:
3.2% (61,974)
Number of families with income $30k - 40k:
Maltby:
2.4% (80)
State:
4.1% (80,240)
Number of families with income $40k - 50k:
Maltby:
1.6% (53)
Washington:
4.9% (94,310)
Number of families with income $50k - 60k:
Maltby:
1.3% (42)
State:
5.3% (101,674)
Number of families with income $60k - 75k:
Maltby:
5.0% (166)
State:
8.2% (158,348)
Number of families with income $75k - 100k:
Maltby:
6.8% (224)
State:
13.8% (267,812)
Number of families with income $100k - 125k:
Maltby:
7.8% (259)
State:
12.4% (240,213)
Number of families with income $125k - 150k:
Maltby:
11.6% (385)
Washington:
9.3% (180,011)
Number of families with income $150k - 200k:
Maltby:
20.8% (689)
Washington:
13.0% (250,874)
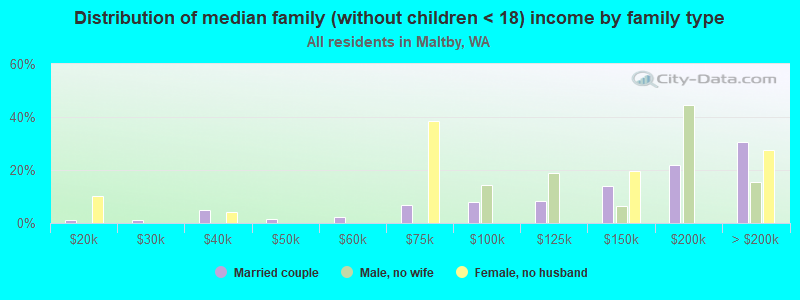
Number of families with income > $200k:
Maltby:
40.5% (1,342)
State:
20.4% (393,898)
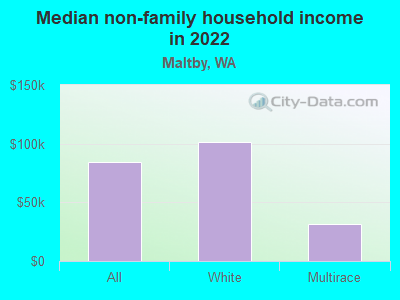
Median non-family income in Maltby in 2022:
Maltby:
$84,246
Washington:
$57,299
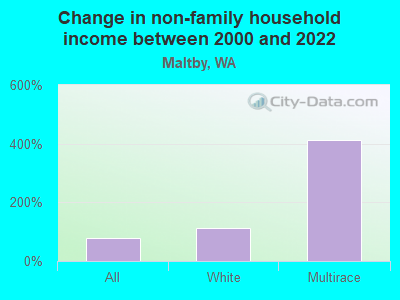
Change in median non-family income between 2000 and 2022:
Maltby, Washington:
+79.4%
Washington:
+94.9%
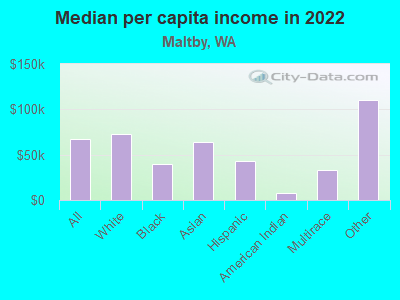
Median per capita income in Maltby in 2022:
Maltby:
$67,709
State:
$50,764
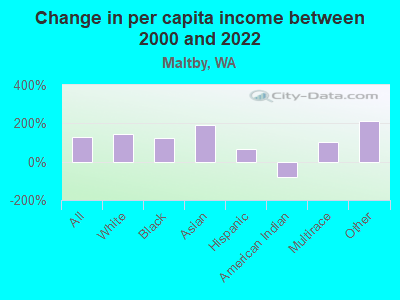
Change in median per capita income between 2000 and 2022:
Maltby, Washington:
+130.9%
State:
+121.0%
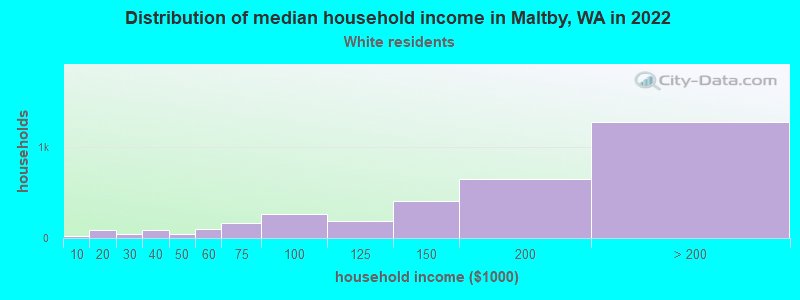
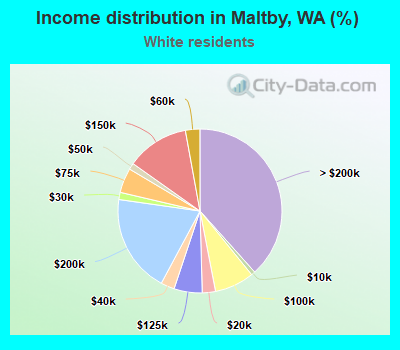
Income statistics for White residents
Median household income in Maltby, WA in 2022:
Maltby:
$161,970
State:
$91,916
Change in median household income between 2000 and 2022:
Maltby, Washington:
+109.1%
State:
+95.4%
Number of households with income < $10k:
Maltby:
0.8% (26)
State:
4.3% (95,850)
Number of households with income $10k - 20k:
Maltby:
2.6% (87)
Washington:
4.8% (106,421)
Number of households with income $20k - 30k:
Maltby:
1.4% (47)
State:
5.5% (122,860)
Number of households with income $30k - 40k:
Maltby:
2.7% (90)
Washington:
5.4% (119,627)
Number of households with income $40k - 50k:
Maltby:
1.3% (42)
Washington:
5.9% (132,276)
Number of households with income $50k - 60k:
Maltby:
2.9% (95)
State:
6.1% (136,212)
Number of households with income $60k - 75k:
Maltby:
4.9% (163)
State:
8.8% (196,086)
Number of households with income $75k - 100k:
Maltby:
7.8% (260)
Washington:
13.4% (299,192)
Number of households with income $100k - 125k:
Maltby:
5.6% (185)
State:
11.3% (252,209)
Number of households with income $125k - 150k:
Maltby:
12.3% (411)
Washington:
7.9% (175,962)
Number of households with income $150k - 200k:
Maltby:
19.4% (647)
State:
10.7% (239,156)
Number of households with income > $200k:
Maltby:
38.4% (1,279)
Washington:
16.1% (359,917)
Aggregate household income in Maltby in 2022: $635,499,509
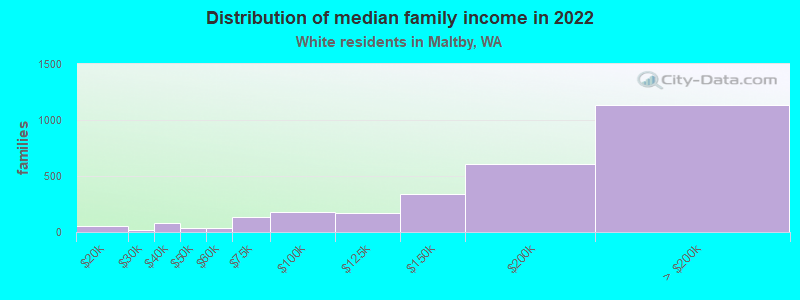
Median family income in Maltby in 2022:
Maltby:
$176,464
State:
$112,511
Number of families with income $10k - 20k:
Maltby:
2.0% (54)
Washington:
2.0% (28,228)
Number of families with income $20k - 30k:
Maltby:
0.6% (15)
Washington:
2.9% (39,288)
Number of families with income $30k - 40k:
Maltby:
2.8% (77)
State:
3.6% (50,190)
Number of families with income $40k - 50k:
Maltby:
1.2% (34)
State:
4.6% (63,009)
Number of families with income $50k - 60k:
Maltby:
1.4% (38)
State:
5.0% (69,270)
Number of families with income $60k - 75k:
Maltby:
4.7% (130)
State:
8.2% (112,369)
Number of families with income $75k - 100k:
Maltby:
6.4% (178)
Washington:
14.1% (194,214)
Number of families with income $100k - 125k:
Maltby:
6.0% (167)
State:
13.2% (182,184)
Number of families with income $125k - 150k:
Maltby:
12.1% (335)
State:
9.5% (130,928)
Number of families with income $150k - 200k:
Maltby:
22.0% (610)
Washington:
13.7% (188,621)
Number of families with income > $200k:
Maltby:
40.8% (1,132)
State:
20.8% (285,982)
Median non-family income in Maltby in 2022:
Maltby:
$101,272
Washington:
$56,103
Change in median non-family income between 2000 and 2022:
Maltby, Washington:
+113.4%
Washington:
+87.7%
Median per capita income in Maltby in 2022:
Maltby:
$72,722
State:
$55,212
Change in median per capita income between 2000 and 2022:
Maltby, Washington:
+143.7%
State:
+123.8%
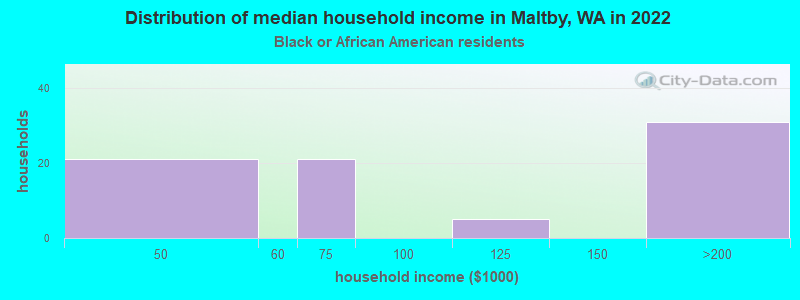
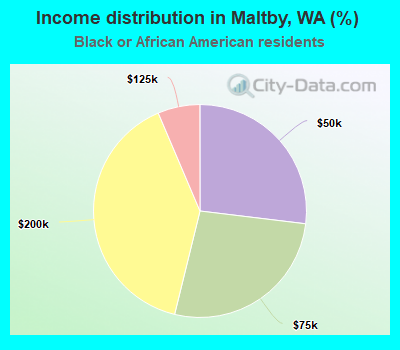
Income statistics for Black or African American residents
Number of households with income < $10k:
Maltby:
0.0% (0)
State:
7.2% (8,014)
Number of households with income $10k - 20k:
Maltby:
0.0% (0)
State:
8.0% (8,904)
Number of households with income $20k - 30k:
Maltby:
0.0% (0)
State:
7.4% (8,207)
Number of households with income $30k - 40k:
Maltby:
0.0% (0)
State:
5.6% (6,220)
Number of households with income $40k - 50k:
Maltby:
26.9% (21)
State:
9.5% (10,585)
Number of households with income $50k - 60k:
Maltby:
0.0% (0)
Washington:
7.3% (8,078)
Number of households with income $60k - 75k:
Maltby:
26.9% (21)
Washington:
8.7% (9,704)
Number of households with income $75k - 100k:
Maltby:
0.0% (0)
State:
12.9% (14,315)
Number of households with income $100k - 125k:
Maltby:
6.4% (5)
State:
7.7% (8,592)
Number of households with income $125k - 150k:
Maltby:
0.0% (0)
State:
8.9% (9,840)
Number of households with income $150k - 200k:
Maltby:
39.7% (31)
State:
7.6% (8,434)
Number of households with income > $200k:
Maltby:
0.0% (0)
Washington:
9.1% (10,075)
Aggregate household income in Maltby in 2022: $8,018,813
Median per capita income in Maltby in 2022:
Maltby:
$40,196
State:
$38,209
Change in median per capita income between 2000 and 2022:
Maltby, Washington:
+126.1%
Washington:
+115.3%
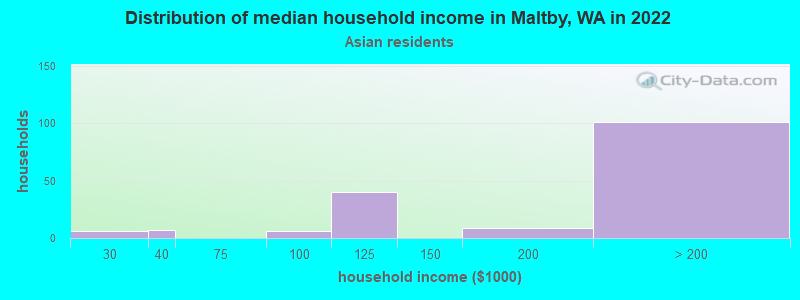
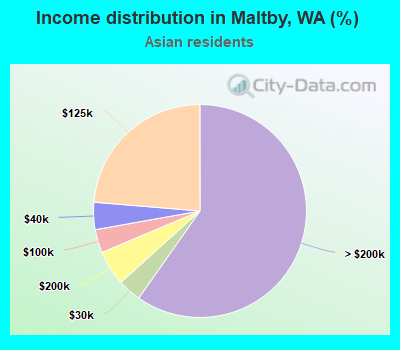
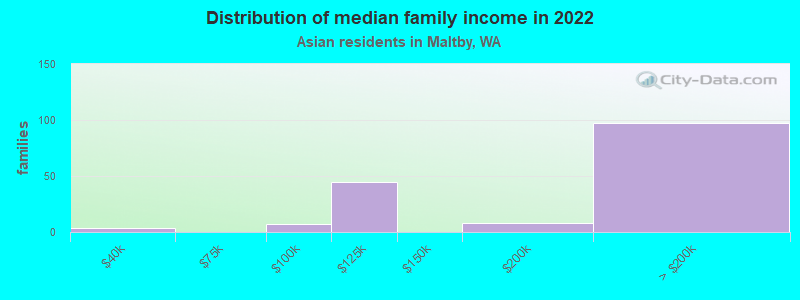
Income statistics for Asian residents
Median household income in Maltby, WA in 2022:
Maltby:
$210,839
Washington:
$125,692
Change in median household income between 2000 and 2022:
Maltby, Washington:
+149.5%
State:
+164.5%
Number of households with income < $10k:
Maltby:
0.0% (0)
Washington:
4.9% (14,099)
Number of households with income $10k - 20k:
Maltby:
0.0% (0)
Washington:
3.5% (9,873)
Number of households with income $20k - 30k:
Maltby:
3.6% (6)
Washington:
2.9% (8,352)
Number of households with income $30k - 40k:
Maltby:
4.1% (7)
State:
4.0% (11,415)
Number of households with income $40k - 50k:
Maltby:
0.0% (0)
State:
4.0% (11,421)
Number of households with income $50k - 60k:
Maltby:
0.0% (0)
State:
4.2% (12,100)
Number of households with income $60k - 75k:
Maltby:
0.0% (0)
Washington:
6.3% (17,903)
Number of households with income $75k - 100k:
Maltby:
3.6% (6)
State:
10.4% (29,663)
Number of households with income $100k - 125k:
Maltby:
23.7% (40)
Washington:
9.4% (26,839)
Number of households with income $125k - 150k:
Maltby:
0.0% (0)
State:
8.5% (24,200)
Number of households with income $150k - 200k:
Maltby:
5.3% (9)
State:
12.6% (35,976)
Number of households with income > $200k:
Maltby:
59.8% (101)
State:
29.2% (83,109)
Aggregate household income in Maltby in 2022: $36,564,258
Median family income in Maltby in 2022:
Maltby:
$201,548
State:
$143,595
Number of families with income $30k - 40k:
Maltby:
2.2% (4)
Washington:
3.1% (5,734)
Number of families with income $75k - 100k:
Maltby:
4.4% (7)
State:
11.7% (21,919)
Number of families with income $100k - 125k:
Maltby:
27.7% (44)
State:
9.3% (17,280)
Number of families with income $150k - 200k:
Maltby:
5.0% (8)
State:
13.3% (24,789)
Number of families with income > $200k:
Maltby:
60.8% (98)
State:
34.4% (64,250)
Median per capita income in Maltby in 2022:
Maltby:
$63,705
State:
$67,666
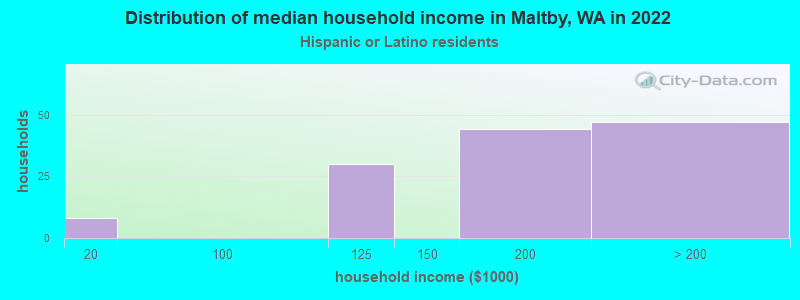
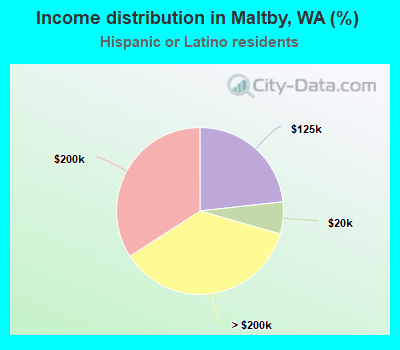
Income statistics for Hispanic or Latino residents
Median household income in Maltby, WA in 2022:
Maltby:
$159,384
State:
$74,770
Change in median household income between 2000 and 2022:
Maltby, Washington:
+109.2%
State:
+128.3%
Number of households with income < $10k:
Maltby:
0.0% (0)
Washington:
4.9% (14,456)
Number of households with income $10k - 20k:
Maltby:
6.2% (8)
Washington:
5.3% (15,449)
Number of households with income $20k - 30k:
Maltby:
0.0% (0)
State:
6.8% (20,016)
Number of households with income $30k - 40k:
Maltby:
0.0% (0)
Washington:
7.7% (22,548)
Number of households with income $40k - 50k:
Maltby:
0.0% (0)
State:
7.3% (21,450)
Number of households with income $50k - 60k:
Maltby:
0.0% (0)
State:
7.7% (22,744)
Number of households with income $60k - 75k:
Maltby:
0.0% (0)
State:
10.5% (30,737)
Number of households with income $75k - 100k:
Maltby:
0.0% (0)
State:
14.9% (43,843)
Number of households with income $100k - 125k:
Maltby:
23.3% (30)
State:
11.1% (32,554)
Number of households with income $125k - 150k:
Maltby:
0.0% (0)
State:
7.4% (21,624)
Number of households with income $150k - 200k:
Maltby:
34.1% (44)
State:
7.3% (21,360)
Number of households with income > $200k:
Maltby:
36.4% (47)
Washington:
9.2% (27,055)
Aggregate household income in Maltby in 2022: $28,506,776
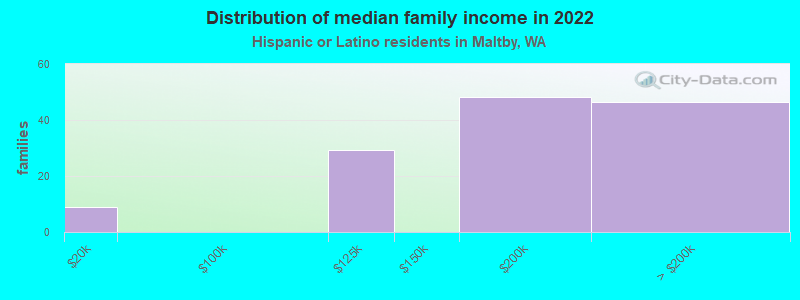
Median family income in Maltby in 2022:
Maltby:
$151,950
State:
$76,866
Number of families with income $10k - 20k:
Maltby:
6.8% (9)
Washington:
3.5% (7,524)
Number of families with income $100k - 125k:
Maltby:
22.0% (29)
State:
11.4% (24,331)
Number of families with income $150k - 200k:
Maltby:
36.3% (48)
State:
8.2% (17,551)
Number of families with income > $200k:
Maltby:
34.9% (46)
Washington:
9.7% (20,653)
Median per capita income in Maltby in 2022:
Maltby:
$42,625
State:
$28,252
Change in median per capita income between 2000 and 2022:
Maltby, Washington:
+65.9%
Washington:
+150.2%
Income statistics for American Indian and Alaska Native residents
Median per capita income in Maltby in 2022:
Maltby:
$7,537
Washington:
$27,053
Change in median per capita income between 2000 and 2022:: -80.5%
Maltby, Washington:
-80.5%
State:
+98.6%
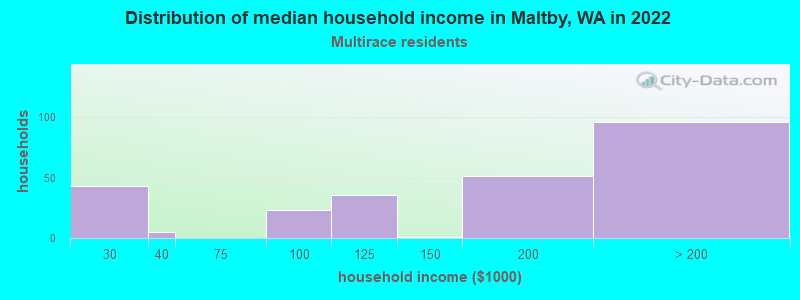
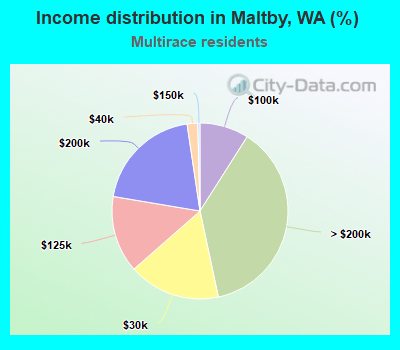
Income statistics for Multirace residents
Median household income in Maltby, WA in 2022:
Maltby:
$180,548
State:
$84,303
Change in median household income between 2000 and 2022:
Maltby, Washington:
+96.2%
State:
+125.7%
Number of households with income < $10k:
Maltby:
0.0% (0)
State:
4.3% (12,040)
Number of households with income $10k - 20k:
Maltby:
0.0% (0)
Washington:
6.6% (18,437)
Number of households with income $20k - 30k:
Maltby:
16.9% (43)
Washington:
5.2% (14,559)
Number of households with income $30k - 40k:
Maltby:
2.0% (5)
State:
6.7% (18,491)
Number of households with income $40k - 50k:
Maltby:
0.0% (0)
State:
6.3% (17,459)
Number of households with income $50k - 60k:
Maltby:
0.0% (0)
State:
6.9% (19,086)
Number of households with income $60k - 75k:
Maltby:
0.0% (0)
State:
9.1% (25,310)
Number of households with income $75k - 100k:
Maltby:
9.0% (23)
State:
13.5% (37,493)
Number of households with income $100k - 125k:
Maltby:
14.1% (36)
State:
10.7% (29,626)
Number of households with income $125k - 150k:
Maltby:
0.4% (1)
State:
8.6% (23,899)
Number of households with income $150k - 200k:
Maltby:
20.0% (51)
State:
10.2% (28,214)
Number of households with income > $200k:
Maltby:
37.6% (96)
State:
11.9% (32,947)
Aggregate household income in Maltby in 2022: $50,385,465
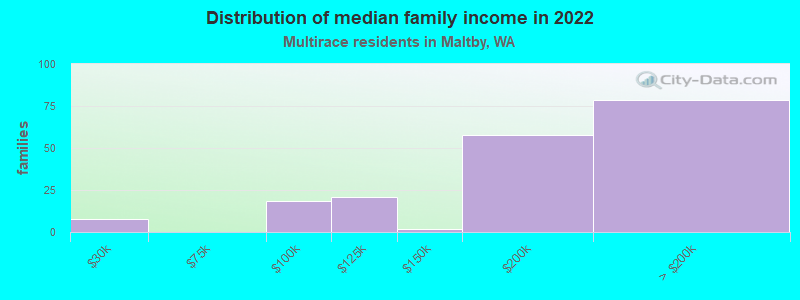
Median family income in Maltby in 2022:
Maltby:
$230,729
State:
$95,629
Number of families with income $20k - 30k:
Maltby:
4.3% (8)
State:
4.4% (7,775)
Number of families with income $75k - 100k:
Maltby:
10.0% (19)
Washington:
13.6% (23,984)
Number of families with income $100k - 125k:
Maltby:
11.2% (21)
Washington:
10.4% (18,288)
Number of families with income $125k - 150k:
Maltby:
0.8% (2)
Washington:
10.5% (18,481)
Number of families with income $150k - 200k:
Maltby:
31.2% (58)
State:
11.9% (20,852)
Number of families with income > $200k:
Maltby:
42.5% (78)
Washington:
14.4% (25,289)
Median non-family income in Maltby in 2022:
Maltby:
$31,912
State:
$56,573
Median per capita income in Maltby in 2022:
Maltby:
$33,527
State:
$32,496
Change in median per capita income between 2000 and 2022:
Maltby, Washington:
+100.9%
State:
+156.8%
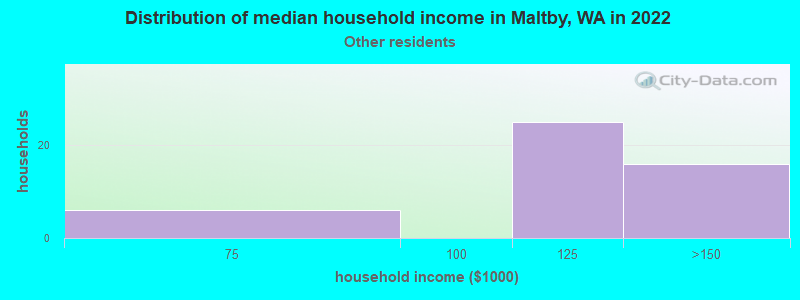
Income statistics for other residents
Median household income in Maltby, WA in 2022:
Maltby:
$114,218
State:
$69,545
Number of households with income < $10k:
Maltby:
0.0% (0)
Washington:
5.3% (6,540)
Number of households with income $10k - 20k:
Maltby:
0.0% (0)
State:
6.0% (7,385)
Number of households with income $20k - 30k:
Maltby:
0.0% (0)
State:
7.5% (9,289)
Number of households with income $30k - 40k:
Maltby:
0.0% (0)
State:
8.9% (11,015)
Number of households with income $40k - 50k:
Maltby:
0.0% (0)
State:
7.6% (9,399)
Number of households with income $50k - 60k:
Maltby:
0.0% (0)
State:
7.2% (8,867)
Number of households with income $60k - 75k:
Maltby:
12.8% (6)
Washington:
10.5% (13,032)
Number of households with income $75k - 100k:
Maltby:
0.0% (0)
Washington:
14.6% (18,007)
Number of households with income $100k - 125k:
Maltby:
53.2% (25)
State:
12.2% (15,128)
Number of households with income $125k - 150k:
Maltby:
34.0% (16)
Washington:
5.6% (6,950)
Number of households with income $150k - 200k:
Maltby:
0.0% (0)
State:
7.1% (8,749)
Number of households with income > $200k:
Maltby:
0.0% (0)
State:
7.5% (9,208)
Aggregate household income in Maltby in 2022: $5,839,212
Median per capita income in Maltby in 2022:
Maltby:
$109,929
Washington:
$27,542
Discuss Maltby, Washington (WA) on our hugely popular Washington forum.