Mannsville, Kentucky (KY) income map, earnings map, and wages data
The median household income in Mannsville, KY in 2022 was $45,339, which was 30.9% less than the median annual income of $59,341 across the entire state of Kentucky. Compared to the median income of $25,694 in 2000 this represents an increase of 43.3%. The per capita income in 2022 was $24,822, which means an increase of 47.0% compared to 2000 when it was $13,162.
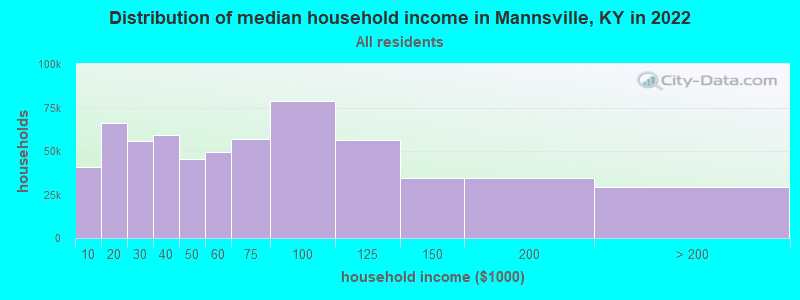
Income statistics for all residents
Median household income in Mannsville, KY in 2022:| Mannsville: | $45,339 |
| Kentucky: | $59,341 |
Change in median household income between 2000 and 2022:| Mannsville, Kentucky: | +76.5% |
| Kentucky: | +76.2% |
Number of households with income < $10k:| Mannsville: | 6.8% (46,982) |
| Kentucky: | 6.8% (123,697) |
Number of households with income $10k - 20k:| Mannsville: | 10.0% (69,787) |
| Kentucky: | 10.0% (182,645) |
Number of households with income $20k - 30k:| Mannsville: | 9.0% (62,440) |
| State: | 9.0% (164,092) |
Number of households with income $30k - 40k:| Mannsville: | 9.1% (63,212) |
| State: | 9.1% (165,607) |
Number of households with income $40k - 50k:| Mannsville: | 8.0% (55,356) |
| State: | 8.0% (146,315) |
Number of households with income $50k - 60k:| Mannsville: | 7.7% (53,653) |
| Kentucky: | 7.7% (140,671) |
Number of households with income $60k - 75k:| Mannsville: | 9.8% (68,196) |
| State: | 9.8% (180,002) |
Number of households with income $75k - 100k:| Mannsville: | 12.6% (87,653) |
| State: | 12.6% (230,239) |
Number of households with income $100k - 125k:| Mannsville: | 9.0% (62,591) |
| Kentucky: | 9.0% (164,398) |
Number of households with income $125k - 150k:| Mannsville: | 5.9% (41,163) |
| Kentucky: | 5.9% (108,602) |
Number of households with income $150k - 200k:| Mannsville: | 6.1% (42,644) |
| State: | 6.2% (112,813) |
Number of households with income > $200k:| Mannsville: | 5.9% (41,161) |
| Kentucky: | 6.0% (109,599) |
Aggregate household income in Mannsville in 2022: $1,052,008,463
Median family income in Mannsville in 2022:| Mannsville: | $56,030 |
| Kentucky: | $76,119 |
Median non-family income in Mannsville in 2022:| Mannsville: | $14,948 |
| State: | $33,993 |
Change in median non-family income between 2000 and 2022:| Mannsville, Kentucky: | +80.5% |
| State: | +79.2% |
Median per capita income in Mannsville in 2022:| Mannsville: | $24,822 |
| State: | $33,980 |
Change in median per capita income between 2000 and 2022:| Mannsville, Kentucky: | +88.6% |
| Kentucky: | +87.8% |
Income statistics for White residents
Median household income in Mannsville, KY in 2022:| Mannsville: | $45,045 |
| State: | $60,987 |
Change in median household income between 2000 and 2022:| Mannsville, Kentucky: | +76.6% |
| State: | +76.2% |
Number of households with income < $10k:| Mannsville: | 6.2% (35,974) |
| State: | 6.2% (96,690) |
Number of households with income $10k - 20k:| Mannsville: | 9.8% (56,497) |
| State: | 9.7% (151,125) |
Number of households with income $20k - 30k:| Mannsville: | 9.0% (51,854) |
| State: | 8.9% (139,532) |
Number of households with income $30k - 40k:| Mannsville: | 9.1% (52,940) |
| State: | 9.1% (142,284) |
Number of households with income $40k - 50k:| Mannsville: | 7.7% (44,611) |
| Kentucky: | 7.7% (121,151) |
Number of households with income $50k - 60k:| Mannsville: | 7.7% (44,622) |
| State: | 7.7% (119,790) |
Number of households with income $60k - 75k:| Mannsville: | 9.8% (56,813) |
| Kentucky: | 9.9% (154,174) |
Number of households with income $75k - 100k:| Mannsville: | 12.8% (74,027) |
| State: | 12.8% (199,740) |
Number of households with income $100k - 125k:| Mannsville: | 9.4% (54,123) |
| State: | 9.4% (146,284) |
Number of households with income $125k - 150k:| Mannsville: | 6.0% (34,681) |
| State: | 6.0% (94,180) |
Number of households with income $150k - 200k:| Mannsville: | 6.4% (36,920) |
| State: | 6.4% (100,702) |
Number of households with income > $200k:| Mannsville: | 6.2% (35,732) |
| State: | 6.3% (98,502) |
Aggregate household income in Mannsville in 2022: $795,108,594
Median family income in Mannsville in 2022:| Mannsville: | $56,321 |
| Kentucky: | $78,353 |
Number of families with income < $10k:| Mannsville: | 5.3% (25) |
| Kentucky: | 3.7% (37,075) |
Number of families with income $10k - 20k:| Mannsville: | 10.7% (49) |
| State: | 4.9% (49,864) |
Number of families with income $20k - 30k:| Mannsville: | 15.3% (71) |
| Kentucky: | 6.4% (64,043) |
Number of families with income $30k - 40k:| Mannsville: | 12.3% (57) |
| Kentucky: | 8.0% (81,080) |
Number of families with income $40k - 50k:| Mannsville: | 13.6% (63) |
| Kentucky: | 6.9% (69,099) |
Number of families with income $50k - 60k:| Mannsville: | 5.9% (27) |
| State: | 7.2% (72,955) |
Number of families with income $60k - 75k:| Mannsville: | 5.6% (26) |
| Kentucky: | 10.4% (104,587) |
Number of families with income $75k - 100k:| Mannsville: | 11.3% (53) |
| State: | 15.0% (151,545) |
Number of families with income $100k - 125k:| Mannsville: | 6.5% (30) |
| State: | 11.9% (120,340) |
Number of families with income $125k - 150k:| Mannsville: | 9.2% (43) |
| Kentucky: | 8.1% (81,620) |
Number of families with income > $200k:| Mannsville: | 4.3% (20) |
| Kentucky: | 8.6% (86,849) |
Median non-family income in Mannsville in 2022:| Mannsville: | $14,878 |
| State: | $34,415 |
Change in median non-family income between 2000 and 2022:| Mannsville, Kentucky: | +79.7% |
| Kentucky: | +78.3% |
Median per capita income in Mannsville in 2022:| Mannsville: | $21,982 |
| State: | $35,352 |
Change in median per capita income between 2000 and 2022:| Mannsville, Kentucky: | +90.9% |
| State: | +90.2% |
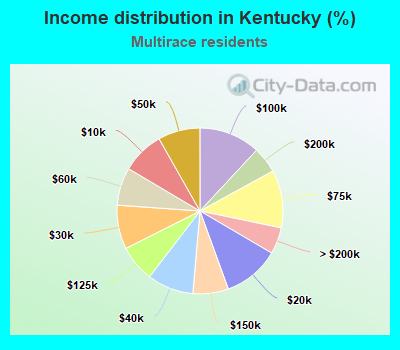
Income statistics for Multirace residents
Median household income in Mannsville, KY in 2022:| Mannsville: | $417,360 |
| State: | $56,359 |
Change in median household income between 2000 and 2022:| Mannsville, Kentucky: | +108.7% |
| State: | +107.8% |
Number of households with income < $10k:| Mannsville: | 8.2% (24,643) |
| State: | 8.3% (6,780) |
Number of households with income $10k - 20k:| Mannsville: | 11.1% (33,168) |
| State: | 11.0% (9,005) |
Number of households with income $20k - 30k:| Mannsville: | 8.5% (25,344) |
| Kentucky: | 8.6% (7,004) |
Number of households with income $30k - 40k:| Mannsville: | 9.1% (27,212) |
| State: | 9.0% (7,406) |
Number of households with income $40k - 50k:| Mannsville: | 8.2% (24,485) |
| Kentucky: | 8.2% (6,707) |
Number of households with income $50k - 60k:| Mannsville: | 7.4% (22,015) |
| Kentucky: | 7.4% (6,048) |
Number of households with income $60k - 75k:| Mannsville: | 11.2% (33,602) |
| Kentucky: | 11.2% (9,202) |
Number of households with income $75k - 100k:| Mannsville: | 11.9% (35,609) |
| Kentucky: | 11.9% (9,767) |
Number of households with income $100k - 125k:| Mannsville: | 7.2% (21,502) |
| Kentucky: | 7.1% (5,846) |
Number of households with income $125k - 150k:| Mannsville: | 6.9% (20,681) |
| Kentucky: | 6.9% (5,667) |
Number of households with income $150k - 200k:| Mannsville: | 5.1% (15,235) |
| State: | 5.1% (4,171) |
Number of households with income > $200k:| Mannsville: | 5.1% (15,388) |
| Kentucky: | 5.2% (4,241) |
Aggregate household income in Mannsville in 2022: $53,819,508
Median family income in Mannsville in 2022:| Mannsville: | $421,367 |
| State: | $67,296 |
Number of families with income > $200k:| Mannsville: | 100.0% (273) |
| State: | 7.1% (3,913) |
Median per capita income in Mannsville in 2022:| Mannsville: | $705,053 |
| State: | $25,670 |
Change in median per capita income between 2000 and 2022:| Mannsville, Kentucky: | +131.8% |
| Kentucky: | +132.3% |