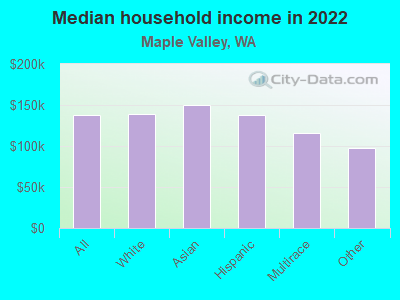
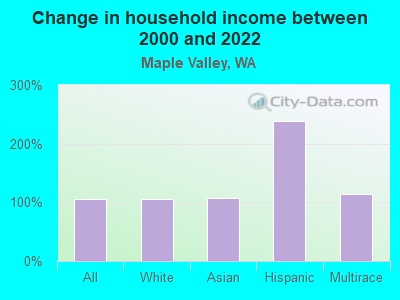
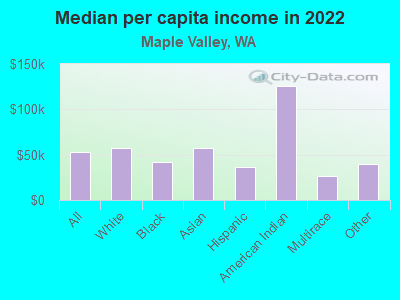
The median household income in Maple Valley, WA in 2022 was $137,494, which was 33.6% greater than the median annual income of $91,306 across the entire state of Washington. Compared to the median income of $67,159 in 2000 this represents an increase of 51.2%. The per capita income in 2022 was $52,850, which means an increase of 53.0% compared to 2000 when it was $24,859.
Whole page based on the data from 2000 / 2022 when the population of Maple Valley, Washington was 14,209 / 28,043
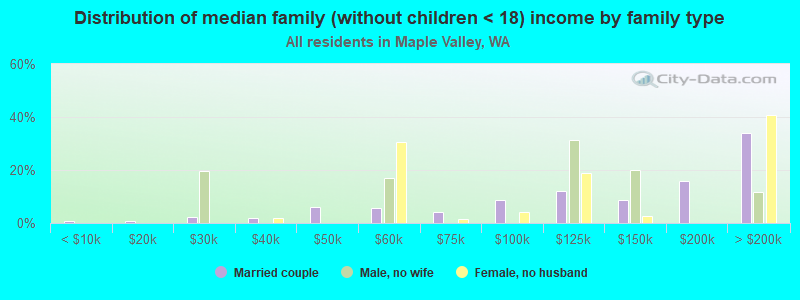
Income statistics for all residents
Median household income in Maple Valley, WA in 2022:
Maple Valley:
$137,494
Washington:
$91,306
Change in median household income between 2000 and 2022:
Maple Valley, Washington:
+104.7%
Washington:
+99.5%
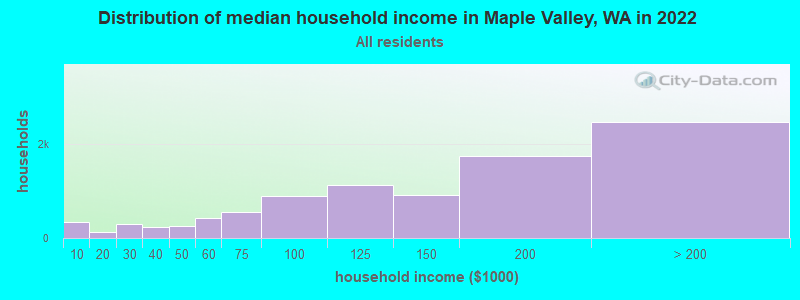
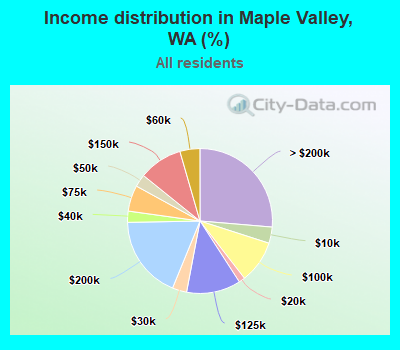
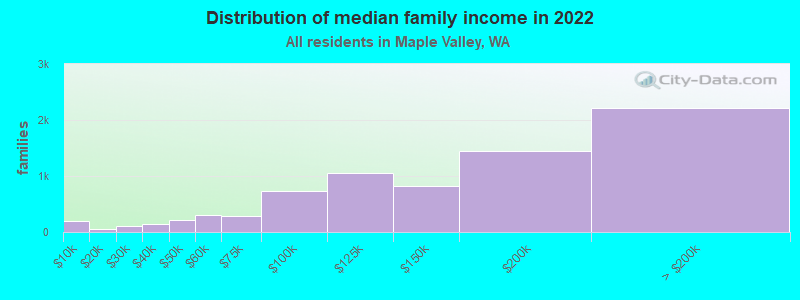
Number of households with income < $10k:
Maple Valley:
3.6% (340)
State:
4.5% (139,331)
Number of households with income $10k - 20k:
Maple Valley:
1.4% (130)
State:
5.0% (154,508)
Number of households with income $20k - 30k:
Maple Valley:
3.2% (302)
State:
5.4% (166,555)
Number of households with income $30k - 40k:
Maple Valley:
2.5% (234)
Washington:
5.5% (170,324)
Number of households with income $40k - 50k:
Maple Valley:
2.8% (263)
State:
6.0% (183,941)
Number of households with income $50k - 60k:
Maple Valley:
4.5% (419)
State:
6.1% (187,395)
Number of households with income $60k - 75k:
Maple Valley:
5.8% (546)
State:
8.7% (266,771)
Number of households with income $75k - 100k:
Maple Valley:
9.5% (898)
State:
13.1% (404,672)
Number of households with income $100k - 125k:
Maple Valley:
12.1% (1,137)
State:
11.0% (337,911)
Number of households with income $125k - 150k:
Maple Valley:
9.7% (917)
State:
8.0% (244,934)
Number of households with income $150k - 200k:
Maple Valley:
18.5% (1,742)
State:
10.5% (323,812)
Number of households with income > $200k:
Maple Valley:
26.3% (2,478)
State:
16.2% (499,799)
Aggregate household income in Maple Valley in 2022: $1,476,275,681
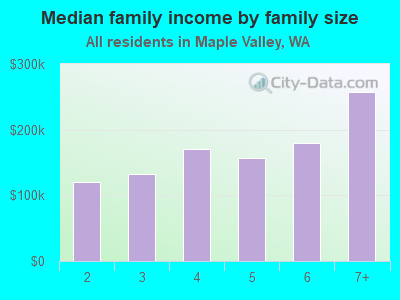
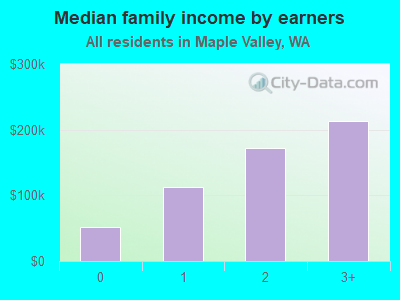
Median family income in Maple Valley in 2022:
Maple Valley:
$148,298
State:
$109,192
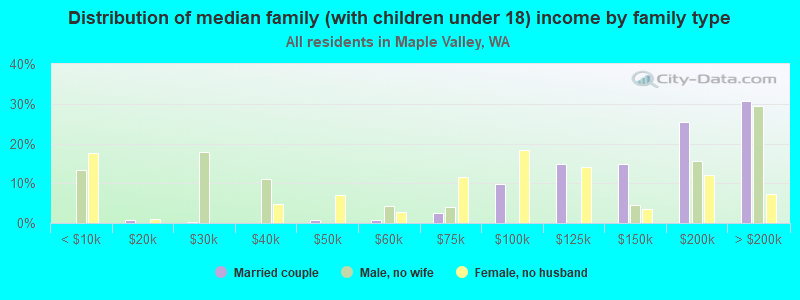
Number of families with income < $10k:
Maple Valley:
2.6% (195)
State:
2.9% (55,953)
Number of families with income $10k - 20k:
Maple Valley:
0.7% (52)
State:
2.6% (50,138)
Number of families with income $20k - 30k:
Maple Valley:
1.4% (102)
Washington:
3.2% (61,974)
Number of families with income $30k - 40k:
Maple Valley:
1.9% (140)
State:
4.1% (80,240)
Number of families with income $40k - 50k:
Maple Valley:
2.9% (216)
State:
4.9% (94,310)
Number of families with income $50k - 60k:
Maple Valley:
4.1% (309)
State:
5.3% (101,674)
Number of families with income $60k - 75k:
Maple Valley:
3.7% (281)
State:
8.2% (158,348)
Number of families with income $75k - 100k:
Maple Valley:
9.6% (725)
Washington:
13.8% (267,812)
Number of families with income $100k - 125k:
Maple Valley:
14.0% (1,058)
State:
12.4% (240,213)
Number of families with income $125k - 150k:
Maple Valley:
10.8% (821)
State:
9.3% (180,011)
Number of families with income $150k - 200k:
Maple Valley:
19.1% (1,446)
State:
13.0% (250,874)
Number of families with income > $200k:
Maple Valley:
29.4% (2,223)
State:
20.4% (393,898)
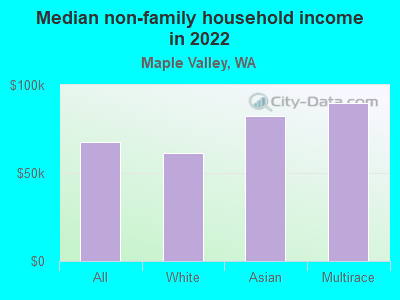
Median non-family income in Maple Valley in 2022:
Maple Valley:
$67,529
State:
$57,299
Change in median non-family income between 2000 and 2022:
Maple Valley, Washington:
+49.3%
Washington:
+94.9%
Median per capita income in Maple Valley in 2022:
Maple Valley:
$52,850
Washington:
$50,764
Change in median per capita income between 2000 and 2022:
Maple Valley, Washington:
+112.6%
State:
+121.0%
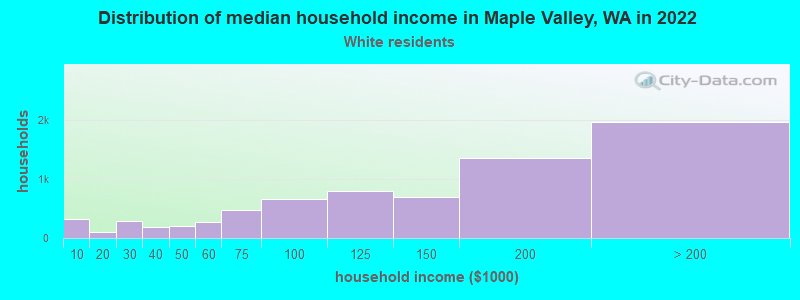
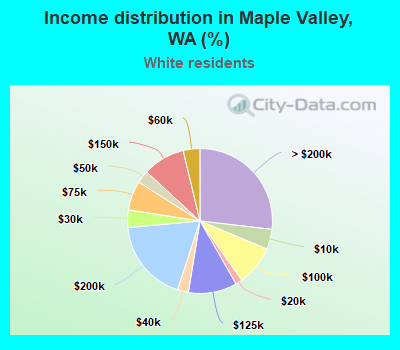
Income statistics for White residents
Median household income in Maple Valley, WA in 2022:
Maple Valley:
$138,489
State:
$91,916
Change in median household income between 2000 and 2022:
Maple Valley, Washington:
+105.5%
State:
+95.4%
Number of households with income < $10k:
Maple Valley:
4.5% (326)
Washington:
4.3% (95,850)
Number of households with income $10k - 20k:
Maple Valley:
1.5% (107)
Washington:
4.8% (106,421)
Number of households with income $20k - 30k:
Maple Valley:
3.9% (286)
State:
5.5% (122,860)
Number of households with income $30k - 40k:
Maple Valley:
2.5% (180)
State:
5.4% (119,627)
Number of households with income $40k - 50k:
Maple Valley:
2.8% (207)
State:
5.9% (132,276)
Number of households with income $50k - 60k:
Maple Valley:
3.7% (272)
Washington:
6.1% (136,212)
Number of households with income $60k - 75k:
Maple Valley:
6.5% (477)
State:
8.8% (196,086)
Number of households with income $75k - 100k:
Maple Valley:
8.9% (652)
Washington:
13.4% (299,192)
Number of households with income $100k - 125k:
Maple Valley:
10.8% (791)
State:
11.3% (252,209)
Number of households with income $125k - 150k:
Maple Valley:
9.4% (686)
State:
7.9% (175,962)
Number of households with income $150k - 200k:
Maple Valley:
18.5% (1,349)
State:
10.7% (239,156)
Number of households with income > $200k:
Maple Valley:
26.9% (1,958)
State:
16.1% (359,917)
Aggregate household income in Maple Valley in 2022: $1,164,394,056
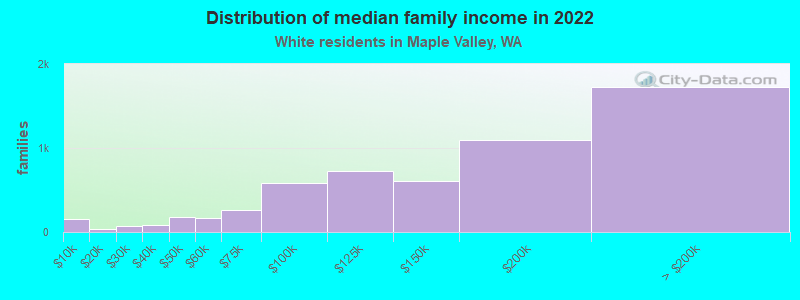
Median family income in Maple Valley in 2022:
Maple Valley:
$150,644
State:
$112,511
Number of families with income < $10k:
Maple Valley:
2.8% (157)
Washington:
2.4% (33,676)
Number of families with income $10k - 20k:
Maple Valley:
0.6% (33)
State:
2.0% (28,228)
Number of families with income $20k - 30k:
Maple Valley:
1.2% (69)
State:
2.9% (39,288)
Number of families with income $30k - 40k:
Maple Valley:
1.5% (87)
State:
3.6% (50,190)
Number of families with income $40k - 50k:
Maple Valley:
3.2% (182)
Washington:
4.6% (63,009)
Number of families with income $50k - 60k:
Maple Valley:
3.0% (168)
Washington:
5.0% (69,270)
Number of families with income $60k - 75k:
Maple Valley:
4.5% (257)
Washington:
8.2% (112,369)
Number of families with income $75k - 100k:
Maple Valley:
10.3% (586)
State:
14.1% (194,214)
Number of families with income $100k - 125k:
Maple Valley:
12.8% (727)
Washington:
13.2% (182,184)
Number of families with income $125k - 150k:
Maple Valley:
10.6% (605)
State:
9.5% (130,928)
Number of families with income $150k - 200k:
Maple Valley:
19.2% (1,092)
State:
13.7% (188,621)
Number of families with income > $200k:
Maple Valley:
30.3% (1,722)
State:
20.8% (285,982)
Median non-family income in Maple Valley in 2022:
Maple Valley:
$61,400
State:
$56,103
Change in median non-family income between 2000 and 2022:
Maple Valley, Washington:
+35.8%
Washington:
+87.7%
Median per capita income in Maple Valley in 2022:
Maple Valley:
$56,949
Washington:
$55,212
Change in median per capita income between 2000 and 2022:
Maple Valley, Washington:
+125.0%
State:
+123.8%
Income statistics for Black or African American residents
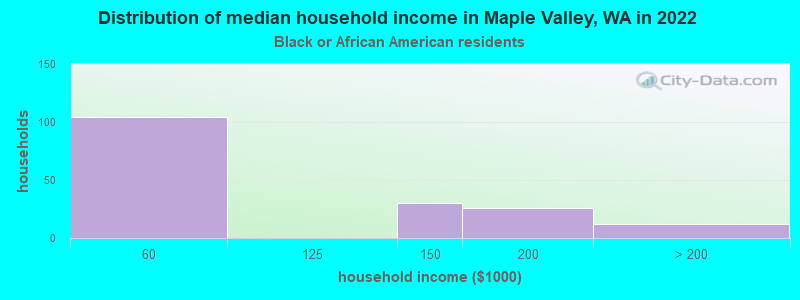
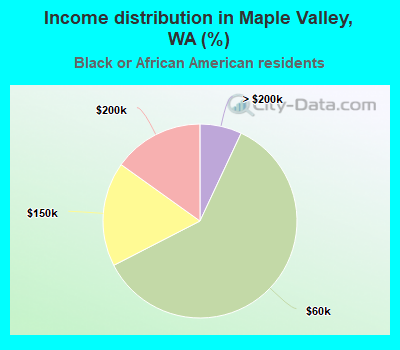
Number of households with income < $10k:
Maple Valley:
0.0% (0)
State:
7.2% (8,014)
Number of households with income $10k - 20k:
Maple Valley:
0.0% (0)
State:
8.0% (8,904)
Number of households with income $20k - 30k:
Maple Valley:
0.0% (0)
Washington:
7.4% (8,207)
Number of households with income $30k - 40k:
Maple Valley:
0.0% (0)
State:
5.6% (6,220)
Number of households with income $40k - 50k:
Maple Valley:
0.0% (0)
State:
9.5% (10,585)
Number of households with income $50k - 60k:
Maple Valley:
60.5% (104)
State:
7.3% (8,078)
Number of households with income $60k - 75k:
Maple Valley:
0.0% (0)
Washington:
8.7% (9,704)
Number of households with income $75k - 100k:
Maple Valley:
0.0% (0)
Washington:
12.9% (14,315)
Number of households with income $100k - 125k:
Maple Valley:
0.0% (0)
State:
7.7% (8,592)
Number of households with income $125k - 150k:
Maple Valley:
17.4% (30)
State:
8.9% (9,840)
Number of households with income $150k - 200k:
Maple Valley:
15.1% (26)
State:
7.6% (8,434)
Number of households with income > $200k:
Maple Valley:
7.0% (12)
State:
9.1% (10,075)
Aggregate household income in Maple Valley in 2022: $16,558,423
Median per capita income in Maple Valley in 2022:
Maple Valley:
$41,735
Washington:
$38,209
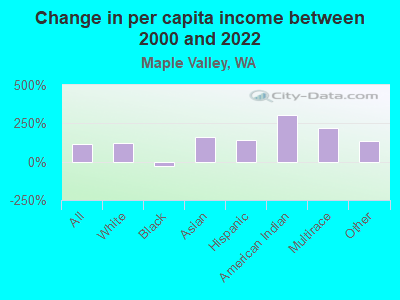
Change in median per capita income between 2000 and 2022:: -26.9%
Maple Valley, Washington:
-26.9%
Washington:
+115.3%
Income statistics for Asian residents
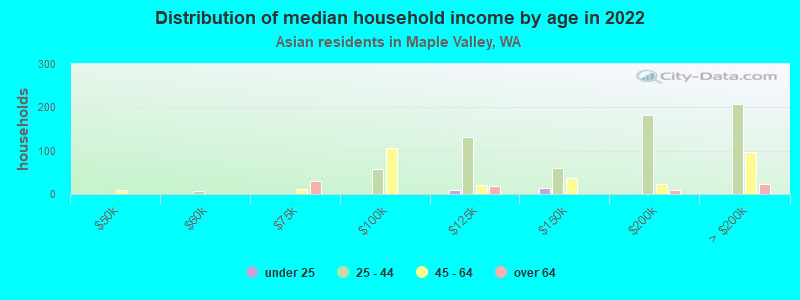
Median household income in Maple Valley, WA in 2022:
Maple Valley:
$150,053
State:
$125,692
Change in median household income between 2000 and 2022:
Maple Valley, Washington:
+107.5%
Washington:
+164.5%
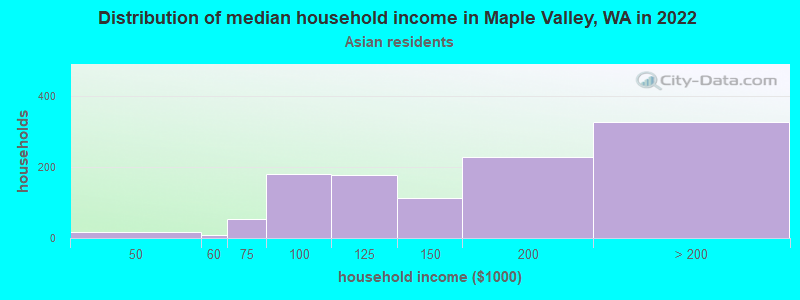
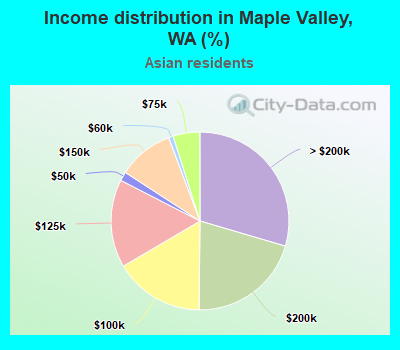
Number of households with income < $10k:
Maple Valley:
0.0% (0)
State:
4.9% (14,099)
Number of households with income $10k - 20k:
Maple Valley:
0.0% (0)
Washington:
3.5% (9,873)
Number of households with income $20k - 30k:
Maple Valley:
0.0% (0)
State:
2.9% (8,352)
Number of households with income $30k - 40k:
Maple Valley:
0.0% (0)
Washington:
4.0% (11,415)
Number of households with income $40k - 50k:
Maple Valley:
1.6% (18)
Washington:
4.0% (11,421)
Number of households with income $50k - 60k:
Maple Valley:
0.8% (9)
Washington:
4.2% (12,100)
Number of households with income $60k - 75k:
Maple Valley:
4.9% (54)
State:
6.3% (17,903)
Number of households with income $75k - 100k:
Maple Valley:
16.4% (181)
State:
10.4% (29,663)
Number of households with income $100k - 125k:
Maple Valley:
16.0% (177)
State:
9.4% (26,839)
Number of households with income $125k - 150k:
Maple Valley:
10.1% (112)
Washington:
8.5% (24,200)
Number of households with income $150k - 200k:
Maple Valley:
20.6% (228)
State:
12.6% (35,976)
Number of households with income > $200k:
Maple Valley:
29.6% (327)
State:
29.2% (83,109)
Aggregate household income in Maple Valley in 2022: $178,832,282
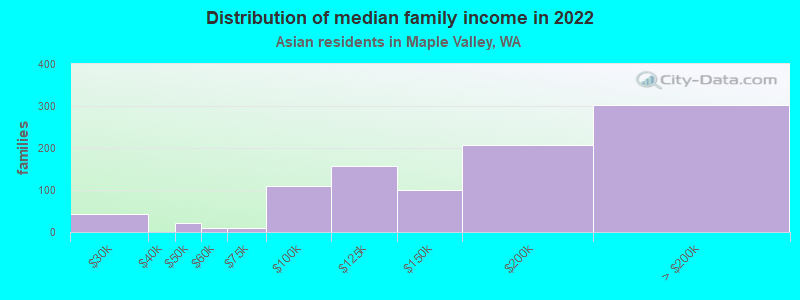
Median family income in Maple Valley in 2022:
Maple Valley:
$158,782
Washington:
$143,595
Number of families with income $20k - 30k:
Maple Valley:
4.3% (42)
Washington:
1.9% (3,558)
Number of families with income $40k - 50k:
Maple Valley:
2.2% (21)
State:
3.6% (6,707)
Number of families with income $50k - 60k:
Maple Valley:
1.1% (10)
Washington:
4.1% (7,663)
Number of families with income $60k - 75k:
Maple Valley:
0.9% (9)
State:
5.1% (9,490)
Number of families with income $75k - 100k:
Maple Valley:
11.4% (109)
State:
11.7% (21,919)
Number of families with income $100k - 125k:
Maple Valley:
16.4% (157)
Washington:
9.3% (17,280)
Number of families with income $125k - 150k:
Maple Valley:
10.5% (101)
State:
8.4% (15,602)
Number of families with income $150k - 200k:
Maple Valley:
21.7% (208)
State:
13.3% (24,789)
Number of families with income > $200k:
Maple Valley:
31.5% (303)
State:
34.4% (64,250)
Median non-family income in Maple Valley in 2022:
Maple Valley:
$82,160
Washington:
$84,971
Change in median non-family income between 2000 and 2022:
Maple Valley, Washington:
+126.6%
Washington:
+211.1%
Median per capita income in Maple Valley in 2022:
Maple Valley:
$56,821
Washington:
$67,666
Income statistics for Hispanic or Latino residents
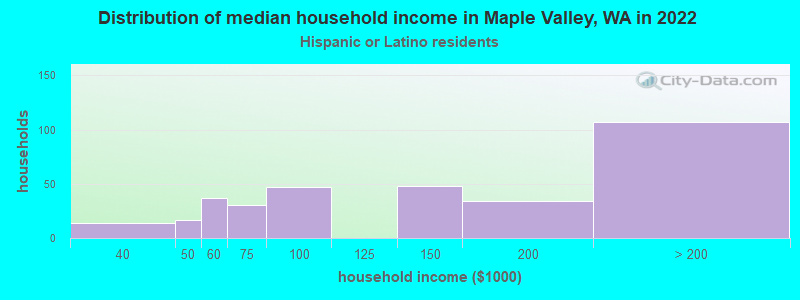
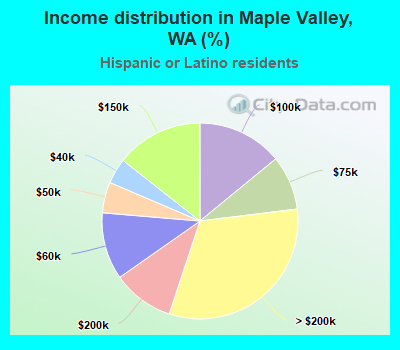
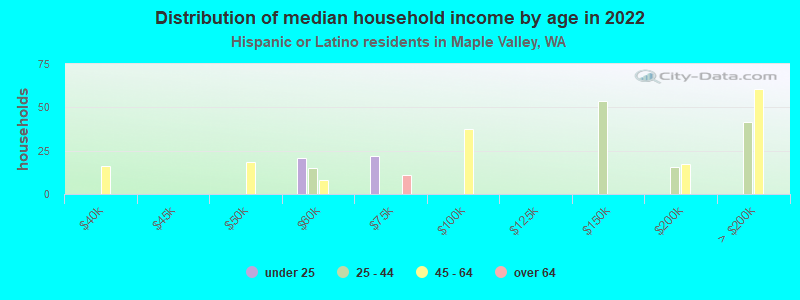
Median household income in Maple Valley, WA in 2022:
Maple Valley:
$137,631
Washington:
$74,770
Number of households with income < $10k:
Maple Valley:
0.0% (0)
State:
4.9% (14,456)
Number of households with income $10k - 20k:
Maple Valley:
0.0% (0)
State:
5.3% (15,449)
Number of households with income $20k - 30k:
Maple Valley:
0.0% (0)
Washington:
6.8% (20,016)
Number of households with income $30k - 40k:
Maple Valley:
4.2% (14)
Washington:
7.7% (22,548)
Number of households with income $40k - 50k:
Maple Valley:
5.1% (17)
State:
7.3% (21,450)
Number of households with income $50k - 60k:
Maple Valley:
11.1% (37)
State:
7.7% (22,744)
Number of households with income $60k - 75k:
Maple Valley:
9.0% (30)
State:
10.5% (30,737)
Number of households with income $75k - 100k:
Maple Valley:
14.1% (47)
State:
14.9% (43,843)
Number of households with income $100k - 125k:
Maple Valley:
0.0% (0)
State:
11.1% (32,554)
Number of households with income $125k - 150k:
Maple Valley:
14.4% (48)
Washington:
7.4% (21,624)
Number of households with income $150k - 200k:
Maple Valley:
10.2% (34)
Washington:
7.3% (21,360)
Number of households with income > $200k:
Maple Valley:
32.0% (107)
Washington:
9.2% (27,055)
Aggregate household income in Maple Valley in 2022: $54,196,663
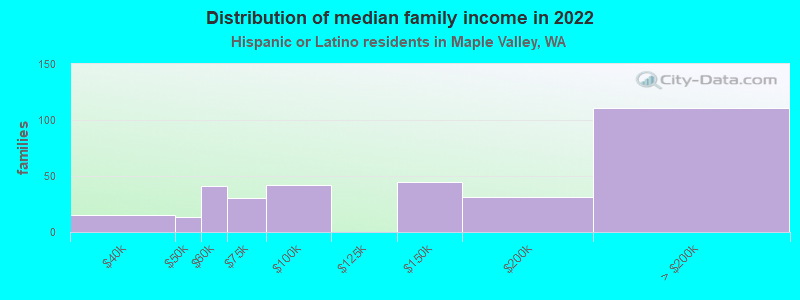
Median family income in Maple Valley in 2022:
Maple Valley:
$149,158
State:
$76,866
Number of families with income $30k - 40k:
Maple Valley:
4.6% (15)
State:
8.3% (17,803)
Number of families with income $40k - 50k:
Maple Valley:
4.1% (13)
State:
7.7% (16,361)
Number of families with income $50k - 60k:
Maple Valley:
12.4% (41)
State:
7.9% (16,852)
Number of families with income $60k - 75k:
Maple Valley:
9.1% (30)
State:
11.4% (24,342)
Number of families with income $75k - 100k:
Maple Valley:
12.8% (42)
State:
14.4% (30,698)
Number of families with income $125k - 150k:
Maple Valley:
13.6% (45)
Washington:
7.5% (16,099)
Number of families with income $150k - 200k:
Maple Valley:
9.6% (31)
State:
8.2% (17,551)
Number of families with income > $200k:
Maple Valley:
33.8% (111)
Washington:
9.7% (20,653)
Median per capita income in Maple Valley in 2022:
Maple Valley:
$36,930
State:
$28,252
Change in median per capita income between 2000 and 2022:
Maple Valley, Washington:
+138.7%
State:
+150.2%
Income statistics for American Indian and Alaska Native residents
Aggregate household income in Maple Valley in 2022: $9,492,265
Median per capita income in Maple Valley in 2022:
Maple Valley:
$125,749
Washington:
$27,053
Income statistics for Multirace residents
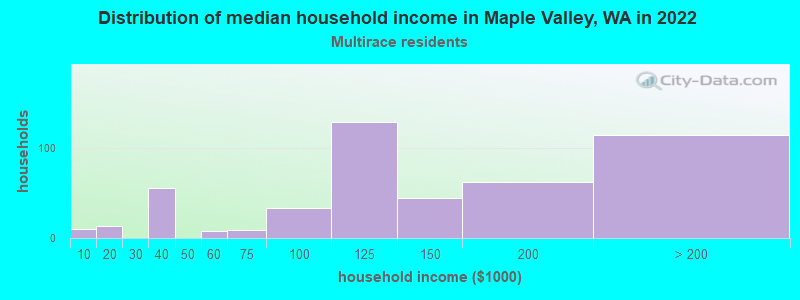
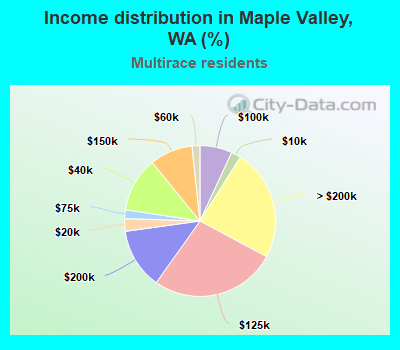
Median household income in Maple Valley, WA in 2022:
Maple Valley:
$115,491
Washington:
$84,303
Change in median household income between 2000 and 2022:
Maple Valley, Washington:
+114.1%
State:
+125.7%
Number of households with income < $10k:
Maple Valley:
2.1% (10)
State:
4.3% (12,040)
Number of households with income $10k - 20k:
Maple Valley:
2.7% (13)
Washington:
6.6% (18,437)
Number of households with income $20k - 30k:
Maple Valley:
0.0% (0)
State:
5.2% (14,559)
Number of households with income $30k - 40k:
Maple Valley:
11.7% (56)
Washington:
6.7% (18,491)
Number of households with income $40k - 50k:
Maple Valley:
0.0% (0)
State:
6.3% (17,459)
Number of households with income $50k - 60k:
Maple Valley:
1.7% (8)
State:
6.9% (19,086)
Number of households with income $60k - 75k:
Maple Valley:
1.9% (9)
State:
9.1% (25,310)
Number of households with income $75k - 100k:
Maple Valley:
6.9% (33)
State:
13.5% (37,493)
Number of households with income $100k - 125k:
Maple Valley:
27.0% (129)
Washington:
10.7% (29,626)
Number of households with income $125k - 150k:
Maple Valley:
9.2% (44)
Washington:
8.6% (23,899)
Number of households with income $150k - 200k:
Maple Valley:
13.0% (62)
State:
10.2% (28,214)
Number of households with income > $200k:
Maple Valley:
23.8% (114)
Washington:
11.9% (32,947)
Aggregate household income in Maple Valley in 2022: $70,107,891
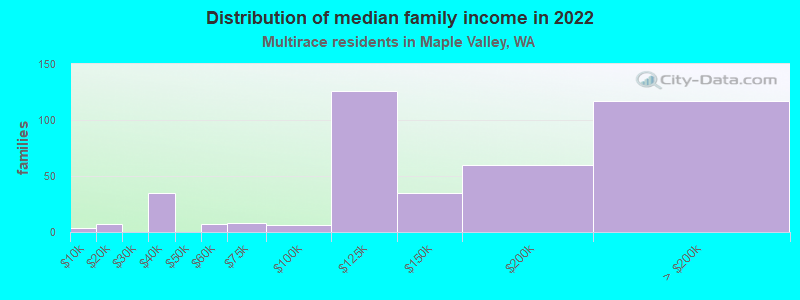
Median family income in Maple Valley in 2022:
Maple Valley:
$138,265
State:
$95,629
Number of families with income < $10k:
Maple Valley:
1.0% (4)
State:
3.5% (6,121)
Number of families with income $10k - 20k:
Maple Valley:
1.8% (7)
State:
4.3% (7,519)
Number of families with income $30k - 40k:
Maple Valley:
8.7% (35)
Washington:
5.8% (10,186)
Number of families with income $50k - 60k:
Maple Valley:
1.7% (7)
State:
5.6% (9,922)
Number of families with income $60k - 75k:
Maple Valley:
1.9% (8)
Washington:
9.7% (17,113)
Number of families with income $75k - 100k:
Maple Valley:
1.4% (6)
State:
13.6% (23,984)
Number of families with income $100k - 125k:
Maple Valley:
31.2% (126)
Washington:
10.4% (18,288)
Number of families with income $125k - 150k:
Maple Valley:
8.6% (35)
Washington:
10.5% (18,481)
Number of families with income $150k - 200k:
Maple Valley:
14.8% (60)
State:
11.9% (20,852)
Number of families with income > $200k:
Maple Valley:
28.9% (117)
State:
14.4% (25,289)
Median non-family income in Maple Valley in 2022:
Maple Valley:
$89,994
State:
$56,573
Median per capita income in Maple Valley in 2022:
Maple Valley:
$26,358
State:
$32,496
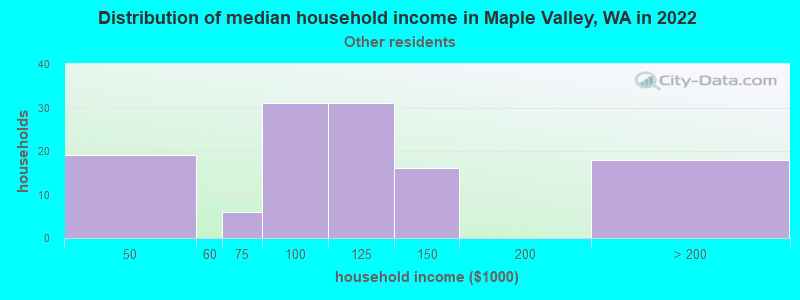
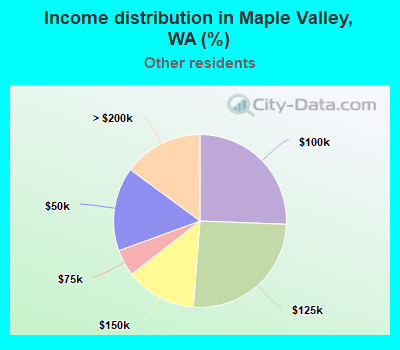
Income statistics for other residents
Median household income in Maple Valley, WA in 2022:
Maple Valley:
$97,262
State:
$69,545
Number of households with income < $10k:
Maple Valley:
0.0% (0)
Washington:
5.3% (6,540)
Number of households with income $10k - 20k:
Maple Valley:
0.0% (0)
State:
6.0% (7,385)
Number of households with income $20k - 30k:
Maple Valley:
0.0% (0)
Washington:
7.5% (9,289)
Number of households with income $30k - 40k:
Maple Valley:
0.0% (0)
Washington:
8.9% (11,015)
Number of households with income $40k - 50k:
Maple Valley:
15.7% (19)
State:
7.6% (9,399)
Number of households with income $50k - 60k:
Maple Valley:
0.0% (0)
State:
7.2% (8,867)
Number of households with income $60k - 75k:
Maple Valley:
5.0% (6)
Washington:
10.5% (13,032)
Number of households with income $75k - 100k:
Maple Valley:
25.6% (31)
State:
14.6% (18,007)
Number of households with income $100k - 125k:
Maple Valley:
25.6% (31)
Washington:
12.2% (15,128)
Number of households with income $125k - 150k:
Maple Valley:
13.2% (16)
State:
5.6% (6,950)
Number of households with income $150k - 200k:
Maple Valley:
0.0% (0)
Washington:
7.1% (8,749)
Number of households with income > $200k:
Maple Valley:
14.9% (18)
State:
7.5% (9,208)
Aggregate household income in Maple Valley in 2022: $16,170,581
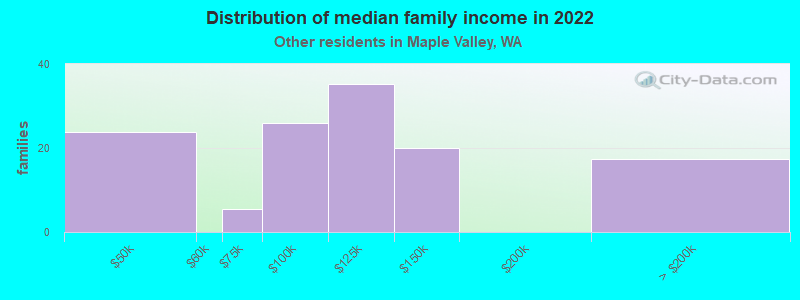
Median family income in Maple Valley in 2022:
Maple Valley:
$96,025
Washington:
$72,588
Number of families with income $40k - 50k:
Maple Valley:
18.6% (24)
Washington:
8.0% (7,634)
Number of families with income $60k - 75k:
Maple Valley:
4.3% (6)
State:
10.3% (9,864)
Number of families with income $75k - 100k:
Maple Valley:
20.3% (26)
State:
14.5% (13,800)
Number of families with income $100k - 125k:
Maple Valley:
27.6% (35)
State:
12.9% (12,298)
Number of families with income $125k - 150k:
Maple Valley:
15.7% (20)
State:
6.0% (5,679)
Number of families with income > $200k:
Maple Valley:
13.5% (17)
Washington:
7.1% (6,764)
Median per capita income in Maple Valley in 2022:
Maple Valley:
$39,339
State:
$27,542
Change in median per capita income between 2000 and 2022:
Maple Valley, Washington:
+134.9%
State:
+167.8%
Discuss Maple Valley, Washington (WA) on our hugely popular Washington forum.