Maryland, New York (NY) income map, earnings map, and wages data
The median household income in Maryland, NY in 2022 was $61,570, which was 29.2% less than the median annual income of $79,557 across the entire state of New York. Compared to the median income of $33,821 in 2000 this represents an increase of 45.1%. The per capita income in 2022 was $32,848, which means an increase of 50.9% compared to 2000 when it was $16,120.
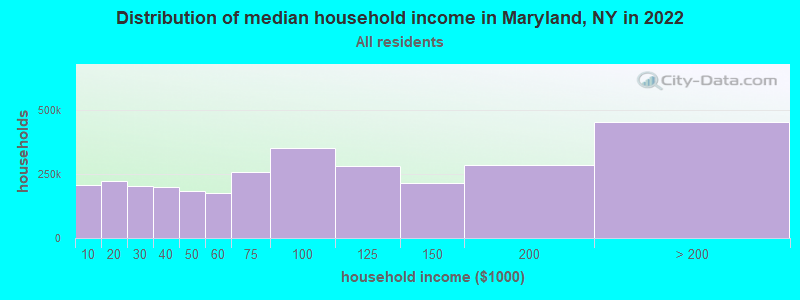
Income statistics for all residents
Median household income in Maryland, NY in 2022:| Maryland: | $61,570 |
| State: | $79,557 |
Change in median household income between 2000 and 2022:| Maryland, New York: | +82.0% |
| New York: | +83.3% |
Number of households with income < $10k:| Maryland: | 6.8% (205,712) |
| State: | 6.8% (527,598) |
Number of households with income $10k - 20k:| Maryland: | 7.4% (224,132) |
| State: | 7.4% (574,940) |
Number of households with income $20k - 30k:| Maryland: | 6.7% (201,808) |
| State: | 6.7% (517,718) |
Number of households with income $30k - 40k:| Maryland: | 6.5% (197,488) |
| New York: | 6.5% (506,674) |
Number of households with income $40k - 50k:| Maryland: | 6.1% (183,352) |
| State: | 6.1% (470,439) |
Number of households with income $50k - 60k:| Maryland: | 5.8% (176,959) |
| New York: | 5.8% (454,042) |
Number of households with income $60k - 75k:| Maryland: | 8.5% (256,253) |
| New York: | 8.5% (657,508) |
Number of households with income $75k - 100k:| Maryland: | 11.6% (350,689) |
| State: | 11.6% (899,824) |
Number of households with income $100k - 125k:| Maryland: | 9.3% (282,102) |
| State: | 9.3% (723,825) |
Number of households with income $125k - 150k:| Maryland: | 7.1% (215,309) |
| State: | 7.1% (552,420) |
Number of households with income $150k - 200k:| Maryland: | 9.4% (283,406) |
| State: | 9.4% (727,051) |
Number of households with income > $200k:| Maryland: | 15.0% (453,146) |
| New York: | 15.0% (1,162,269) |
Aggregate household income in Maryland in 2022: $6,705,282,584
Median family income in Maryland in 2022:| Maryland: | $74,490 |
| State: | $99,066 |
Median non-family income in Maryland in 2022:| Maryland: | $36,610 |
| State: | $50,181 |
Change in median non-family income between 2000 and 2022:| Maryland, New York: | +81.3% |
| New York: | +85.4% |
Median per capita income in Maryland in 2022:| Maryland: | $32,849 |
| State: | $47,421 |
Change in median per capita income between 2000 and 2022:| Maryland, New York: | +103.8% |
| State: | +102.7% |
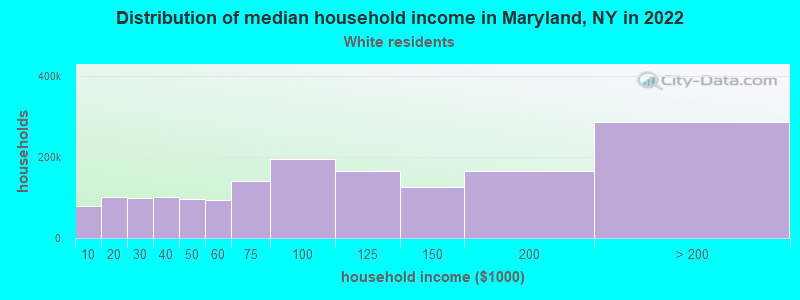
Income statistics for White residents
Median household income in Maryland, NY in 2022:| Maryland: | $61,873 |
| State: | $89,408 |
Change in median household income between 2000 and 2022:| Maryland, New York: | +83.3% |
| State: | +85.5% |
Number of households with income < $10k:| Maryland: | 4.8% (78,624) |
| New York: | 4.8% (225,550) |
Number of households with income $10k - 20k:| Maryland: | 6.1% (101,303) |
| State: | 6.1% (289,425) |
Number of households with income $20k - 30k:| Maryland: | 6.0% (98,259) |
| State: | 5.9% (280,254) |
Number of households with income $30k - 40k:| Maryland: | 6.1% (101,180) |
| State: | 6.1% (288,263) |
Number of households with income $40k - 50k:| Maryland: | 5.9% (97,706) |
| New York: | 5.9% (278,079) |
Number of households with income $50k - 60k:| Maryland: | 5.7% (94,061) |
| State: | 5.7% (267,554) |
Number of households with income $60k - 75k:| Maryland: | 8.5% (140,075) |
| State: | 8.4% (398,344) |
Number of households with income $75k - 100k:| Maryland: | 11.8% (195,067) |
| State: | 11.8% (554,841) |
Number of households with income $100k - 125k:| Maryland: | 10.0% (164,697) |
| State: | 10.0% (469,794) |
Number of households with income $125k - 150k:| Maryland: | 7.7% (126,303) |
| State: | 7.6% (360,467) |
Number of households with income $150k - 200k:| Maryland: | 10.1% (166,371) |
| New York: | 10.1% (477,078) |
Number of households with income > $200k:| Maryland: | 17.4% (286,980) |
| State: | 17.6% (829,233) |
Aggregate household income in Maryland in 2022: $4,457,962,586
Median family income in Maryland in 2022:| Maryland: | $75,996 |
| State: | $115,170 |
Number of families with income < $10k:| Maryland: | 5.5% (17) |
| State: | 2.5% (68,851) |
Number of families with income $10k - 20k:| Maryland: | 7.8% (24) |
| State: | 3.0% (83,127) |
Number of families with income $20k - 30k:| Maryland: | 9.0% (27) |
| State: | 3.5% (97,578) |
Number of families with income $30k - 40k:| Maryland: | 12.3% (37) |
| State: | 4.1% (114,108) |
Number of families with income $40k - 50k:| Maryland: | 9.2% (28) |
| New York: | 4.7% (130,902) |
Number of families with income $50k - 60k:| Maryland: | 5.5% (17) |
| New York: | 4.9% (135,118) |
Number of families with income $60k - 75k:| Maryland: | 14.0% (42) |
| State: | 7.8% (216,254) |
Number of families with income $75k - 100k:| Maryland: | 18.0% (55) |
| State: | 12.4% (342,382) |
Number of families with income $100k - 125k:| Maryland: | 6.8% (21) |
| New York: | 11.4% (314,917) |
Number of families with income $125k - 150k:| Maryland: | 3.6% (11) |
| State: | 9.4% (260,489) |
Number of families with income $150k - 200k:| Maryland: | 5.1% (16) |
| State: | 13.2% (365,586) |
Number of families with income > $200k:| Maryland: | 3.3% (10) |
| State: | 23.2% (642,319) |
Median non-family income in Maryland in 2022:| Maryland: | $37,135 |
| New York: | $54,783 |
Change in median non-family income between 2000 and 2022:| Maryland, New York: | +83.9% |
| State: | +87.9% |
Median per capita income in Maryland in 2022:| Maryland: | $34,035 |
| State: | $57,640 |
Change in median per capita income between 2000 and 2022:| Maryland, New York: | +111.0% |
| State: | +111.6% |
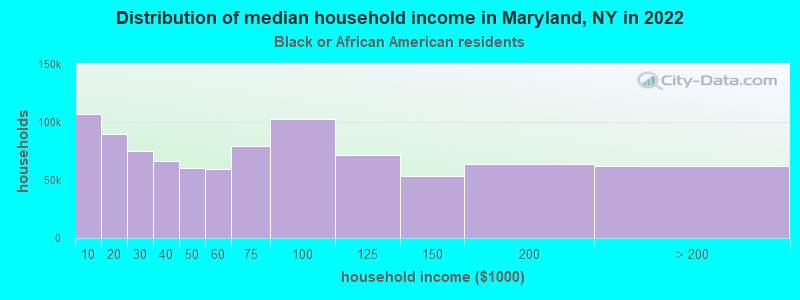
Income statistics for Black or African American residents
Median household income in Maryland, NY in 2022:| Maryland: | $104,265 |
| State: | $57,898 |
Change in median household income between 2000 and 2022:| Maryland, New York: | +100.2% |
| State: | +84.6% |
Number of households with income < $10k:| Maryland: | 12.0% (106,778) |
| State: | 12.0% (128,500) |
Number of households with income $10k - 20k:| Maryland: | 10.0% (89,273) |
| State: | 10.0% (107,541) |
Number of households with income $20k - 30k:| Maryland: | 8.4% (74,923) |
| State: | 8.4% (90,192) |
Number of households with income $30k - 40k:| Maryland: | 7.4% (66,034) |
| New York: | 7.4% (79,579) |
Number of households with income $40k - 50k:| Maryland: | 6.8% (60,211) |
| New York: | 6.8% (72,491) |
Number of households with income $50k - 60k:| Maryland: | 6.6% (59,053) |
| State: | 6.7% (71,309) |
Number of households with income $60k - 75k:| Maryland: | 8.9% (78,948) |
| State: | 8.9% (95,050) |
Number of households with income $75k - 100k:| Maryland: | 11.5% (102,434) |
| State: | 11.5% (123,569) |
Number of households with income $100k - 125k:| Maryland: | 8.1% (71,710) |
| State: | 8.1% (86,632) |
Number of households with income $125k - 150k:| Maryland: | 6.1% (53,800) |
| New York: | 6.0% (64,788) |
Number of households with income $150k - 200k:| Maryland: | 7.1% (63,483) |
| New York: | 7.2% (76,644) |
Number of households with income > $200k:| Maryland: | 7.0% (61,994) |
| State: | 7.0% (75,062) |
Aggregate household income in Maryland in 2022: $5,840,593
Median family income in Maryland in 2022:| Maryland: | $101,552 |
| State: | $72,528 |
Median non-family income in Maryland in 2022:| Maryland: | $120,222 |
| State: | $37,265 |
Change in median non-family income between 2000 and 2022:| Maryland, New York: | +104.6% |
| New York: | +81.7% |
Median per capita income in Maryland in 2022:| Maryland: | $80,947 |
| New York: | $31,947 |
Change in median per capita income between 2000 and 2022:| Maryland, New York: | +99.4% |
| State: | +106.1% |
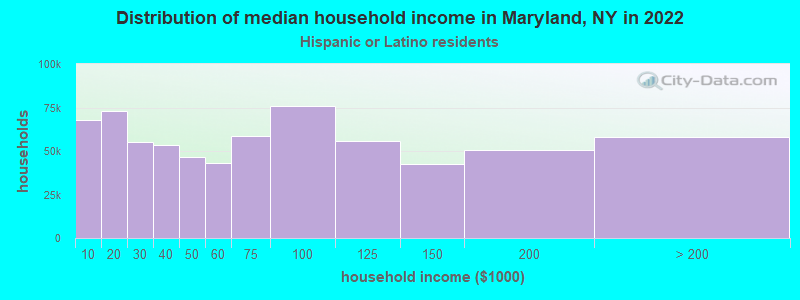
Income statistics for Hispanic or Latino residents
Median household income in Maryland, NY in 2022:| Maryland: | $63,881 |
| State: | $60,468 |
Change in median household income between 2000 and 2022:| Maryland, New York: | +96.6% |
| New York: | +98.3% |
Number of households with income < $10k:| Maryland: | 10.0% (67,721) |
| State: | 9.9% (127,185) |
Number of households with income $10k - 20k:| Maryland: | 10.7% (72,898) |
| New York: | 10.7% (136,699) |
Number of households with income $20k - 30k:| Maryland: | 8.1% (54,892) |
| State: | 8.1% (102,991) |
Number of households with income $30k - 40k:| Maryland: | 7.8% (53,170) |
| New York: | 7.8% (100,149) |
Number of households with income $40k - 50k:| Maryland: | 6.8% (46,520) |
| State: | 6.9% (87,760) |
Number of households with income $50k - 60k:| Maryland: | 6.3% (43,078) |
| State: | 6.3% (80,968) |
Number of households with income $60k - 75k:| Maryland: | 8.6% (58,715) |
| New York: | 8.7% (110,631) |
Number of households with income $75k - 100k:| Maryland: | 11.2% (75,789) |
| State: | 11.2% (142,787) |
Number of households with income $100k - 125k:| Maryland: | 8.2% (55,537) |
| State: | 8.2% (104,850) |
Number of households with income $125k - 150k:| Maryland: | 6.3% (42,612) |
| State: | 6.3% (80,274) |
Number of households with income $150k - 200k:| Maryland: | 7.4% (50,374) |
| State: | 7.4% (95,117) |
Number of households with income > $200k:| Maryland: | 8.6% (58,095) |
| New York: | 8.6% (109,514) |
Aggregate household income in Maryland in 2022: $3,765,944
Median family income in Maryland in 2022:| Maryland: | $68,920 |
| State: | $68,770 |
Number of families with income < $10k:| Maryland: | 10.4% (10) |
| New York: | 6.9% (58,565) |
Number of families with income $10k - 20k:| Maryland: | 13.4% (12) |
| State: | 7.0% (59,058) |
Number of families with income $20k - 30k:| Maryland: | 15.3% (14) |
| State: | 8.0% (68,048) |
Number of families with income $30k - 40k:| Maryland: | 18.2% (17) |
| State: | 8.4% (70,668) |
Number of families with income $40k - 50k:| Maryland: | 10.3% (9) |
| State: | 7.4% (62,941) |
Number of families with income $50k - 60k:| Maryland: | 5.0% (5) |
| New York: | 6.6% (55,592) |
Number of families with income $60k - 75k:| Maryland: | 10.6% (10) |
| State: | 9.3% (78,564) |
Number of families with income $75k - 100k:| Maryland: | 10.1% (9) |
| State: | 12.6% (106,685) |
Number of families with income $100k - 125k:| Maryland: | 2.8% (3) |
| State: | 9.4% (79,139) |
Number of families with income $125k - 150k:| Maryland: | 1.3% (1) |
| New York: | 6.9% (58,255) |
Number of families with income $150k - 200k:| Maryland: | 1.7% (2) |
| State: | 8.3% (69,877) |
Number of families with income > $200k:| Maryland: | 0.8% (1) |
| New York: | 9.3% (78,555) |
Median per capita income in Maryland in 2022:| Maryland: | $26,353 |
| State: | $29,761 |
Change in median per capita income between 2000 and 2022:| Maryland, New York: | +127.3% |
| State: | +132.7% |
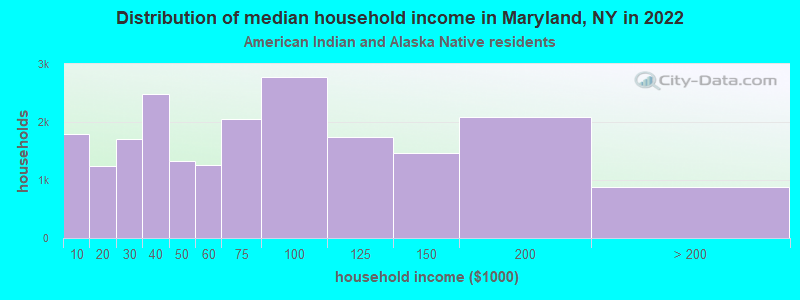
Income statistics for American Indian and Alaska Native residents
Median household income in Maryland, NY in 2022:| Maryland: | $57,144 |
| New York: | $63,208 |
Change in median household income between 2000 and 2022:| Maryland, New York: | +90.5% |
| State: | +110.1% |
Number of households with income < $10k:| Maryland: | 8.6% (1,791) |
| State: | 8.6% (3,559) |
Number of households with income $10k - 20k:| Maryland: | 6.0% (1,244) |
| State: | 5.9% (2,455) |
Number of households with income $20k - 30k:| Maryland: | 8.2% (1,701) |
| State: | 8.2% (3,393) |
Number of households with income $30k - 40k:| Maryland: | 11.9% (2,476) |
| State: | 11.9% (4,918) |
Number of households with income $40k - 50k:| Maryland: | 6.4% (1,330) |
| State: | 6.5% (2,682) |
Number of households with income $50k - 60k:| Maryland: | 6.0% (1,252) |
| New York: | 6.1% (2,516) |
Number of households with income $60k - 75k:| Maryland: | 9.9% (2,058) |
| New York: | 10.0% (4,125) |
Number of households with income $75k - 100k:| Maryland: | 13.4% (2,783) |
| State: | 13.3% (5,517) |
Number of households with income $100k - 125k:| Maryland: | 8.4% (1,737) |
| New York: | 8.4% (3,463) |
Number of households with income $125k - 150k:| Maryland: | 7.0% (1,460) |
| New York: | 7.0% (2,887) |
Number of households with income $150k - 200k:| Maryland: | 10.0% (2,081) |
| New York: | 9.9% (4,106) |
Number of households with income > $200k:| Maryland: | 4.2% (879) |
| State: | 4.2% (1,744) |
Aggregate household income in Maryland in 2022: $304,113
Median family income in Maryland in 2022:| Maryland: | $113,770 |
| New York: | $69,721 |
Median non-family income in Maryland in 2022:| Maryland: | $6,869 |
| State: | $33,910 |
Change in median non-family income between 2000 and 2022:| Maryland, New York: | +83.2% |
| New York: | +89.9% |
Median per capita income in Maryland in 2022:| Maryland: | $26,410 |
| New York: | $25,837 |
Change in median per capita income between 2000 and 2022:| Maryland, New York: | +75.0% |
| State: | +99.6% |
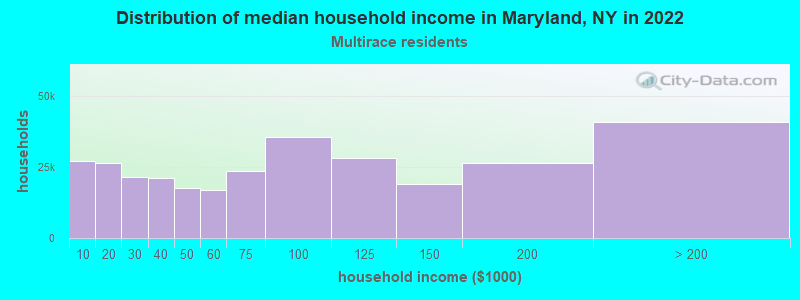
Income statistics for Multirace residents
Median household income in Maryland, NY in 2022:| Maryland: | $66,317 |
| New York: | $73,557 |
Change in median household income between 2000 and 2022:| Maryland, New York: | +116.5% |
| State: | +123.9% |
Number of households with income < $10k:| Maryland: | 8.9% (27,032) |
| State: | 8.9% (57,924) |
Number of households with income $10k - 20k:| Maryland: | 8.7% (26,364) |
| State: | 8.7% (56,590) |
Number of households with income $20k - 30k:| Maryland: | 7.1% (21,549) |
| New York: | 7.1% (46,287) |
Number of households with income $30k - 40k:| Maryland: | 6.9% (20,991) |
| State: | 6.9% (45,132) |
Number of households with income $40k - 50k:| Maryland: | 5.8% (17,615) |
| State: | 5.8% (37,946) |
Number of households with income $50k - 60k:| Maryland: | 5.6% (16,923) |
| State: | 5.6% (36,410) |
Number of households with income $60k - 75k:| Maryland: | 7.8% (23,606) |
| State: | 7.8% (50,819) |
Number of households with income $75k - 100k:| Maryland: | 11.7% (35,374) |
| State: | 11.7% (76,024) |
Number of households with income $100k - 125k:| Maryland: | 9.3% (28,149) |
| New York: | 9.3% (60,635) |
Number of households with income $125k - 150k:| Maryland: | 6.2% (18,862) |
| State: | 6.2% (40,533) |
Number of households with income $150k - 200k:| Maryland: | 8.6% (26,238) |
| New York: | 8.6% (56,409) |
Number of households with income > $200k:| Maryland: | 13.4% (40,733) |
| New York: | 13.4% (87,442) |
Aggregate household income in Maryland in 2022: $3,547,517
Median family income in Maryland in 2022:| Maryland: | $71,534 |
| State: | $85,788 |
Median per capita income in Maryland in 2022:| Maryland: | $16,538 |
| New York: | $36,931 |
Income statistics for other residents
Number of households with income < $10k:| Maryland: | 10.3% (100,327) |
| State: | 10.3% (69,252) |
Number of households with income $10k - 20k:| Maryland: | 11.0% (107,161) |
| State: | 11.0% (73,890) |
Number of households with income $20k - 30k:| Maryland: | 8.8% (85,777) |
| State: | 8.8% (59,096) |
Number of households with income $30k - 40k:| Maryland: | 8.1% (78,962) |
| New York: | 8.1% (54,418) |
Number of households with income $40k - 50k:| Maryland: | 7.3% (71,049) |
| New York: | 7.3% (49,042) |
Number of households with income $50k - 60k:| Maryland: | 6.5% (63,804) |
| State: | 6.5% (43,945) |
Number of households with income $60k - 75k:| Maryland: | 9.5% (92,918) |
| New York: | 9.5% (64,087) |
Number of households with income $75k - 100k:| Maryland: | 10.9% (105,859) |
| New York: | 10.9% (73,094) |
Number of households with income $100k - 125k:| Maryland: | 7.9% (76,743) |
| State: | 7.9% (53,055) |
Number of households with income $125k - 150k:| Maryland: | 5.9% (57,232) |
| State: | 5.9% (39,446) |
Number of households with income $150k - 200k:| Maryland: | 7.2% (70,261) |
| State: | 7.2% (48,653) |
Number of households with income > $200k:| Maryland: | 6.6% (64,692) |
| State: | 6.6% (44,703) |
Median per capita income in Maryland in 2022:| Maryland: | $74,466 |
| New York: | $26,975 |
Change in median per capita income between 2000 and 2022:| Maryland, New York: | +132.7% |
| State: | +144.6% |