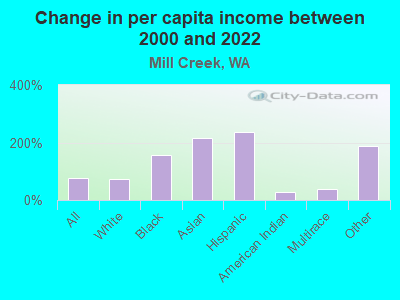
The median household income in Mill Creek, WA in 2022 was $115,377, which was 20.9% greater than the median annual income of $91,306 across the entire state of Washington. Compared to the median income of $69,702 in 2000 this represents an increase of 39.6%. The per capita income in 2022 was $64,070, which means an increase of 43.4% compared to 2000 when it was $36,234.
Whole page based on the data from 2000 / 2022 when the population of Mill Creek, Washington was 11,525 / 21,092
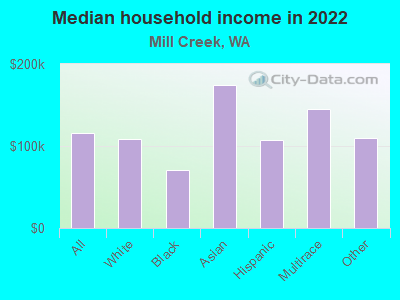
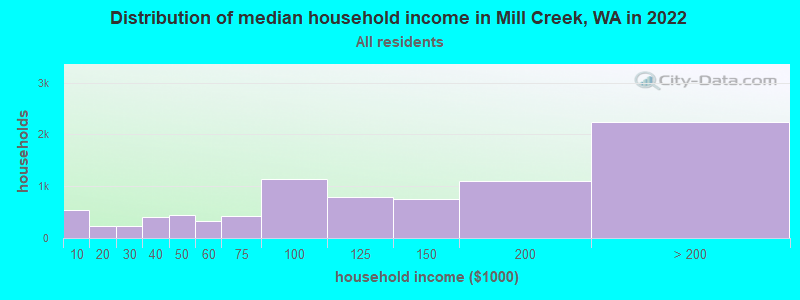
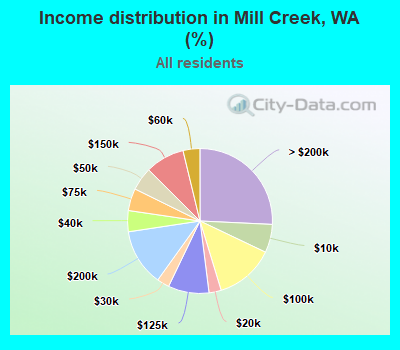
Income statistics for all residents
Median household income in Mill Creek, WA in 2022:
Mill Creek:
$115,377
Washington:
$91,306
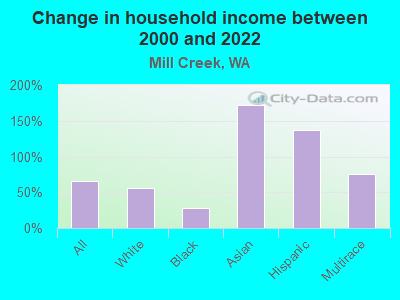
Change in median household income between 2000 and 2022:
Mill Creek, Washington:
+65.5%
Washington:
+99.5%
Number of households with income < $10k:
Mill Creek:
6.3% (550)
State:
4.5% (139,331)
Number of households with income $10k - 20k:
Mill Creek:
2.7% (236)
State:
5.0% (154,508)
Number of households with income $20k - 30k:
Mill Creek:
2.8% (241)
State:
5.4% (166,555)
Number of households with income $30k - 40k:
Mill Creek:
4.7% (410)
Washington:
5.5% (170,324)
Number of households with income $40k - 50k:
Mill Creek:
5.2% (451)
Washington:
6.0% (183,941)
Number of households with income $50k - 60k:
Mill Creek:
3.8% (327)
State:
6.1% (187,395)
Number of households with income $60k - 75k:
Mill Creek:
5.0% (432)
State:
8.7% (266,771)
Number of households with income $75k - 100k:
Mill Creek:
13.2% (1,149)
State:
13.1% (404,672)
Number of households with income $100k - 125k:
Mill Creek:
9.1% (794)
Washington:
11.0% (337,911)
Number of households with income $125k - 150k:
Mill Creek:
8.8% (762)
State:
8.0% (244,934)
Number of households with income $150k - 200k:
Mill Creek:
12.7% (1,105)
Washington:
10.5% (323,812)
Number of households with income > $200k:
Mill Creek:
25.8% (2,241)
State:
16.2% (499,799)
Aggregate household income in Mill Creek in 2022: $1,330,996,379
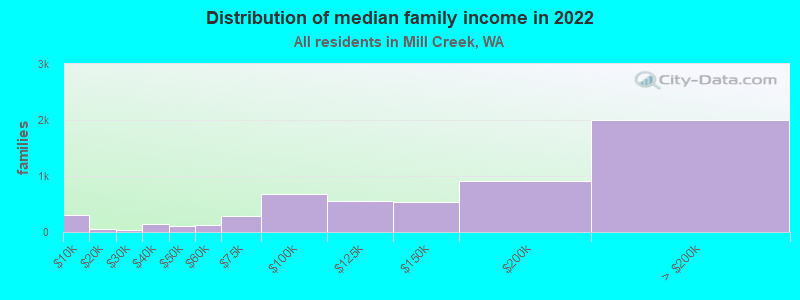
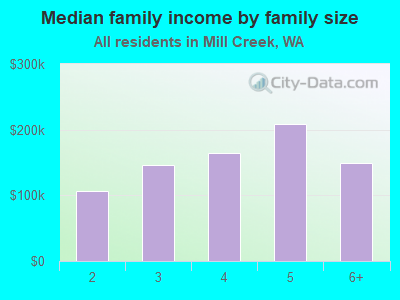
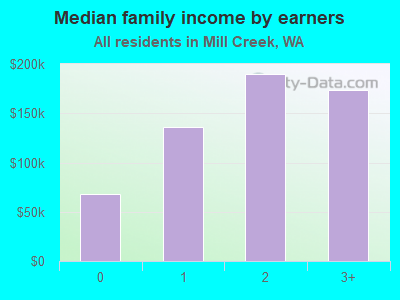
Median family income in Mill Creek in 2022:
Mill Creek:
$153,805
State:
$109,192
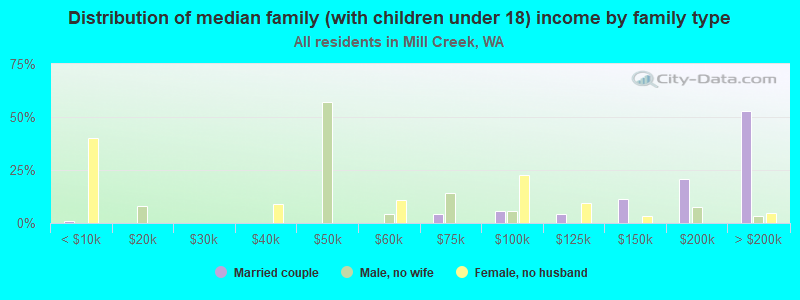
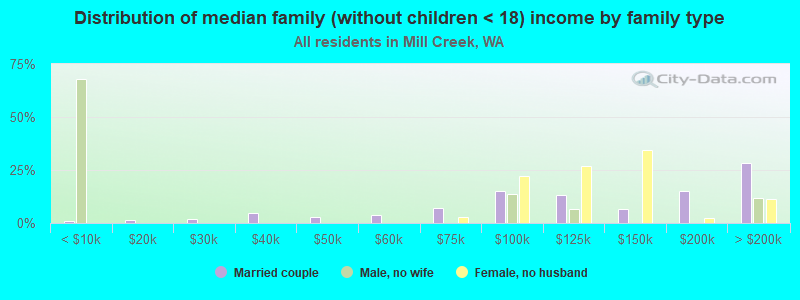
Number of families with income < $10k:
Mill Creek:
5.1% (295)
State:
2.9% (55,953)
Number of families with income $10k - 20k:
Mill Creek:
1.0% (55)
State:
2.6% (50,138)
Number of families with income $20k - 30k:
Mill Creek:
0.7% (39)
State:
3.2% (61,974)
Number of families with income $30k - 40k:
Mill Creek:
2.4% (138)
Washington:
4.1% (80,240)
Number of families with income $40k - 50k:
Mill Creek:
1.8% (106)
State:
4.9% (94,310)
Number of families with income $50k - 60k:
Mill Creek:
2.2% (127)
State:
5.3% (101,674)
Number of families with income $60k - 75k:
Mill Creek:
5.1% (293)
State:
8.2% (158,348)
Number of families with income $75k - 100k:
Mill Creek:
11.7% (673)
Washington:
13.8% (267,812)
Number of families with income $100k - 125k:
Mill Creek:
9.7% (554)
Washington:
12.4% (240,213)
Number of families with income $125k - 150k:
Mill Creek:
9.5% (543)
Washington:
9.3% (180,011)
Number of families with income $150k - 200k:
Mill Creek:
15.9% (911)
State:
13.0% (250,874)
Number of families with income > $200k:
Mill Creek:
34.9% (2,002)
Washington:
20.4% (393,898)
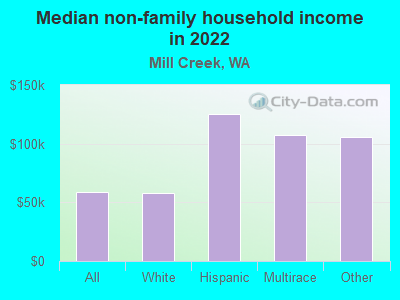
Median non-family income in Mill Creek in 2022:
Mill Creek:
$58,495
Washington:
$57,299
Change in median non-family income between 2000 and 2022:
Mill Creek, Washington:
+37.9%
State:
+94.9%
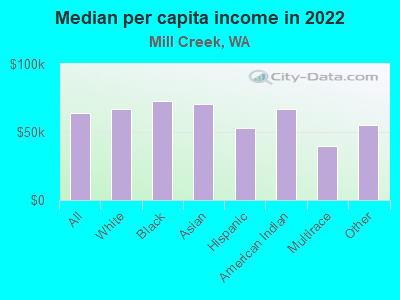
Median per capita income in Mill Creek in 2022:
Mill Creek:
$64,070
State:
$50,764
Change in median per capita income between 2000 and 2022:
Mill Creek, Washington:
+76.8%
State:
+121.0%
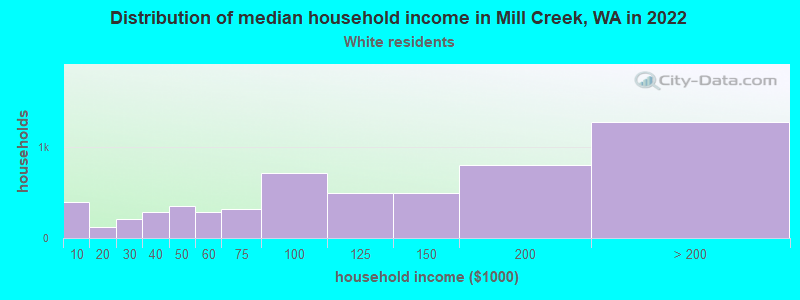
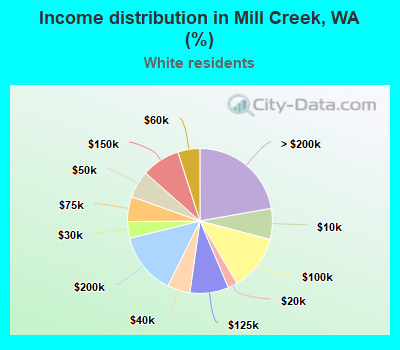
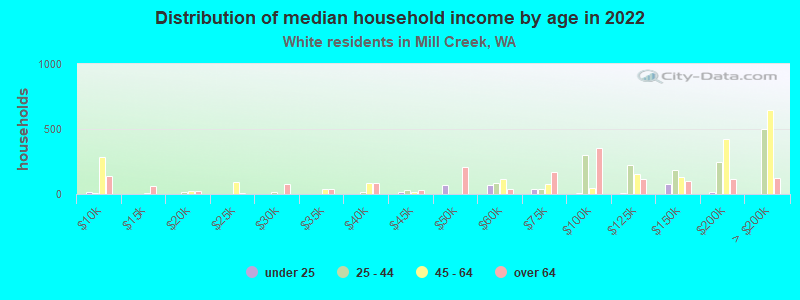
Income statistics for White residents
Median household income in Mill Creek, WA in 2022:
Mill Creek:
$108,131
Washington:
$91,916
Change in median household income between 2000 and 2022:
Mill Creek, Washington:
+56.0%
Washington:
+95.4%
Number of households with income < $10k:
Mill Creek:
6.9% (397)
State:
4.3% (95,850)
Number of households with income $10k - 20k:
Mill Creek:
2.1% (122)
State:
4.8% (106,421)
Number of households with income $20k - 30k:
Mill Creek:
3.7% (212)
State:
5.5% (122,860)
Number of households with income $30k - 40k:
Mill Creek:
5.0% (290)
State:
5.4% (119,627)
Number of households with income $40k - 50k:
Mill Creek:
6.1% (349)
Washington:
5.9% (132,276)
Number of households with income $50k - 60k:
Mill Creek:
4.9% (283)
Washington:
6.1% (136,212)
Number of households with income $60k - 75k:
Mill Creek:
5.6% (321)
State:
8.8% (196,086)
Number of households with income $75k - 100k:
Mill Creek:
12.4% (712)
Washington:
13.4% (299,192)
Number of households with income $100k - 125k:
Mill Creek:
8.6% (497)
State:
11.3% (252,209)
Number of households with income $125k - 150k:
Mill Creek:
8.6% (493)
Washington:
7.9% (175,962)
Number of households with income $150k - 200k:
Mill Creek:
13.9% (800)
State:
10.7% (239,156)
Number of households with income > $200k:
Mill Creek:
22.2% (1,279)
Washington:
16.1% (359,917)
Aggregate household income in Mill Creek in 2022: $824,355,162
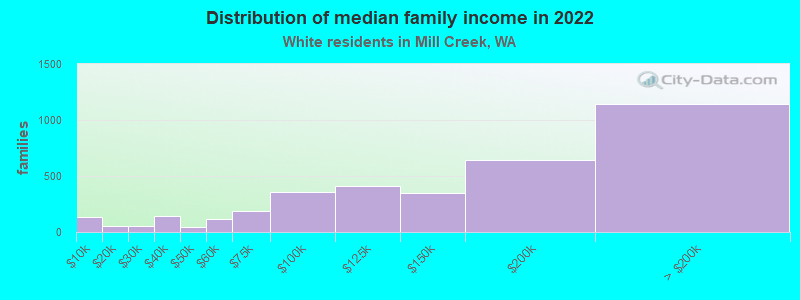
Median family income in Mill Creek in 2022:
Mill Creek:
$145,784
Washington:
$112,511
Number of families with income < $10k:
Mill Creek:
3.6% (132)
Washington:
2.4% (33,676)
Number of families with income $10k - 20k:
Mill Creek:
1.5% (54)
State:
2.0% (28,228)
Number of families with income $20k - 30k:
Mill Creek:
1.4% (52)
State:
2.9% (39,288)
Number of families with income $30k - 40k:
Mill Creek:
3.8% (140)
State:
3.6% (50,190)
Number of families with income $40k - 50k:
Mill Creek:
1.2% (45)
Washington:
4.6% (63,009)
Number of families with income $50k - 60k:
Mill Creek:
3.1% (114)
State:
5.0% (69,270)
Number of families with income $60k - 75k:
Mill Creek:
5.3% (191)
State:
8.2% (112,369)
Number of families with income $75k - 100k:
Mill Creek:
9.9% (361)
Washington:
14.1% (194,214)
Number of families with income $100k - 125k:
Mill Creek:
11.3% (413)
Washington:
13.2% (182,184)
Number of families with income $125k - 150k:
Mill Creek:
9.5% (344)
State:
9.5% (130,928)
Number of families with income $150k - 200k:
Mill Creek:
17.7% (644)
Washington:
13.7% (188,621)
Number of families with income > $200k:
Mill Creek:
31.6% (1,147)
State:
20.8% (285,982)
Median non-family income in Mill Creek in 2022:
Mill Creek:
$57,615
State:
$56,103
Change in median non-family income between 2000 and 2022:
Mill Creek, Washington:
+46.0%
Washington:
+87.7%
Median per capita income in Mill Creek in 2022:
Mill Creek:
$66,918
State:
$55,212
Change in median per capita income between 2000 and 2022:
Mill Creek, Washington:
+73.4%
State:
+123.8%
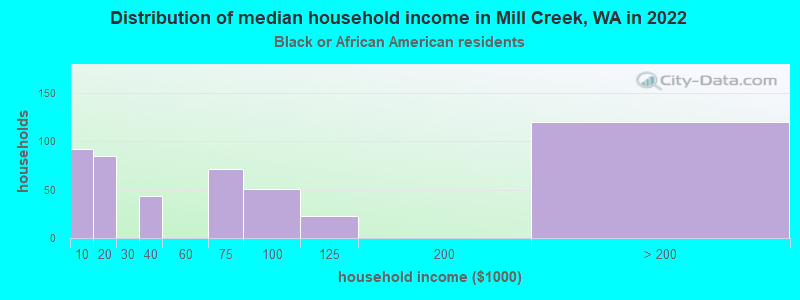
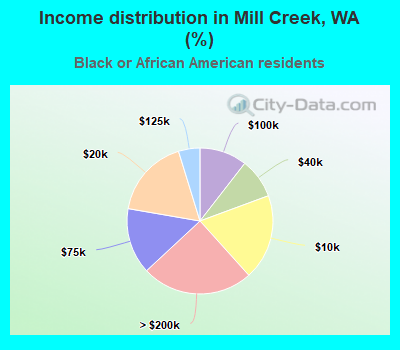
Income statistics for Black or African American residents
Median household income in Mill Creek, WA in 2022:
Mill Creek:
$70,128
State:
$68,202
Change in median household income between 2000 and 2022:
Mill Creek, Washington:
+27.5%
Washington:
+89.9%
Number of households with income < $10k:
Mill Creek:
19.0% (92)
Washington:
7.2% (8,014)
Number of households with income $10k - 20k:
Mill Creek:
17.5% (85)
Washington:
8.0% (8,904)
Number of households with income $20k - 30k:
Mill Creek:
0.0% (0)
Washington:
7.4% (8,207)
Number of households with income $30k - 40k:
Mill Creek:
8.9% (43)
State:
5.6% (6,220)
Number of households with income $40k - 50k:
Mill Creek:
0.0% (0)
State:
9.5% (10,585)
Number of households with income $50k - 60k:
Mill Creek:
0.0% (0)
Washington:
7.3% (8,078)
Number of households with income $60k - 75k:
Mill Creek:
14.6% (71)
Washington:
8.7% (9,704)
Number of households with income $75k - 100k:
Mill Creek:
10.5% (51)
State:
12.9% (14,315)
Number of households with income $100k - 125k:
Mill Creek:
4.7% (23)
State:
7.7% (8,592)
Number of households with income $125k - 150k:
Mill Creek:
0.0% (0)
State:
8.9% (9,840)
Number of households with income $150k - 200k:
Mill Creek:
0.0% (0)
State:
7.6% (8,434)
Number of households with income > $200k:
Mill Creek:
24.7% (120)
State:
9.1% (10,075)
Aggregate household income in Mill Creek in 2022: $59,811,251
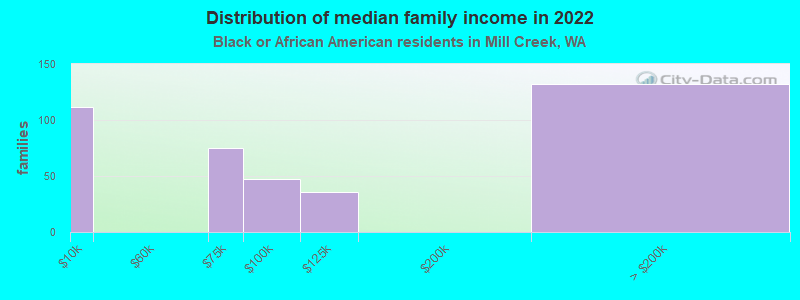
Median family income in Mill Creek in 2022:
Mill Creek:
$93,877
Washington:
$82,165
Number of families with income < $10k:
Mill Creek:
28.0% (112)
Washington:
5.5% (3,709)
Number of families with income $60k - 75k:
Mill Creek:
18.6% (75)
Washington:
9.3% (6,231)
Number of families with income $75k - 100k:
Mill Creek:
11.7% (47)
State:
14.8% (9,876)
Number of families with income $100k - 125k:
Mill Creek:
9.0% (36)
State:
9.0% (6,018)
Number of families with income > $200k:
Mill Creek:
32.8% (132)
State:
12.0% (8,041)
Median per capita income in Mill Creek in 2022:
Mill Creek:
$72,465
State:
$38,209
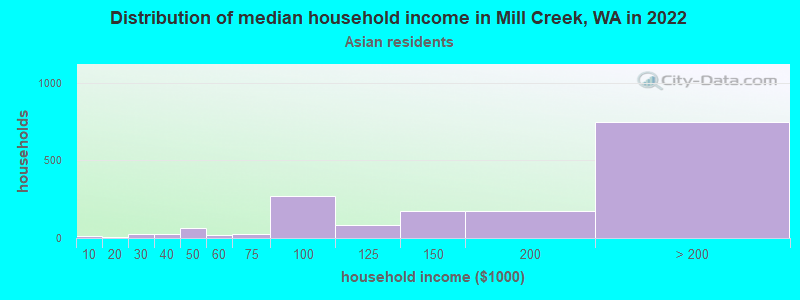
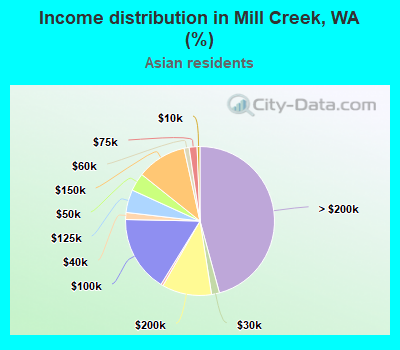
Income statistics for Asian residents
Median household income in Mill Creek, WA in 2022:
Mill Creek:
$174,114
State:
$125,692
Number of households with income < $10k:
Mill Creek:
0.6% (10)
State:
4.9% (14,099)
Number of households with income $10k - 20k:
Mill Creek:
0.5% (8)
Washington:
3.5% (9,873)
Number of households with income $20k - 30k:
Mill Creek:
1.7% (28)
State:
2.9% (8,352)
Number of households with income $30k - 40k:
Mill Creek:
1.5% (25)
Washington:
4.0% (11,415)
Number of households with income $40k - 50k:
Mill Creek:
3.9% (64)
State:
4.0% (11,421)
Number of households with income $50k - 60k:
Mill Creek:
1.1% (18)
State:
4.2% (12,100)
Number of households with income $60k - 75k:
Mill Creek:
1.7% (28)
Washington:
6.3% (17,903)
Number of households with income $75k - 100k:
Mill Creek:
16.5% (270)
Washington:
10.4% (29,663)
Number of households with income $100k - 125k:
Mill Creek:
5.0% (81)
State:
9.4% (26,839)
Number of households with income $125k - 150k:
Mill Creek:
10.8% (177)
State:
8.5% (24,200)
Number of households with income $150k - 200k:
Mill Creek:
10.8% (176)
Washington:
12.6% (35,976)
Number of households with income > $200k:
Mill Creek:
45.8% (748)
State:
29.2% (83,109)
Aggregate household income in Mill Creek in 2022: $343,711,923
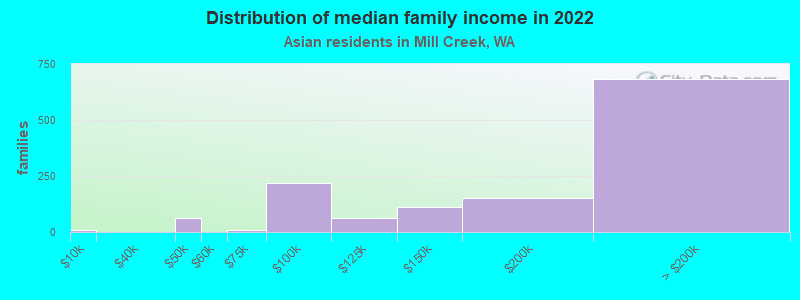
Median family income in Mill Creek in 2022:
Mill Creek:
$182,869
Washington:
$143,595
Number of families with income < $10k:
Mill Creek:
0.6% (8)
State:
2.9% (5,479)
Number of families with income $40k - 50k:
Mill Creek:
4.7% (61)
State:
3.6% (6,707)
Number of families with income $60k - 75k:
Mill Creek:
0.7% (9)
State:
5.1% (9,490)
Number of families with income $75k - 100k:
Mill Creek:
16.8% (219)
State:
11.7% (21,919)
Number of families with income $100k - 125k:
Mill Creek:
4.7% (62)
Washington:
9.3% (17,280)
Number of families with income $125k - 150k:
Mill Creek:
8.6% (112)
Washington:
8.4% (15,602)
Number of families with income $150k - 200k:
Mill Creek:
11.8% (154)
State:
13.3% (24,789)
Number of families with income > $200k:
Mill Creek:
52.1% (682)
Washington:
34.4% (64,250)
Median per capita income in Mill Creek in 2022:
Mill Creek:
$70,401
State:
$67,666
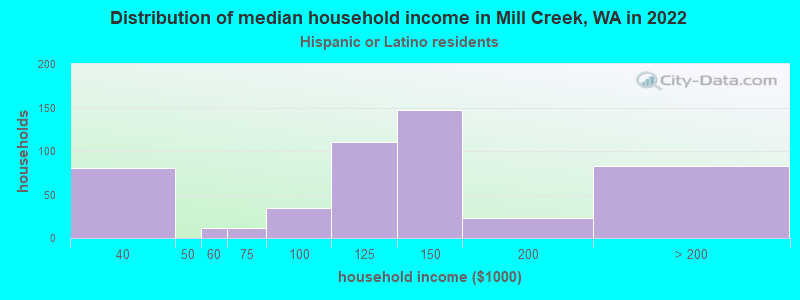
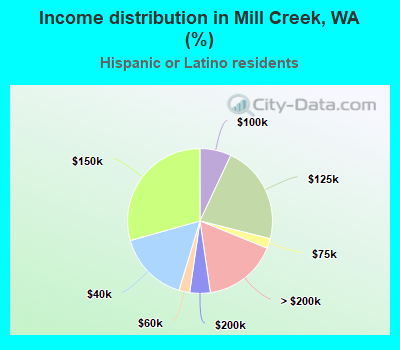
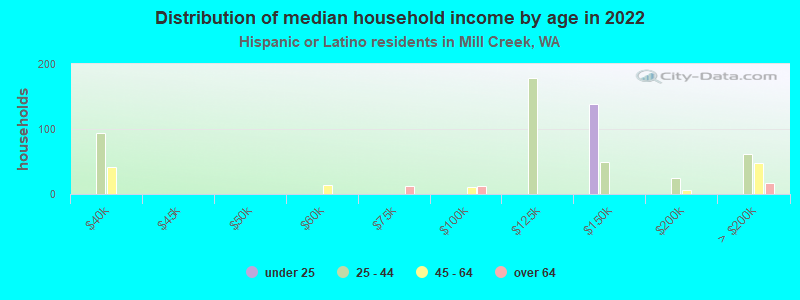
Income statistics for Hispanic or Latino residents
Median household income in Mill Creek, WA in 2022:
Mill Creek:
$107,241
State:
$74,770
Change in median household income between 2000 and 2022:
Mill Creek, Washington:
+137.5%
State:
+128.3%
Number of households with income < $10k:
Mill Creek:
0.0% (0)
Washington:
4.9% (14,456)
Number of households with income $10k - 20k:
Mill Creek:
0.0% (0)
State:
5.3% (15,449)
Number of households with income $20k - 30k:
Mill Creek:
0.0% (0)
Washington:
6.8% (20,016)
Number of households with income $30k - 40k:
Mill Creek:
16.0% (80)
State:
7.7% (22,548)
Number of households with income $40k - 50k:
Mill Creek:
0.0% (0)
Washington:
7.3% (21,450)
Number of households with income $50k - 60k:
Mill Creek:
2.4% (12)
Washington:
7.7% (22,744)
Number of households with income $60k - 75k:
Mill Creek:
2.2% (11)
State:
10.5% (30,737)
Number of households with income $75k - 100k:
Mill Creek:
7.0% (35)
State:
14.9% (43,843)
Number of households with income $100k - 125k:
Mill Creek:
22.0% (110)
State:
11.1% (32,554)
Number of households with income $125k - 150k:
Mill Creek:
29.3% (147)
State:
7.4% (21,624)
Number of households with income $150k - 200k:
Mill Creek:
4.6% (23)
State:
7.3% (21,360)
Number of households with income > $200k:
Mill Creek:
16.6% (83)
Washington:
9.2% (27,055)
Aggregate household income in Mill Creek in 2022: $67,550,311
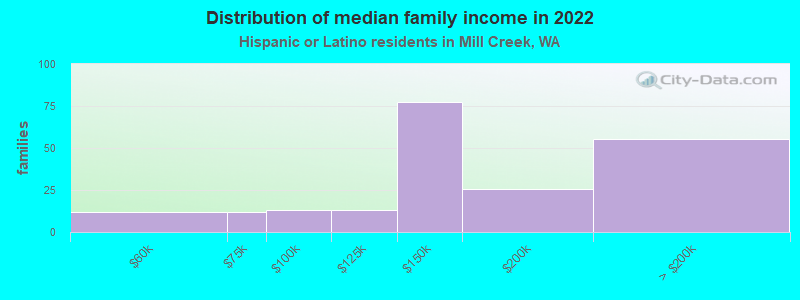
Median family income in Mill Creek in 2022:
Mill Creek:
$121,886
State:
$76,866
Number of families with income $50k - 60k:
Mill Creek:
5.7% (12)
Washington:
7.9% (16,852)
Number of families with income $60k - 75k:
Mill Creek:
5.7% (12)
Washington:
11.4% (24,342)
Number of families with income $75k - 100k:
Mill Creek:
6.4% (13)
State:
14.4% (30,698)
Number of families with income $100k - 125k:
Mill Creek:
6.2% (13)
State:
11.4% (24,331)
Number of families with income $125k - 150k:
Mill Creek:
37.2% (77)
Washington:
7.5% (16,099)
Number of families with income $150k - 200k:
Mill Creek:
12.2% (25)
State:
8.2% (17,551)
Number of families with income > $200k:
Mill Creek:
26.7% (56)
Washington:
9.7% (20,653)
Median non-family income in Mill Creek in 2022:
Mill Creek:
$125,423
State:
$54,173
Change in median non-family income between 2000 and 2022:
Mill Creek, Washington:
+96.7%
Washington:
+105.8%
Median per capita income in Mill Creek in 2022:
Mill Creek:
$52,952
State:
$28,252
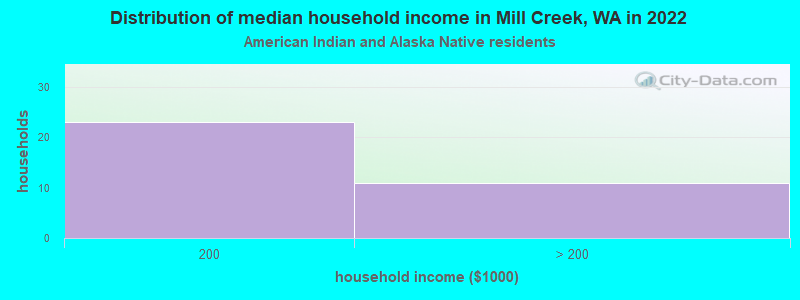
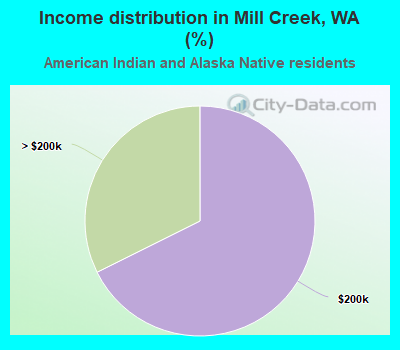
Income statistics for American Indian and Alaska Native residents
Number of households with income < $10k:
Mill Creek:
0.0% (0)
Washington:
5.9% (1,768)
Number of households with income $10k - 20k:
Mill Creek:
0.0% (0)
Washington:
8.9% (2,694)
Number of households with income $20k - 30k:
Mill Creek:
0.0% (0)
State:
8.0% (2,412)
Number of households with income $30k - 40k:
Mill Creek:
0.0% (0)
State:
7.7% (2,327)
Number of households with income $40k - 50k:
Mill Creek:
0.0% (0)
State:
5.8% (1,755)
Number of households with income $50k - 60k:
Mill Creek:
0.0% (0)
State:
7.5% (2,259)
Number of households with income $60k - 75k:
Mill Creek:
0.0% (0)
Washington:
8.8% (2,669)
Number of households with income $75k - 100k:
Mill Creek:
0.0% (0)
State:
12.8% (3,861)
Number of households with income $100k - 125k:
Mill Creek:
0.0% (0)
State:
12.0% (3,618)
Number of households with income $125k - 150k:
Mill Creek:
0.0% (0)
Washington:
8.6% (2,580)
Number of households with income $150k - 200k:
Mill Creek:
67.6% (23)
State:
5.9% (1,774)
Number of households with income > $200k:
Mill Creek:
32.4% (11)
Washington:
8.1% (2,447)
Aggregate household income in Mill Creek in 2022: $12,584,123
Median per capita income in Mill Creek in 2022:
Mill Creek:
$66,725
Washington:
$27,053
Change in median per capita income between 2000 and 2022:
Mill Creek, Washington:
+29.1%
State:
+98.6%
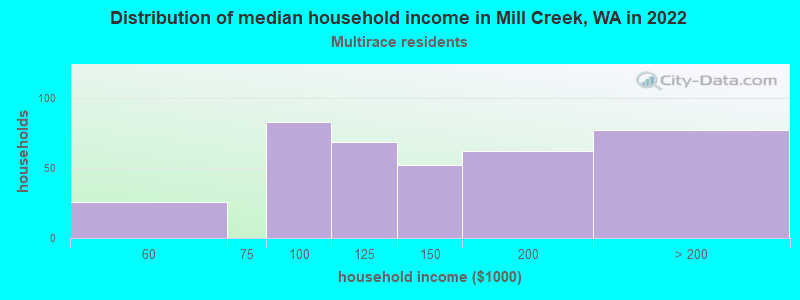
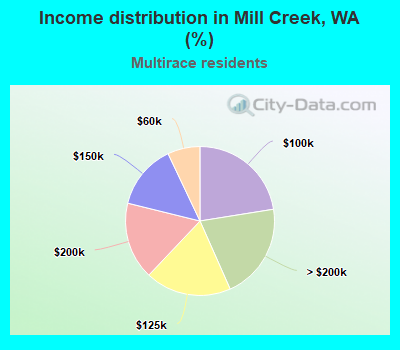
Income statistics for Multirace residents
Median household income in Mill Creek, WA in 2022:
Mill Creek:
$145,321
State:
$84,303
Change in median household income between 2000 and 2022:
Mill Creek, Washington:
+75.4%
State:
+125.7%
Number of households with income < $10k:
Mill Creek:
0.0% (0)
State:
4.3% (12,040)
Number of households with income $10k - 20k:
Mill Creek:
0.0% (0)
State:
6.6% (18,437)
Number of households with income $20k - 30k:
Mill Creek:
0.0% (0)
State:
5.2% (14,559)
Number of households with income $30k - 40k:
Mill Creek:
0.0% (0)
State:
6.7% (18,491)
Number of households with income $40k - 50k:
Mill Creek:
0.0% (0)
Washington:
6.3% (17,459)
Number of households with income $50k - 60k:
Mill Creek:
7.0% (26)
Washington:
6.9% (19,086)
Number of households with income $60k - 75k:
Mill Creek:
0.0% (0)
State:
9.1% (25,310)
Number of households with income $75k - 100k:
Mill Creek:
22.5% (83)
State:
13.5% (37,493)
Number of households with income $100k - 125k:
Mill Creek:
18.7% (69)
State:
10.7% (29,626)
Number of households with income $125k - 150k:
Mill Creek:
14.1% (52)
State:
8.6% (23,899)
Number of households with income $150k - 200k:
Mill Creek:
16.8% (62)
Washington:
10.2% (28,214)
Number of households with income > $200k:
Mill Creek:
20.9% (77)
State:
11.9% (32,947)
Aggregate household income in Mill Creek in 2022: $61,180,797
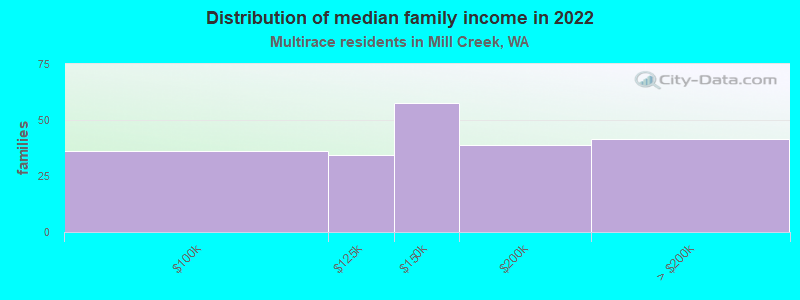
Median family income in Mill Creek in 2022:
Mill Creek:
$153,807
Washington:
$95,629
Number of families with income $75k - 100k:
Mill Creek:
17.4% (36)
Washington:
13.6% (23,984)
Number of families with income $100k - 125k:
Mill Creek:
16.5% (34)
State:
10.4% (18,288)
Number of families with income $125k - 150k:
Mill Creek:
27.7% (58)
Washington:
10.5% (18,481)
Number of families with income $150k - 200k:
Mill Creek:
18.7% (39)
Washington:
11.9% (20,852)
Number of families with income > $200k:
Mill Creek:
19.8% (41)
Washington:
14.4% (25,289)
Median non-family income in Mill Creek in 2022:
Mill Creek:
$106,994
State:
$56,573
Change in median non-family income between 2000 and 2022:
Mill Creek, Washington:
+97.9%
State:
+115.0%
Median per capita income in Mill Creek in 2022:
Mill Creek:
$39,740
State:
$32,496
Change in median per capita income between 2000 and 2022:
Mill Creek, Washington:
+38.6%
Washington:
+156.8%
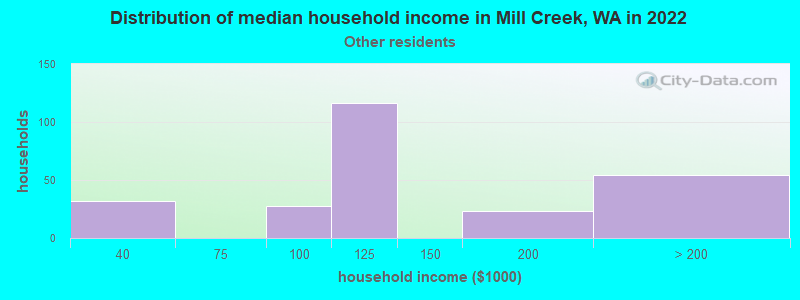
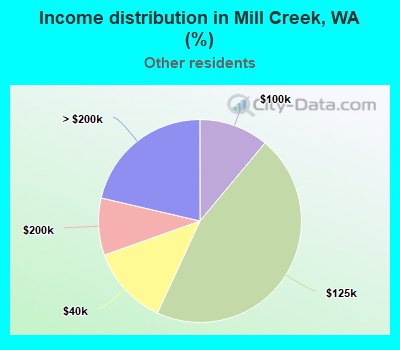
Income statistics for other residents
Median household income in Mill Creek, WA in 2022:
Mill Creek:
$109,481
State:
$69,545
Number of households with income < $10k:
Mill Creek:
0.0% (0)
Washington:
5.3% (6,540)
Number of households with income $10k - 20k:
Mill Creek:
0.0% (0)
State:
6.0% (7,385)
Number of households with income $20k - 30k:
Mill Creek:
0.0% (0)
State:
7.5% (9,289)
Number of households with income $30k - 40k:
Mill Creek:
12.6% (32)
State:
8.9% (11,015)
Number of households with income $40k - 50k:
Mill Creek:
0.0% (0)
State:
7.6% (9,399)
Number of households with income $50k - 60k:
Mill Creek:
0.0% (0)
Washington:
7.2% (8,867)
Number of households with income $60k - 75k:
Mill Creek:
0.0% (0)
State:
10.5% (13,032)
Number of households with income $75k - 100k:
Mill Creek:
11.1% (28)
State:
14.6% (18,007)
Number of households with income $100k - 125k:
Mill Creek:
45.8% (116)
State:
12.2% (15,128)
Number of households with income $125k - 150k:
Mill Creek:
0.0% (0)
State:
5.6% (6,950)
Number of households with income $150k - 200k:
Mill Creek:
9.1% (23)
State:
7.1% (8,749)
Number of households with income > $200k:
Mill Creek:
21.3% (54)
State:
7.5% (9,208)
Aggregate household income in Mill Creek in 2022: $43,254,560
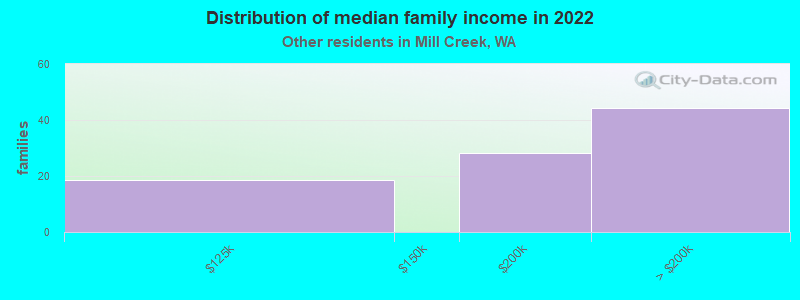
Median family income in Mill Creek in 2022:
Mill Creek:
$227,470
State:
$72,588
Number of families with income $100k - 125k:
Mill Creek:
20.4% (19)
Washington:
12.9% (12,298)
Number of families with income $150k - 200k:
Mill Creek:
31.0% (28)
Washington:
8.2% (7,822)
Number of families with income > $200k:
Mill Creek:
48.6% (44)
State:
7.1% (6,764)
Median non-family income in Mill Creek in 2022:
Mill Creek:
$105,803
Washington:
$44,777
Median per capita income in Mill Creek in 2022:
Mill Creek:
$55,023
State:
$27,542
Discuss Mill Creek, Washington (WA) on our hugely popular Washington forum.