Mill Plain, Washington (WA) income map, earnings map, and wages data
The median household income in Mill Plain, WA in 2022 was $110,215, which was 17.2% greater than the median annual income of $91,306 across the entire state of Washington. Compared to the median income of $58,432 in 2000 this represents an increase of 47.0%. The per capita income in 2022 was $46,334, which means an increase of 54.3% compared to 2000 when it was $21,181.
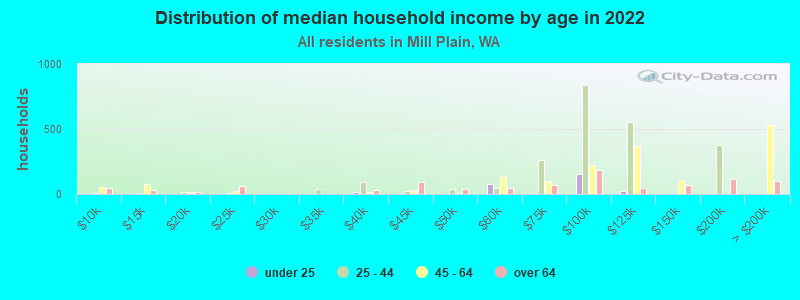
Income statistics for all residents
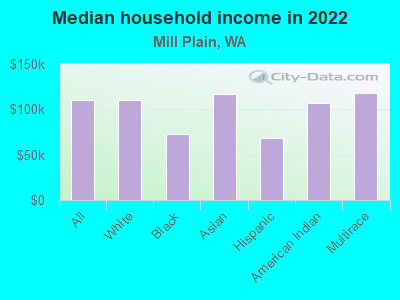
Median household income in Mill Plain, WA in 2022:| Mill Plain: | $110,216 |
| State: | $91,306 |
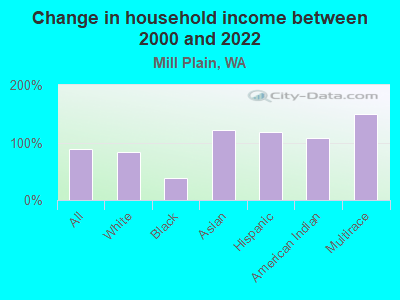
Change in median household income between 2000 and 2022:| Mill Plain, Washington: | +88.6% |
| State: | +99.5% |
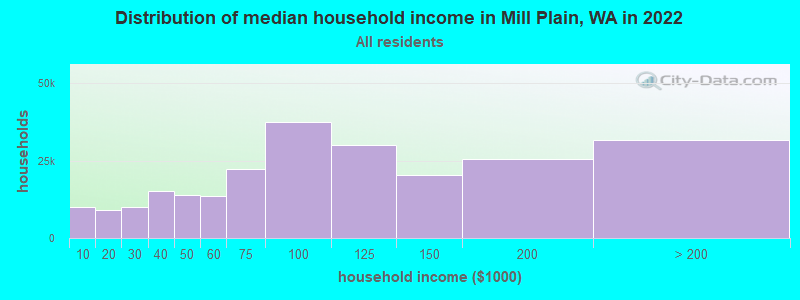
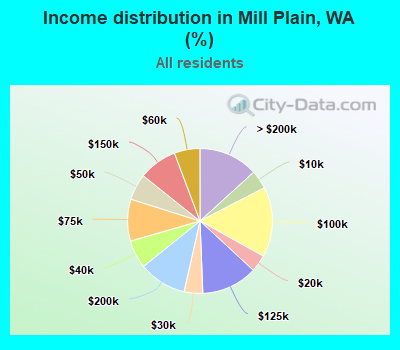
Number of households with income < $10k:| Mill Plain: | 4.2% (9,958) |
| State: | 4.5% (139,331) |
Number of households with income $10k - 20k:| Mill Plain: | 3.8% (9,154) |
| Washington: | 5.0% (154,508) |
Number of households with income $20k - 30k:| Mill Plain: | 4.2% (9,961) |
| State: | 5.4% (166,555) |
Number of households with income $30k - 40k:| Mill Plain: | 6.3% (15,085) |
| Washington: | 5.5% (170,324) |
Number of households with income $40k - 50k:| Mill Plain: | 5.8% (14,002) |
| State: | 6.0% (183,941) |
Number of households with income $50k - 60k:| Mill Plain: | 5.7% (13,709) |
| State: | 6.1% (187,395) |
Number of households with income $60k - 75k:| Mill Plain: | 9.3% (22,399) |
| Washington: | 8.7% (266,771) |
Number of households with income $75k - 100k:| Mill Plain: | 15.6% (37,483) |
| Washington: | 13.1% (404,672) |
Number of households with income $100k - 125k:| Mill Plain: | 12.5% (29,937) |
| State: | 11.0% (337,911) |
Number of households with income $125k - 150k:| Mill Plain: | 8.6% (20,507) |
| State: | 8.0% (244,934) |
Number of households with income $150k - 200k:| Mill Plain: | 10.7% (25,633) |
| Washington: | 10.5% (323,812) |
Number of households with income > $200k:| Mill Plain: | 13.3% (31,813) |
| State: | 16.2% (499,799) |
Aggregate household income in Mill Plain in 2022: $1,742,783,547
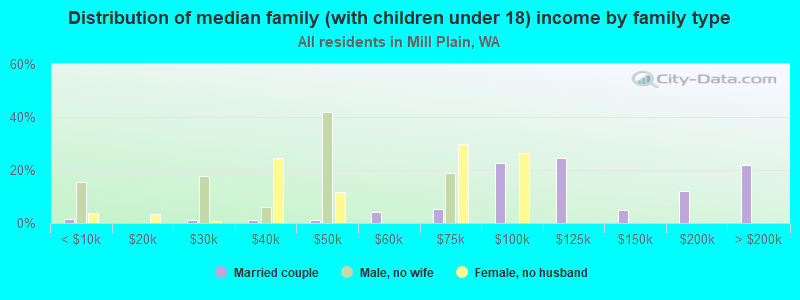
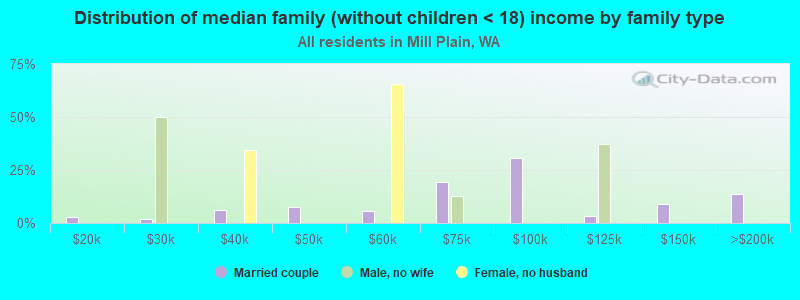
Median family income in Mill Plain in 2022:| Mill Plain: | $114,667 |
| Washington: | $109,192 |
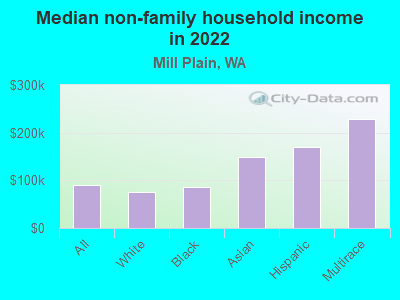
Median non-family income in Mill Plain in 2022:| Mill Plain: | $89,739 |
| State: | $57,299 |
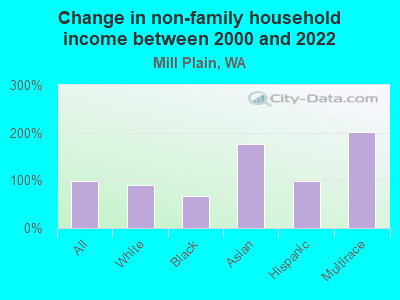
Change in median non-family income between 2000 and 2022:| Mill Plain, Washington: | +99.0% |
| State: | +94.9% |
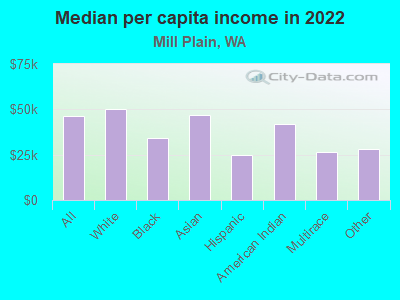
Median per capita income in Mill Plain in 2022:| Mill Plain: | $46,335 |
| State: | $50,764 |
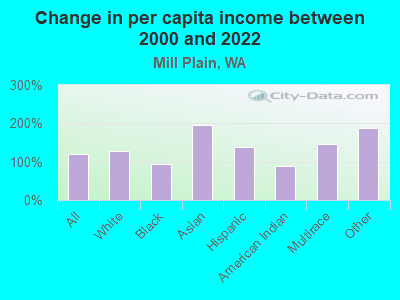
Change in median per capita income between 2000 and 2022:| Mill Plain, Washington: | +118.8% |
| State: | +121.0% |
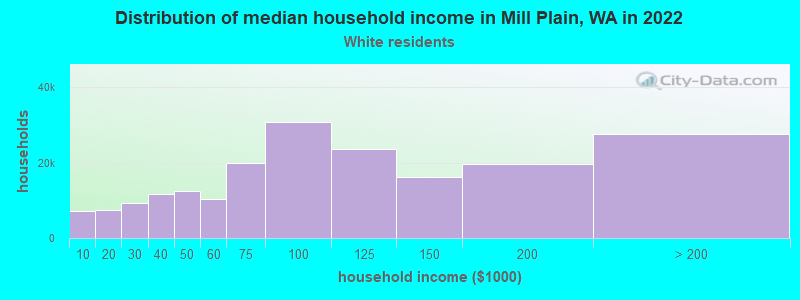
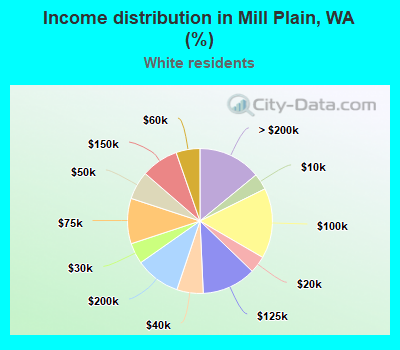
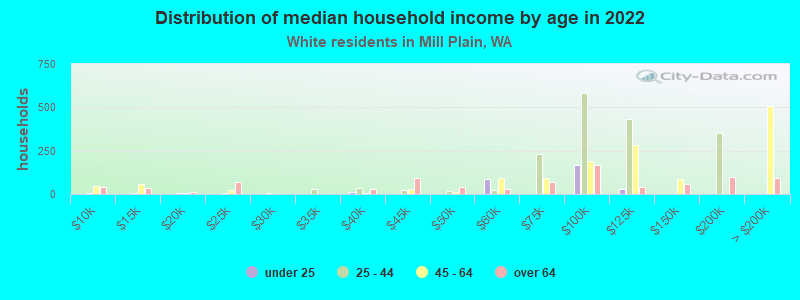
Income statistics for White residents
Median household income in Mill Plain, WA in 2022:| Mill Plain: | $110,135 |
| Washington: | $91,916 |
Change in median household income between 2000 and 2022:| Mill Plain, Washington: | +84.4% |
| Washington: | +95.4% |
Number of households with income < $10k:| Mill Plain: | 3.6% (7,134) |
| State: | 4.3% (95,850) |
Number of households with income $10k - 20k:| Mill Plain: | 3.8% (7,490) |
| Washington: | 4.8% (106,421) |
Number of households with income $20k - 30k:| Mill Plain: | 4.7% (9,177) |
| State: | 5.5% (122,860) |
Number of households with income $30k - 40k:| Mill Plain: | 5.9% (11,563) |
| State: | 5.4% (119,627) |
Number of households with income $40k - 50k:| Mill Plain: | 6.3% (12,381) |
| State: | 5.9% (132,276) |
Number of households with income $50k - 60k:| Mill Plain: | 5.3% (10,427) |
| Washington: | 6.1% (136,212) |
Number of households with income $60k - 75k:| Mill Plain: | 10.1% (19,852) |
| State: | 8.8% (196,086) |
Number of households with income $75k - 100k:| Mill Plain: | 15.7% (30,811) |
| Washington: | 13.4% (299,192) |
Number of households with income $100k - 125k:| Mill Plain: | 12.1% (23,686) |
| State: | 11.3% (252,209) |
Number of households with income $125k - 150k:| Mill Plain: | 8.3% (16,324) |
| Washington: | 7.9% (175,962) |
Number of households with income $150k - 200k:| Mill Plain: | 10.1% (19,786) |
| Washington: | 10.7% (239,156) |
Number of households with income > $200k:| Mill Plain: | 14.1% (27,572) |
| State: | 16.1% (359,917) |
Aggregate household income in Mill Plain in 2022: $1,324,048,461
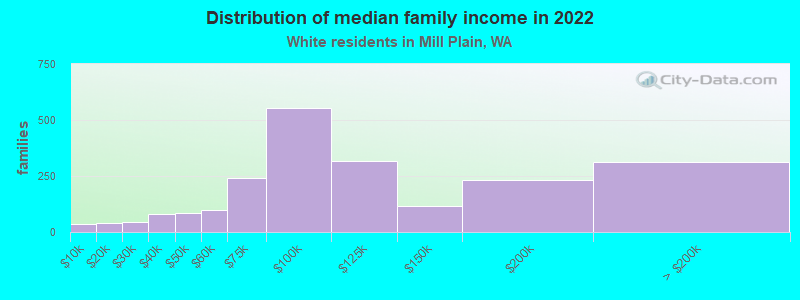
Median family income in Mill Plain in 2022:| Mill Plain: | $117,740 |
| State: | $112,511 |
Number of families with income < $10k:| Mill Plain: | 1.6% (35) |
| State: | 2.4% (33,676) |
Number of families with income $10k - 20k:| Mill Plain: | 1.7% (38) |
| State: | 2.0% (28,228) |
Number of families with income $20k - 30k:| Mill Plain: | 2.1% (45) |
| State: | 2.9% (39,288) |
Number of families with income $30k - 40k:| Mill Plain: | 3.8% (81) |
| Washington: | 3.6% (50,190) |
Number of families with income $40k - 50k:| Mill Plain: | 3.9% (84) |
| State: | 4.6% (63,009) |
Number of families with income $50k - 60k:| Mill Plain: | 4.6% (100) |
| Washington: | 5.0% (69,270) |
Number of families with income $60k - 75k:| Mill Plain: | 11.3% (243) |
| Washington: | 8.2% (112,369) |
Number of families with income $75k - 100k:| Mill Plain: | 25.7% (555) |
| State: | 14.1% (194,214) |
Number of families with income $100k - 125k:| Mill Plain: | 14.8% (319) |
| State: | 13.2% (182,184) |
Number of families with income $125k - 150k:| Mill Plain: | 5.5% (118) |
| Washington: | 9.5% (130,928) |
Number of families with income $150k - 200k:| Mill Plain: | 10.7% (230) |
| State: | 13.7% (188,621) |
Number of families with income > $200k:| Mill Plain: | 14.4% (311) |
| Washington: | 20.8% (285,982) |
Median non-family income in Mill Plain in 2022:| Mill Plain: | $74,665 |
| State: | $56,103 |
Change in median non-family income between 2000 and 2022:| Mill Plain, Washington: | +89.8% |
| Washington: | +87.7% |
Median per capita income in Mill Plain in 2022:| Mill Plain: | $50,054 |
| State: | $55,212 |
Change in median per capita income between 2000 and 2022:| Mill Plain, Washington: | +127.1% |
| Washington: | +123.8% |
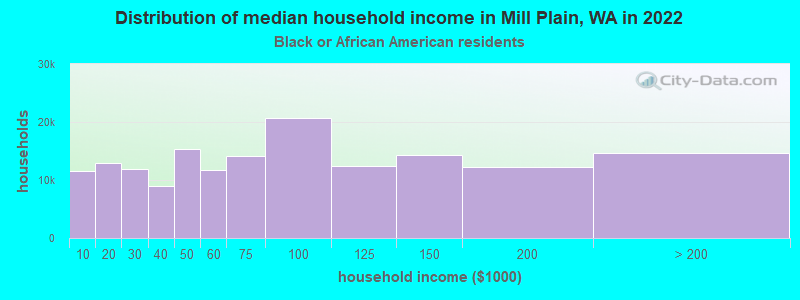
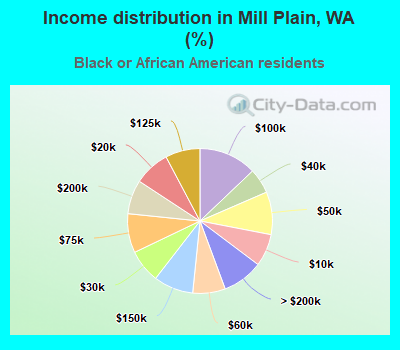
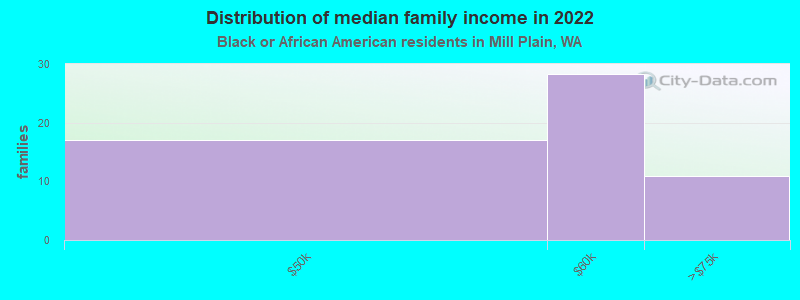
Income statistics for Black or African American residents
Median household income in Mill Plain, WA in 2022:| Mill Plain: | $72,311 |
| Washington: | $68,202 |
Change in median household income between 2000 and 2022:| Mill Plain, Washington: | +39.0% |
| State: | +89.9% |
Number of households with income < $10k:| Mill Plain: | 7.2% (11,610) |
| State: | 7.2% (8,014) |
Number of households with income $10k - 20k:| Mill Plain: | 8.0% (12,899) |
| State: | 8.0% (8,904) |
Number of households with income $20k - 30k:| Mill Plain: | 7.4% (11,890) |
| State: | 7.4% (8,207) |
Number of households with income $30k - 40k:| Mill Plain: | 5.6% (9,011) |
| Washington: | 5.6% (6,220) |
Number of households with income $40k - 50k:| Mill Plain: | 9.5% (15,335) |
| State: | 9.5% (10,585) |
Number of households with income $50k - 60k:| Mill Plain: | 7.3% (11,703) |
| State: | 7.3% (8,078) |
Number of households with income $60k - 75k:| Mill Plain: | 8.7% (14,058) |
| Washington: | 8.7% (9,704) |
Number of households with income $75k - 100k:| Mill Plain: | 12.9% (20,738) |
| State: | 12.9% (14,315) |
Number of households with income $100k - 125k:| Mill Plain: | 7.7% (12,447) |
| Washington: | 7.7% (8,592) |
Number of households with income $125k - 150k:| Mill Plain: | 8.9% (14,255) |
| Washington: | 8.9% (9,840) |
Number of households with income $150k - 200k:| Mill Plain: | 7.6% (12,218) |
| State: | 7.6% (8,434) |
Number of households with income > $200k:| Mill Plain: | 9.1% (14,596) |
| State: | 9.1% (10,075) |
Aggregate household income in Mill Plain in 2022: $11,467,032
Median family income in Mill Plain in 2022:| Mill Plain: | $71,379 |
| State: | $82,165 |
Number of families with income $40k - 50k:| Mill Plain: | 30.3% (17) |
| State: | 6.8% (4,558) |
Number of families with income $50k - 60k:| Mill Plain: | 50.4% (28) |
| State: | 7.0% (4,687) |
Number of families with income $60k - 75k:| Mill Plain: | 19.3% (11) |
| State: | 9.3% (6,231) |
Median non-family income in Mill Plain in 2022:| Mill Plain: | $86,010 |
| State: | $49,169 |
Change in median non-family income between 2000 and 2022:| Mill Plain, Washington: | +67.8% |
| Washington: | +87.7% |
Median per capita income in Mill Plain in 2022:| Mill Plain: | $33,961 |
| Washington: | $38,209 |
Change in median per capita income between 2000 and 2022:| Mill Plain, Washington: | +93.7% |
| State: | +115.3% |
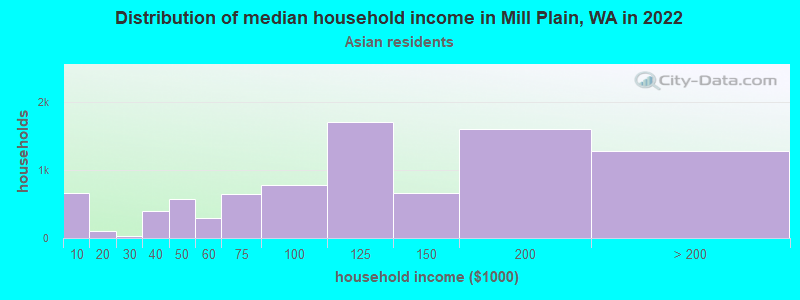
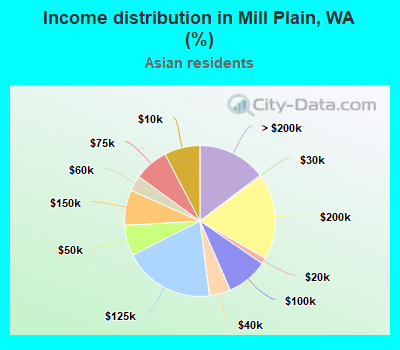
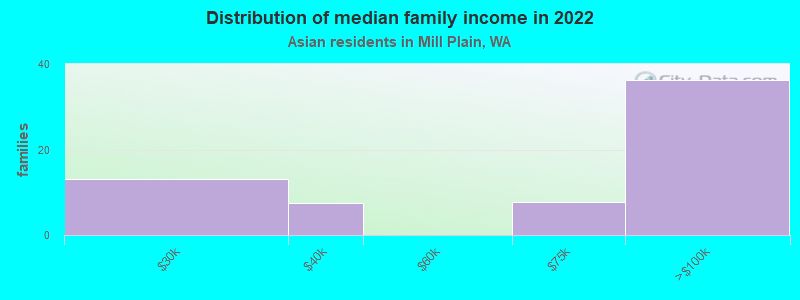
Income statistics for Asian residents
Median household income in Mill Plain, WA in 2022:| Mill Plain: | $116,700 |
| State: | $125,692 |
Change in median household income between 2000 and 2022:| Mill Plain, Washington: | +121.5% |
| State: | +164.5% |
Number of households with income < $10k:| Mill Plain: | 7.7% (668) |
| State: | 4.9% (14,099) |
Number of households with income $10k - 20k:| Mill Plain: | 1.3% (110) |
| Washington: | 3.5% (9,873) |
Number of households with income $20k - 30k:| Mill Plain: | 0.4% (31) |
| State: | 2.9% (8,352) |
Number of households with income $30k - 40k:| Mill Plain: | 4.6% (397) |
| Washington: | 4.0% (11,415) |
Number of households with income $40k - 50k:| Mill Plain: | 6.6% (574) |
| Washington: | 4.0% (11,421) |
Number of households with income $50k - 60k:| Mill Plain: | 3.3% (290) |
| State: | 4.2% (12,100) |
Number of households with income $60k - 75k:| Mill Plain: | 7.3% (641) |
| Washington: | 6.3% (17,903) |
Number of households with income $75k - 100k:| Mill Plain: | 8.9% (775) |
| Washington: | 10.4% (29,663) |
Number of households with income $100k - 125k:| Mill Plain: | 19.5% (1,704) |
| Washington: | 9.4% (26,839) |
Number of households with income $125k - 150k:| Mill Plain: | 7.6% (660) |
| State: | 8.5% (24,200) |
Number of households with income $150k - 200k:| Mill Plain: | 18.3% (1,596) |
| State: | 12.6% (35,976) |
Number of households with income > $200k:| Mill Plain: | 14.6% (1,278) |
| State: | 29.2% (83,109) |
Aggregate household income in Mill Plain in 2022: $20,453,882
Median family income in Mill Plain in 2022:| Mill Plain: | $84,447 |
| Washington: | $143,595 |
Number of families with income $20k - 30k:| Mill Plain: | 20.4% (13) |
| State: | 1.9% (3,558) |
Number of families with income $30k - 40k:| Mill Plain: | 11.7% (8) |
| Washington: | 3.1% (5,734) |
Number of families with income $60k - 75k:| Mill Plain: | 12.0% (8) |
| State: | 5.1% (9,490) |
Number of families with income $75k - 100k:| Mill Plain: | 55.9% (36) |
| State: | 11.7% (21,919) |
Median non-family income in Mill Plain in 2022:| Mill Plain: | $148,456 |
| State: | $84,971 |
Median per capita income in Mill Plain in 2022:| Mill Plain: | $46,858 |
| State: | $67,666 |
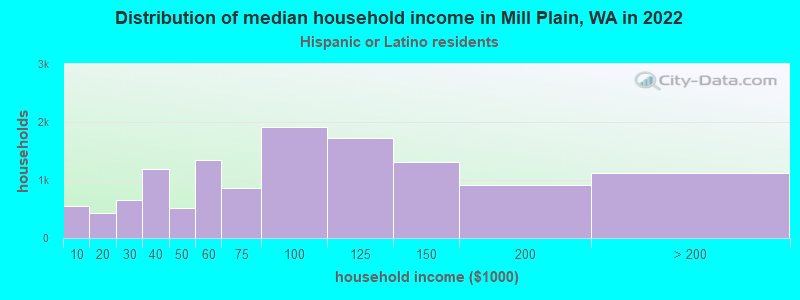
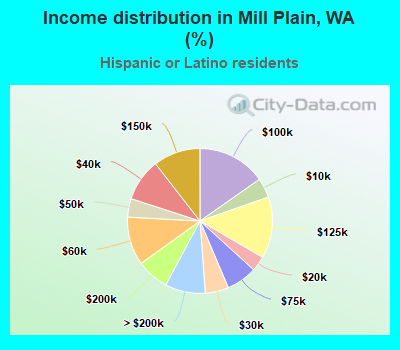
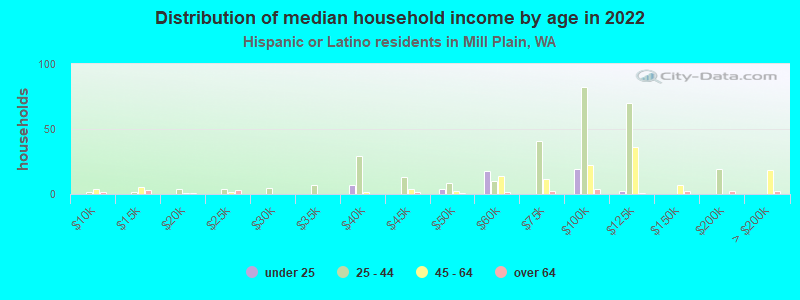
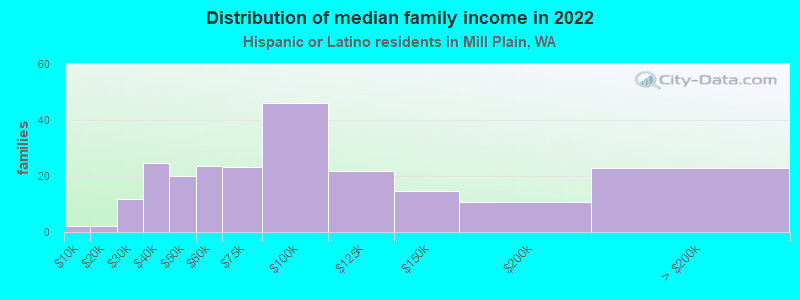
Income statistics for Hispanic or Latino residents
Median household income in Mill Plain, WA in 2022:| Mill Plain: | $68,310 |
| Washington: | $74,770 |
Change in median household income between 2000 and 2022:| Mill Plain, Washington: | +118.6% |
| State: | +128.3% |
Number of households with income < $10k:| Mill Plain: | 4.4% (547) |
| State: | 4.9% (14,456) |
Number of households with income $10k - 20k:| Mill Plain: | 3.4% (423) |
| State: | 5.3% (15,449) |
Number of households with income $20k - 30k:| Mill Plain: | 5.2% (654) |
| State: | 6.8% (20,016) |
Number of households with income $30k - 40k:| Mill Plain: | 9.5% (1,187) |
| State: | 7.7% (22,548) |
Number of households with income $40k - 50k:| Mill Plain: | 4.1% (517) |
| State: | 7.3% (21,450) |
Number of households with income $50k - 60k:| Mill Plain: | 10.8% (1,348) |
| State: | 7.7% (22,744) |
Number of households with income $60k - 75k:| Mill Plain: | 6.9% (858) |
| Washington: | 10.5% (30,737) |
Number of households with income $75k - 100k:| Mill Plain: | 15.3% (1,910) |
| Washington: | 14.9% (43,843) |
Number of households with income $100k - 125k:| Mill Plain: | 13.7% (1,716) |
| State: | 11.1% (32,554) |
Number of households with income $125k - 150k:| Mill Plain: | 10.5% (1,314) |
| Washington: | 7.4% (21,624) |
Number of households with income $150k - 200k:| Mill Plain: | 7.2% (906) |
| State: | 7.3% (21,360) |
Number of households with income > $200k:| Mill Plain: | 9.0% (1,124) |
| State: | 9.2% (27,055) |
Aggregate household income in Mill Plain in 2022: $23,524,418
Median family income in Mill Plain in 2022:| Mill Plain: | $51,417 |
| State: | $76,866 |
Number of families with income < $10k:| Mill Plain: | 1.0% (2) |
| State: | 4.4% (9,443) |
Number of families with income $10k - 20k:| Mill Plain: | 1.0% (2) |
| State: | 3.5% (7,524) |
Number of families with income $20k - 30k:| Mill Plain: | 5.2% (12) |
| State: | 5.6% (12,052) |
Number of families with income $30k - 40k:| Mill Plain: | 11.0% (25) |
| State: | 8.3% (17,803) |
Number of families with income $40k - 50k:| Mill Plain: | 8.9% (20) |
| Washington: | 7.7% (16,361) |
Number of families with income $50k - 60k:| Mill Plain: | 10.5% (24) |
| State: | 7.9% (16,852) |
Number of families with income $60k - 75k:| Mill Plain: | 10.4% (23) |
| Washington: | 11.4% (24,342) |
Number of families with income $75k - 100k:| Mill Plain: | 20.6% (46) |
| State: | 14.4% (30,698) |
Number of families with income $100k - 125k:| Mill Plain: | 9.8% (22) |
| State: | 11.4% (24,331) |
Number of families with income $125k - 150k:| Mill Plain: | 6.5% (15) |
| Washington: | 7.5% (16,099) |
Number of families with income $150k - 200k:| Mill Plain: | 4.8% (11) |
| State: | 8.2% (17,551) |
Number of families with income > $200k:| Mill Plain: | 10.3% (23) |
| Washington: | 9.7% (20,653) |
Median non-family income in Mill Plain in 2022:| Mill Plain: | $170,530 |
| Washington: | $54,173 |
Change in median non-family income between 2000 and 2022:| Mill Plain, Washington: | +99.5% |
| State: | +105.8% |
Median per capita income in Mill Plain in 2022:| Mill Plain: | $25,022 |
| State: | $28,252 |
Change in median per capita income between 2000 and 2022:| Mill Plain, Washington: | +137.1% |
| State: | +150.2% |
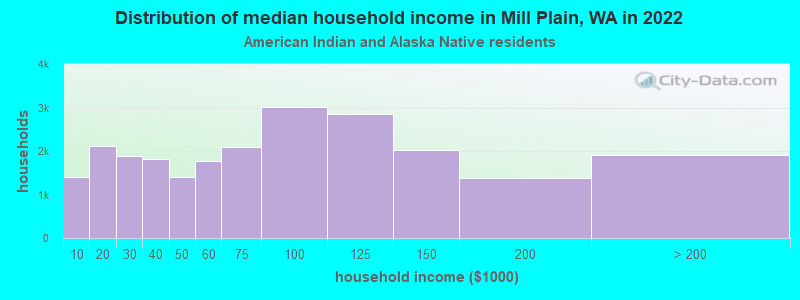
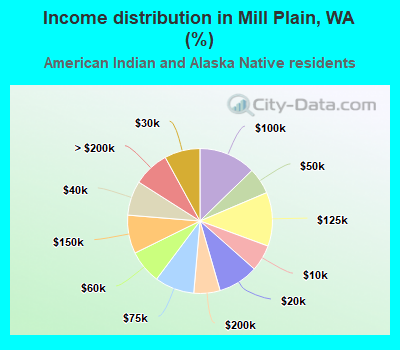
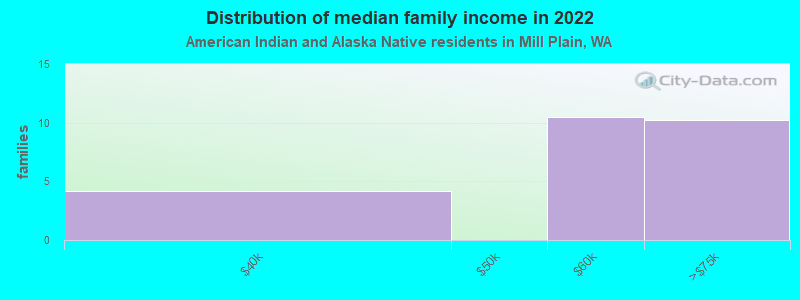
Income statistics for American Indian and Alaska Native residents
Median household income in Mill Plain, WA in 2022:| Mill Plain: | $106,464 |
| State: | $71,255 |
Change in median household income between 2000 and 2022:| Mill Plain, Washington: | +107.7% |
| Washington: | +118.1% |
Number of households with income < $10k:| Mill Plain: | 5.9% (1,393) |
| Washington: | 5.9% (1,768) |
Number of households with income $10k - 20k:| Mill Plain: | 9.0% (2,126) |
| State: | 8.9% (2,694) |
Number of households with income $20k - 30k:| Mill Plain: | 8.0% (1,881) |
| State: | 8.0% (2,412) |
Number of households with income $30k - 40k:| Mill Plain: | 7.7% (1,822) |
| State: | 7.7% (2,327) |
Number of households with income $40k - 50k:| Mill Plain: | 5.9% (1,392) |
| State: | 5.8% (1,755) |
Number of households with income $50k - 60k:| Mill Plain: | 7.5% (1,771) |
| State: | 7.5% (2,259) |
Number of households with income $60k - 75k:| Mill Plain: | 8.8% (2,089) |
| State: | 8.8% (2,669) |
Number of households with income $75k - 100k:| Mill Plain: | 12.7% (3,011) |
| State: | 12.8% (3,861) |
Number of households with income $100k - 125k:| Mill Plain: | 12.0% (2,842) |
| State: | 12.0% (3,618) |
Number of households with income $125k - 150k:| Mill Plain: | 8.6% (2,030) |
| State: | 8.6% (2,580) |
Number of households with income $150k - 200k:| Mill Plain: | 5.9% (1,388) |
| State: | 5.9% (1,774) |
Number of households with income > $200k:| Mill Plain: | 8.0% (1,900) |
| State: | 8.1% (2,447) |
Aggregate household income in Mill Plain in 2022: $2,619,854
Median family income in Mill Plain in 2022:| Mill Plain: | $85,312 |
| Washington: | $79,010 |
Number of families with income $30k - 40k:| Mill Plain: | 16.8% (4) |
| Washington: | 5.9% (1,190) |
Number of families with income $50k - 60k:| Mill Plain: | 42.0% (10) |
| Washington: | 9.7% (1,973) |
Number of families with income $60k - 75k:| Mill Plain: | 41.1% (10) |
| State: | 10.5% (2,124) |
Median per capita income in Mill Plain in 2022:| Mill Plain: | $41,641 |
| Washington: | $27,053 |
Change in median per capita income between 2000 and 2022:| Mill Plain, Washington: | +89.4% |
| State: | +98.6% |
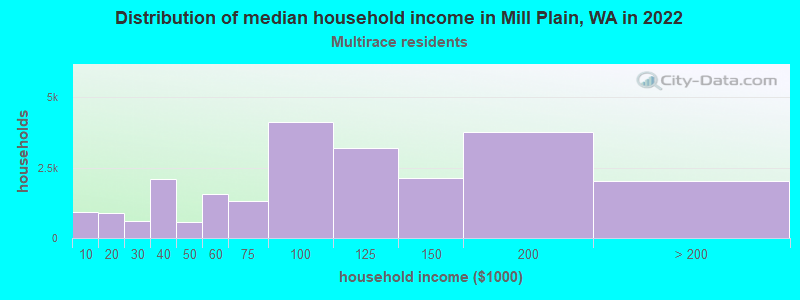
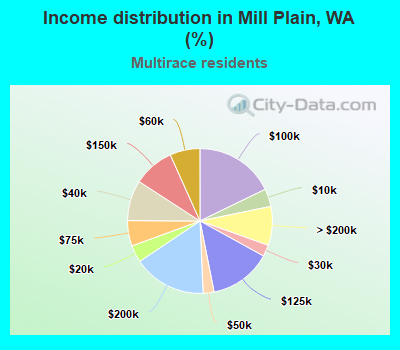
Income statistics for Multirace residents
Median household income in Mill Plain, WA in 2022:| Mill Plain: | $118,449 |
| State: | $84,303 |
Change in median household income between 2000 and 2022:| Mill Plain, Washington: | +150.0% |
| State: | +125.7% |
Number of households with income < $10k:| Mill Plain: | 4.0% (920) |
| State: | 4.3% (12,040) |
Number of households with income $10k - 20k:| Mill Plain: | 3.8% (882) |
| Washington: | 6.6% (18,437) |
Number of households with income $20k - 30k:| Mill Plain: | 2.6% (598) |
| State: | 5.2% (14,559) |
Number of households with income $30k - 40k:| Mill Plain: | 9.1% (2,096) |
| State: | 6.7% (18,491) |
Number of households with income $40k - 50k:| Mill Plain: | 2.4% (565) |
| State: | 6.3% (17,459) |
Number of households with income $50k - 60k:| Mill Plain: | 6.7% (1,553) |
| State: | 6.9% (19,086) |
Number of households with income $60k - 75k:| Mill Plain: | 5.7% (1,316) |
| State: | 9.1% (25,310) |
Number of households with income $75k - 100k:| Mill Plain: | 17.8% (4,119) |
| Washington: | 13.5% (37,493) |
Number of households with income $100k - 125k:| Mill Plain: | 13.8% (3,203) |
| Washington: | 10.7% (29,626) |
Number of households with income $125k - 150k:| Mill Plain: | 9.1% (2,113) |
| State: | 8.6% (23,899) |
Number of households with income $150k - 200k:| Mill Plain: | 16.3% (3,766) |
| Washington: | 10.2% (28,214) |
Number of households with income > $200k:| Mill Plain: | 8.7% (2,009) |
| State: | 11.9% (32,947) |
Aggregate household income in Mill Plain in 2022: $29,965,722
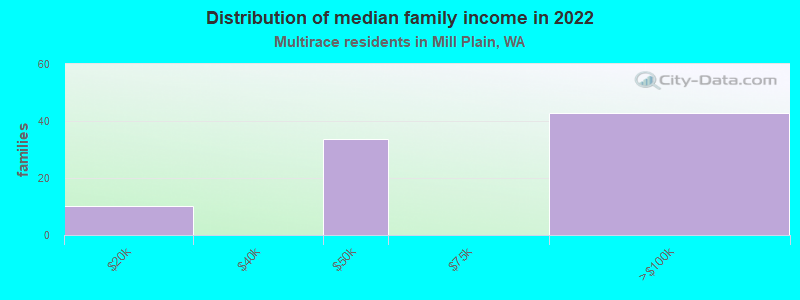
Median family income in Mill Plain in 2022:| Mill Plain: | $113,298 |
| State: | $95,629 |
Number of families with income $10k - 20k:| Mill Plain: | 11.7% (10) |
| Washington: | 4.3% (7,519) |
Number of families with income $40k - 50k:| Mill Plain: | 38.9% (34) |
| State: | 5.9% (10,412) |
Number of families with income $75k - 100k:| Mill Plain: | 49.4% (43) |
| State: | 13.6% (23,984) |
Median non-family income in Mill Plain in 2022:| Mill Plain: | $228,291 |
| State: | $56,573 |
Median per capita income in Mill Plain in 2022:| Mill Plain: | $26,338 |
| State: | $32,496 |
Change in median per capita income between 2000 and 2022:| Mill Plain, Washington: | +146.5% |
| State: | +156.8% |
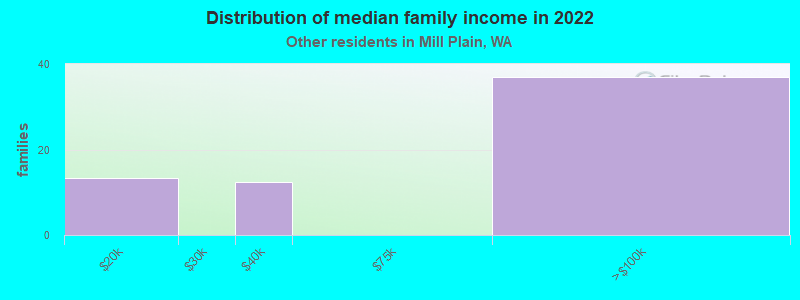
Income statistics for other residents
Number of households with income < $10k:| Mill Plain: | 3.2% (2) |
| State: | 5.3% (6,540) |
Number of households with income $10k - 20k:| Mill Plain: | 6.3% (4) |
| State: | 6.0% (7,385) |
Number of households with income $20k - 30k:| Mill Plain: | 9.5% (6) |
| State: | 7.5% (9,289) |
Number of households with income $30k - 40k:| Mill Plain: | 11.1% (7) |
| State: | 8.9% (11,015) |
Number of households with income $40k - 50k:| Mill Plain: | 9.5% (6) |
| State: | 7.6% (9,399) |
Number of households with income $50k - 60k:| Mill Plain: | 7.9% (5) |
| State: | 7.2% (8,867) |
Number of households with income $60k - 75k:| Mill Plain: | 9.5% (6) |
| Washington: | 10.5% (13,032) |
Number of households with income $75k - 100k:| Mill Plain: | 12.7% (8) |
| State: | 14.6% (18,007) |
Number of households with income $100k - 125k:| Mill Plain: | 12.7% (8) |
| State: | 12.2% (15,128) |
Number of households with income $125k - 150k:| Mill Plain: | 4.8% (3) |
| State: | 5.6% (6,950) |
Number of households with income $150k - 200k:| Mill Plain: | 6.3% (4) |
| State: | 7.1% (8,749) |
Number of households with income > $200k:| Mill Plain: | 6.3% (4) |
| State: | 7.5% (9,208) |
Aggregate household income in Mill Plain in 2022: $6,668,691
Median family income in Mill Plain in 2022:| Mill Plain: | $38,203 |
| Washington: | $72,588 |
Number of families with income $10k - 20k:| Mill Plain: | 21.1% (13) |
| Washington: | 4.0% (3,814) |
Number of families with income $30k - 40k:| Mill Plain: | 19.7% (12) |
| Washington: | 9.2% (8,827) |
Number of families with income $75k - 100k:| Mill Plain: | 59.2% (37) |
| Washington: | 14.5% (13,800) |
Median per capita income in Mill Plain in 2022:| Mill Plain: | $28,330 |
| State: | $27,542 |