Millbury, Massachusetts (MA) income map, earnings map, and wages data
The median household income in Millbury, MA in 2022 was $92,638, which was about the same as the median annual income of $94,488 across the entire state of Massachusetts. Compared to the median income of $51,415 in 2000 this represents an increase of 44.5%. The per capita income in 2022 was $45,880, which means an increase of 48.7% compared to 2000 when it was $23,531.
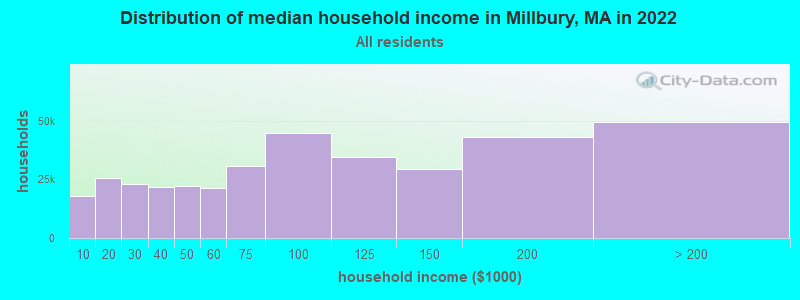
Income statistics for all residents
Median household income in Millbury, MA in 2022:| Millbury: | $92,638 |
| State: | $94,488 |
Change in median household income between 2000 and 2022:| Millbury, Massachusetts: | +80.2% |
| State: | +87.1% |
Number of households with income < $10k:| Millbury: | 4.9% (17,820) |
| State: | 5.2% (146,170) |
Number of households with income $10k - 20k:| Millbury: | 7.0% (25,425) |
| Massachusetts: | 6.4% (180,001) |
Number of households with income $20k - 30k:| Millbury: | 6.4% (23,155) |
| Massachusetts: | 5.6% (156,667) |
Number of households with income $30k - 40k:| Millbury: | 5.9% (21,552) |
| State: | 5.6% (157,168) |
Number of households with income $40k - 50k:| Millbury: | 6.1% (22,070) |
| State: | 5.4% (151,455) |
Number of households with income $50k - 60k:| Millbury: | 5.8% (21,131) |
| State: | 5.1% (142,726) |
Number of households with income $60k - 75k:| Millbury: | 8.4% (30,665) |
| State: | 7.6% (212,203) |
Number of households with income $75k - 100k:| Millbury: | 12.3% (44,601) |
| Massachusetts: | 11.3% (317,064) |
Number of households with income $100k - 125k:| Millbury: | 9.5% (34,619) |
| Massachusetts: | 9.7% (270,603) |
Number of households with income $125k - 150k:| Millbury: | 8.1% (29,582) |
| State: | 8.0% (223,140) |
Number of households with income $150k - 200k:| Millbury: | 11.9% (43,085) |
| Massachusetts: | 11.0% (308,695) |
Number of households with income > $200k:| Millbury: | 13.6% (49,386) |
| State: | 19.0% (531,884) |
Aggregate household income in Millbury in 2022: $5,287,976,349
Median family income in Millbury in 2022:| Millbury: | $115,119 |
| Massachusetts: | $120,263 |
Median non-family income in Millbury in 2022:| Millbury: | $46,129 |
| Massachusetts: | $55,979 |
Change in median non-family income between 2000 and 2022:| Millbury, Massachusetts: | +85.7% |
| State: | +88.0% |
Median per capita income in Millbury in 2022:| Millbury: | $45,880 |
| Massachusetts: | $54,025 |
Change in median per capita income between 2000 and 2022:| Millbury, Massachusetts: | +95.0% |
| Massachusetts: | +108.2% |
Income statistics for White residents
Median household income in Millbury, MA in 2022:| Millbury: | $94,964 |
| Massachusetts: | $101,391 |
Change in median household income between 2000 and 2022:| Millbury, Massachusetts: | +85.1% |
| Massachusetts: | +93.3% |
Number of households with income < $10k:| Millbury: | 4.6% (12,684) |
| Massachusetts: | 4.4% (91,120) |
Number of households with income $10k - 20k:| Millbury: | 6.5% (18,137) |
| Massachusetts: | 5.9% (122,055) |
Number of households with income $20k - 30k:| Millbury: | 6.1% (16,818) |
| State: | 5.1% (105,311) |
Number of households with income $30k - 40k:| Millbury: | 5.5% (15,176) |
| State: | 5.3% (110,239) |
Number of households with income $40k - 50k:| Millbury: | 5.6% (15,538) |
| State: | 5.0% (104,636) |
Number of households with income $50k - 60k:| Millbury: | 5.4% (15,067) |
| State: | 4.8% (99,486) |
Number of households with income $60k - 75k:| Millbury: | 8.4% (23,333) |
| State: | 7.5% (155,124) |
Number of households with income $75k - 100k:| Millbury: | 12.2% (33,909) |
| State: | 11.4% (236,252) |
Number of households with income $100k - 125k:| Millbury: | 10.1% (28,178) |
| State: | 9.9% (204,731) |
Number of households with income $125k - 150k:| Millbury: | 8.4% (23,238) |
| Massachusetts: | 8.5% (175,324) |
Number of households with income $150k - 200k:| Millbury: | 12.5% (34,620) |
| State: | 11.7% (242,980) |
Number of households with income > $200k:| Millbury: | 14.7% (40,948) |
| State: | 20.5% (425,966) |
Aggregate household income in Millbury in 2022: $4,281,853,375
Median family income in Millbury in 2022:| Millbury: | $119,922 |
| State: | $133,153 |
Number of families with income < $10k:| Millbury: | 1.3% (37) |
| State: | 2.0% (25,038) |
Number of families with income $10k - 20k:| Millbury: | 3.0% (83) |
| State: | 2.1% (26,403) |
Number of families with income $20k - 30k:| Millbury: | 4.2% (117) |
| State: | 2.6% (32,525) |
Number of families with income $30k - 40k:| Millbury: | 5.2% (147) |
| State: | 3.9% (48,079) |
Number of families with income $40k - 50k:| Millbury: | 4.9% (136) |
| State: | 3.8% (46,908) |
Number of families with income $50k - 60k:| Millbury: | 5.1% (142) |
| Massachusetts: | 3.8% (46,476) |
Number of families with income $60k - 75k:| Millbury: | 9.5% (265) |
| State: | 6.4% (79,040) |
Number of families with income $75k - 100k:| Millbury: | 17.8% (498) |
| State: | 11.1% (137,395) |
Number of families with income $100k - 125k:| Millbury: | 14.4% (404) |
| Massachusetts: | 11.1% (136,771) |
Number of families with income $125k - 150k:| Millbury: | 9.2% (258) |
| State: | 10.0% (123,709) |
Number of families with income $150k - 200k:| Millbury: | 12.8% (360) |
| Massachusetts: | 14.7% (181,602) |
Number of families with income > $200k:| Millbury: | 12.7% (355) |
| State: | 28.5% (351,887) |
Median non-family income in Millbury in 2022:| Millbury: | $47,730 |
| Massachusetts: | $59,323 |
Change in median non-family income between 2000 and 2022:| Millbury, Massachusetts: | +92.0% |
| State: | +94.3% |
Median per capita income in Millbury in 2022:| Millbury: | $48,331 |
| State: | $60,804 |
Change in median per capita income between 2000 and 2022:| Millbury, Massachusetts: | +105.3% |
| State: | +118.7% |
Income statistics for Black or African American residents
Number of households with income < $10k:| Millbury: | 7.3% (369) |
| Massachusetts: | 9.1% (15,797) |
Number of households with income $10k - 20k:| Millbury: | 11.9% (603) |
| State: | 9.4% (16,267) |
Number of households with income $20k - 30k:| Millbury: | 9.8% (497) |
| State: | 7.8% (13,520) |
Number of households with income $30k - 40k:| Millbury: | 3.3% (165) |
| State: | 8.3% (14,412) |
Number of households with income $40k - 50k:| Millbury: | 13.5% (683) |
| Massachusetts: | 7.9% (13,790) |
Number of households with income $50k - 60k:| Millbury: | 5.8% (292) |
| State: | 5.8% (10,041) |
Number of households with income $60k - 75k:| Millbury: | 10.7% (543) |
| State: | 8.5% (14,822) |
Number of households with income $75k - 100k:| Millbury: | 13.0% (660) |
| State: | 11.0% (19,122) |
Number of households with income $100k - 125k:| Millbury: | 7.5% (381) |
| Massachusetts: | 8.4% (14,575) |
Number of households with income $125k - 150k:| Millbury: | 5.0% (252) |
| State: | 6.0% (10,429) |
Number of households with income $150k - 200k:| Millbury: | 7.3% (367) |
| State: | 7.2% (12,539) |
Number of households with income > $200k:| Millbury: | 4.9% (250) |
| State: | 10.5% (18,185) |
Median per capita income in Millbury in 2022:| Millbury: | $9,250 |
| Massachusetts: | $33,524 |
Change in median per capita income between 2000 and 2022:| Millbury, Massachusetts: | +95.7% |
| State: | +109.4% |
Income statistics for Asian residents
Median household income in Millbury, MA in 2022:| Millbury: | $276,302 |
| State: | $117,855 |
Change in median household income between 2000 and 2022:| Millbury, Massachusetts: | +149.6% |
| State: | +129.9% |
Number of households with income < $10k:| Millbury: | 5.7% (1,752) |
| State: | 6.8% (11,982) |
Number of households with income $10k - 20k:| Millbury: | 5.8% (1,761) |
| Massachusetts: | 4.8% (8,376) |
Number of households with income $20k - 30k:| Millbury: | 1.9% (582) |
| Massachusetts: | 3.7% (6,558) |
Number of households with income $30k - 40k:| Millbury: | 3.5% (1,083) |
| Massachusetts: | 3.3% (5,748) |
Number of households with income $40k - 50k:| Millbury: | 4.9% (1,505) |
| State: | 4.1% (7,192) |
Number of households with income $50k - 60k:| Millbury: | 3.5% (1,070) |
| Massachusetts: | 5.0% (8,734) |
Number of households with income $60k - 75k:| Millbury: | 4.3% (1,326) |
| State: | 5.8% (10,203) |
Number of households with income $75k - 100k:| Millbury: | 6.1% (1,862) |
| Massachusetts: | 8.6% (15,154) |
Number of households with income $100k - 125k:| Millbury: | 9.7% (2,979) |
| Massachusetts: | 10.8% (18,942) |
Number of households with income $125k - 150k:| Millbury: | 8.1% (2,467) |
| Massachusetts: | 8.0% (14,037) |
Number of households with income $150k - 200k:| Millbury: | 21.1% (6,446) |
| State: | 12.5% (21,856) |
Number of households with income > $200k:| Millbury: | 25.4% (7,757) |
| Massachusetts: | 26.6% (46,694) |
Aggregate household income in Millbury in 2022: $20,349,175
Median family income in Millbury in 2022:| Millbury: | $296,542 |
| State: | $140,113 |
Number of families with income < $10k:| Millbury: | 14.1% (12) |
| Massachusetts: | 3.2% (3,752) |
Number of families with income $75k - 100k:| Millbury: | 4.4% (4) |
| State: | 8.5% (10,022) |
Number of families with income $100k - 125k:| Millbury: | 25.0% (22) |
| Massachusetts: | 10.0% (11,697) |
Number of families with income $125k - 150k:| Millbury: | 56.5% (49) |
| Massachusetts: | 8.6% (10,071) |
Median per capita income in Millbury in 2022:| Millbury: | $76,329 |
| State: | $58,900 |
Income statistics for Hispanic or Latino residents
Median household income in Millbury, MA in 2022:| Millbury: | $146,979 |
| Massachusetts: | $61,523 |
Change in median household income between 2000 and 2022:| Millbury, Massachusetts: | +116.0% |
| State: | +125.4% |
Number of households with income < $10k:| Millbury: | 8.1% (7,522) |
| State: | 8.8% (25,307) |
Number of households with income $10k - 20k:| Millbury: | 10.5% (9,674) |
| Massachusetts: | 10.0% (28,653) |
Number of households with income $20k - 30k:| Millbury: | 10.3% (9,567) |
| State: | 8.8% (25,189) |
Number of households with income $30k - 40k:| Millbury: | 9.5% (8,801) |
| State: | 7.2% (20,822) |
Number of households with income $40k - 50k:| Millbury: | 7.1% (6,581) |
| State: | 7.2% (20,817) |
Number of households with income $50k - 60k:| Millbury: | 8.0% (7,391) |
| Massachusetts: | 6.5% (18,748) |
Number of households with income $60k - 75k:| Millbury: | 11.1% (10,242) |
| State: | 8.8% (25,390) |
Number of households with income $75k - 100k:| Millbury: | 14.1% (13,032) |
| Massachusetts: | 12.0% (34,488) |
Number of households with income $100k - 125k:| Millbury: | 5.7% (5,261) |
| State: | 8.6% (24,599) |
Number of households with income $125k - 150k:| Millbury: | 8.8% (8,171) |
| State: | 6.2% (17,743) |
Number of households with income $150k - 200k:| Millbury: | 3.6% (3,285) |
| Massachusetts: | 7.3% (21,017) |
Number of households with income > $200k:| Millbury: | 3.2% (2,945) |
| State: | 8.6% (24,606) |
Aggregate household income in Millbury in 2022: $6,157,851
Median family income in Millbury in 2022:| Millbury: | $146,799 |
| State: | $66,072 |
Number of families with income < $10k:| Millbury: | 5.2% (23) |
| Massachusetts: | 6.2% (12,456) |
Number of families with income $10k - 20k:| Millbury: | 5.1% (23) |
| State: | 6.0% (12,071) |
Number of families with income $20k - 30k:| Millbury: | 11.7% (53) |
| Massachusetts: | 10.1% (20,376) |
Number of families with income $30k - 40k:| Millbury: | 10.4% (47) |
| State: | 8.2% (16,470) |
Number of families with income $40k - 50k:| Millbury: | 11.4% (51) |
| State: | 7.4% (14,829) |
Number of families with income $50k - 60k:| Millbury: | 10.6% (48) |
| Massachusetts: | 7.3% (14,643) |
Number of families with income $60k - 75k:| Millbury: | 10.0% (45) |
| Massachusetts: | 10.6% (21,252) |
Number of families with income $75k - 100k:| Millbury: | 16.6% (75) |
| State: | 12.0% (24,088) |
Number of families with income $100k - 125k:| Millbury: | 5.8% (26) |
| Massachusetts: | 8.9% (17,954) |
Number of families with income $125k - 150k:| Millbury: | 8.5% (38) |
| State: | 6.9% (13,837) |
Number of families with income $150k - 200k:| Millbury: | 2.5% (11) |
| State: | 7.3% (14,683) |
Number of families with income > $200k:| Millbury: | 2.3% (10) |
| State: | 9.3% (18,741) |
Median per capita income in Millbury in 2022:| Millbury: | $43,526 |
| Massachusetts: | $28,993 |
Change in median per capita income between 2000 and 2022:| Millbury, Massachusetts: | +110.9% |
| State: | +142.4% |
Income statistics for American Indian and Alaska Native residents
Median household income in Millbury, MA in 2022:| Millbury: | $36,755 |
| State: | $87,730 |
Number of households with income < $10k:| Millbury: | 6.6% (138) |
| State: | 6.6% (451) |
Number of households with income $10k - 20k:| Millbury: | 7.0% (146) |
| Massachusetts: | 7.0% (476) |
Number of households with income $20k - 30k:| Millbury: | 2.8% (59) |
| State: | 2.8% (192) |
Number of households with income $30k - 40k:| Millbury: | 3.2% (67) |
| State: | 3.2% (218) |
Number of households with income $40k - 50k:| Millbury: | 2.9% (61) |
| Massachusetts: | 2.9% (199) |
Number of households with income $50k - 60k:| Millbury: | 9.9% (207) |
| State: | 9.9% (677) |
Number of households with income $60k - 75k:| Millbury: | 11.5% (239) |
| State: | 11.5% (781) |
Number of households with income $75k - 100k:| Millbury: | 9.2% (192) |
| State: | 9.2% (629) |
Number of households with income $100k - 125k:| Millbury: | 6.0% (124) |
| State: | 6.0% (406) |
Number of households with income $125k - 150k:| Millbury: | 13.5% (281) |
| State: | 13.5% (921) |
Number of households with income $150k - 200k:| Millbury: | 12.6% (263) |
| State: | 12.6% (859) |
Number of households with income > $200k:| Millbury: | 14.7% (307) |
| State: | 14.7% (1,003) |
Aggregate household income in Millbury in 2022: $309,218
Median per capita income in Millbury in 2022:| Millbury: | $18,560 |
| State: | $39,434 |
Change in median per capita income between 2000 and 2022:| Millbury, Massachusetts: | +80.0% |
| Massachusetts: | +148.2% |
Income statistics for Multirace residents
Median household income in Millbury, MA in 2022:| Millbury: | $231,690 |
| State: | $71,552 |
Change in median household income between 2000 and 2022:| Millbury, Massachusetts: | +84.7% |
| State: | +109.0% |
Number of households with income < $10k:| Millbury: | 7.4% (8,628) |
| Massachusetts: | 6.6% (15,127) |
Number of households with income $10k - 20k:| Millbury: | 10.3% (11,991) |
| State: | 9.2% (21,158) |
Number of households with income $20k - 30k:| Millbury: | 10.2% (11,852) |
| State: | 7.8% (18,016) |
Number of households with income $30k - 40k:| Millbury: | 11.3% (13,120) |
| State: | 7.9% (18,260) |
Number of households with income $40k - 50k:| Millbury: | 6.2% (7,195) |
| State: | 5.6% (13,027) |
Number of households with income $50k - 60k:| Millbury: | 8.7% (10,133) |
| State: | 5.6% (12,909) |
Number of households with income $60k - 75k:| Millbury: | 8.2% (9,477) |
| State: | 9.0% (20,800) |
Number of households with income $75k - 100k:| Millbury: | 13.5% (15,663) |
| Massachusetts: | 12.1% (27,875) |
Number of households with income $100k - 125k:| Millbury: | 6.2% (7,166) |
| Massachusetts: | 8.1% (18,754) |
Number of households with income $125k - 150k:| Millbury: | 6.4% (7,456) |
| State: | 6.8% (15,621) |
Number of households with income $150k - 200k:| Millbury: | 5.9% (6,880) |
| State: | 9.4% (21,618) |
Number of households with income > $200k:| Millbury: | 5.6% (6,468) |
| Massachusetts: | 12.0% (27,592) |
Aggregate household income in Millbury in 2022: $17,005,564
Median family income in Millbury in 2022:| Millbury: | $185,036 |
| Massachusetts: | $78,380 |
Number of families with income $100k - 125k:| Millbury: | 100.0% (60) |
| State: | 7.9% (12,321) |
Median non-family income in Millbury in 2022:| Millbury: | $57,994 |
| State: | $42,253 |
Change in median non-family income between 2000 and 2022:| Millbury, Massachusetts: | +60.0% |
| State: | +93.7% |
Median per capita income in Millbury in 2022:| Millbury: | $58,960 |
| State: | $34,029 |
Change in median per capita income between 2000 and 2022:| Millbury, Massachusetts: | +104.0% |
| State: | +132.1% |
Income statistics for other residents
Number of households with income < $10k:| Millbury: | 2.7% (1) |
| State: | 8.4% (11,559) |
Number of households with income $10k - 20k:| Millbury: | 5.4% (2) |
| State: | 8.4% (11,499) |
Number of households with income $20k - 30k:| Millbury: | 5.4% (2) |
| State: | 9.5% (13,070) |
Number of households with income $30k - 40k:| Millbury: | 10.8% (4) |
| Massachusetts: | 6.0% (8,291) |
Number of households with income $40k - 50k:| Millbury: | 10.8% (4) |
| State: | 9.2% (12,611) |
Number of households with income $50k - 60k:| Millbury: | 8.1% (3) |
| State: | 7.9% (10,879) |
Number of households with income $60k - 75k:| Millbury: | 10.8% (4) |
| State: | 7.5% (10,239) |
Number of households with income $75k - 100k:| Millbury: | 18.9% (7) |
| Massachusetts: | 13.1% (18,032) |
Number of households with income $100k - 125k:| Millbury: | 5.4% (2) |
| State: | 9.6% (13,141) |
Number of households with income $125k - 150k:| Millbury: | 8.1% (3) |
| State: | 5.0% (6,808) |
Number of households with income $150k - 200k:| Millbury: | 8.1% (3) |
| Massachusetts: | 6.4% (8,843) |
Number of households with income > $200k:| Millbury: | 5.4% (2) |
| Massachusetts: | 9.0% (12,396) |
Aggregate household income in Millbury in 2022: $3,208,744
Median family income in Millbury in 2022:| Millbury: | $193,869 |
| State: | $66,840 |
Number of families with income $10k - 20k:| Millbury: | 11.2% (4) |
| Massachusetts: | 4.7% (4,798) |
Number of families with income $60k - 75k:| Millbury: | 88.8% (28) |
| State: | 8.5% (8,683) |
Median per capita income in Millbury in 2022:| Millbury: | $51,056 |
| Massachusetts: | $30,797 |