The median household income in Millwood, WA in 2022 was $68,990, which was 32.3% less than the median annual income of $91,306 across the entire state of Washington. Compared to the median income of $34,565 in 2000 this represents an increase of 49.9%. The per capita income in 2022 was $42,012, which means an increase of 57.4% compared to 2000 when it was $17,911.
Whole page based on the data from 2000 / 2022 when the population of Millwood, Washington was 1,649 / 1,969
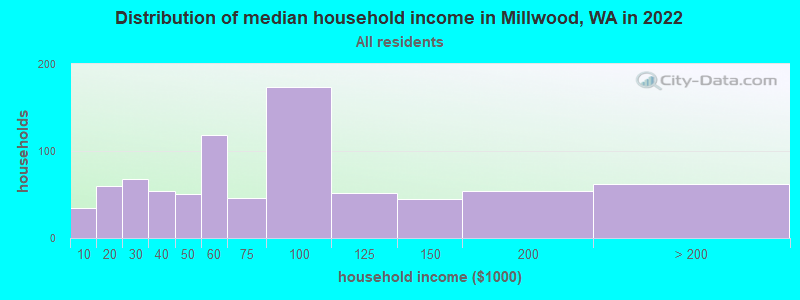
Income statistics for all residents
Median household income in Millwood, WA in 2022:
Millwood:
$68,991
State:
$91,306
Change in median household income between 2000 and 2022:
Millwood, Washington:
+99.6%
Washington:
+99.5%
Number of households with income < $10k:
Millwood:
4.3% (35)
State:
4.5% (139,331)
Number of households with income $10k - 20k:
Millwood:
7.3% (60)
Washington:
5.0% (154,508)
Number of households with income $20k - 30k:
Millwood:
8.3% (68)
Washington:
5.4% (166,555)
Number of households with income $30k - 40k:
Millwood:
6.6% (54)
State:
5.5% (170,324)
Number of households with income $40k - 50k:
Millwood:
6.2% (51)
State:
6.0% (183,941)
Number of households with income $50k - 60k:
Millwood:
14.4% (118)
State:
6.1% (187,395)
Number of households with income $60k - 75k:
Millwood:
5.6% (46)
State:
8.7% (266,771)
Number of households with income $75k - 100k:
Millwood:
21.1% (173)
State:
13.1% (404,672)
Number of households with income $100k - 125k:
Millwood:
6.4% (52)
State:
11.0% (337,911)
Number of households with income $125k - 150k:
Millwood:
5.5% (45)
State:
8.0% (244,934)
Number of households with income $150k - 200k:
Millwood:
6.6% (54)
State:
10.5% (323,812)
Number of households with income > $200k:
Millwood:
7.6% (62)
State:
16.2% (499,799)
Aggregate household income in Millwood in 2022: $78,217,280
Median family income in Millwood in 2022:
Millwood:
$94,562
State:
$109,192
Number of families with income < $10k:
Millwood:
1.4% (7)
State:
2.9% (55,953)
Number of families with income $10k - 20k:
Millwood:
4.9% (23)
State:
2.6% (50,138)
Number of families with income $20k - 30k:
Millwood:
2.6% (12)
Washington:
3.2% (61,974)
Number of families with income $30k - 40k:
Millwood:
6.2% (29)
State:
4.1% (80,240)
Number of families with income $40k - 50k:
Millwood:
6.6% (31)
Washington:
4.9% (94,310)
Number of families with income $50k - 60k:
Millwood:
8.9% (41)
State:
5.3% (101,674)
Number of families with income $60k - 75k:
Millwood:
5.2% (24)
Washington:
8.2% (158,348)
Number of families with income $75k - 100k:
Millwood:
26.3% (123)
Washington:
13.8% (267,812)
Number of families with income $100k - 125k:
Millwood:
6.9% (32)
State:
12.4% (240,213)
Number of families with income $125k - 150k:
Millwood:
9.2% (43)
State:
9.3% (180,011)
Number of families with income $150k - 200k:
Millwood:
10.5% (49)
State:
13.0% (250,874)
Number of families with income > $200k:
Millwood:
11.4% (53)
State:
20.4% (393,898)
Median non-family income in Millwood in 2022:
Millwood:
$45,379
State:
$57,299
Change in median non-family income between 2000 and 2022:
Millwood, Washington:
+95.5%
State:
+94.9%
Median per capita income in Millwood in 2022:
Millwood:
$42,013
Washington:
$50,764
Change in median per capita income between 2000 and 2022:
Millwood, Washington:
+134.6%
State:
+121.0%
Income statistics for White residents
Median household income in Millwood, WA in 2022:
Millwood:
$72,994
State:
$91,916
Change in median household income between 2000 and 2022:
Millwood, Washington:
+109.9%
State:
+95.4%
Number of households with income < $10k:
Millwood:
4.9% (37)
State:
4.3% (95,850)
Number of households with income $10k - 20k:
Millwood:
6.1% (46)
Washington:
4.8% (106,421)
Number of households with income $20k - 30k:
Millwood:
8.8% (66)
State:
5.5% (122,860)
Number of households with income $30k - 40k:
Millwood:
6.1% (46)
State:
5.4% (119,627)
Number of households with income $40k - 50k:
Millwood:
5.0% (38)
Washington:
5.9% (132,276)
Number of households with income $50k - 60k:
Millwood:
15.0% (113)
State:
6.1% (136,212)
Number of households with income $60k - 75k:
Millwood:
6.1% (46)
State:
8.8% (196,086)
Number of households with income $75k - 100k:
Millwood:
21.1% (159)
Washington:
13.4% (299,192)
Number of households with income $100k - 125k:
Millwood:
6.5% (49)
State:
11.3% (252,209)
Number of households with income $125k - 150k:
Millwood:
5.7% (43)
State:
7.9% (175,962)
Number of households with income $150k - 200k:
Millwood:
6.8% (51)
State:
10.7% (239,156)
Number of households with income > $200k:
Millwood:
8.0% (60)
State:
16.1% (359,917)
Aggregate household income in Millwood in 2022: $73,977,353
Median family income in Millwood in 2022:
Millwood:
$95,171
State:
$112,511
Number of families with income < $10k:
Millwood:
1.6% (7)
State:
2.4% (33,676)
Number of families with income $10k - 20k:
Millwood:
3.6% (16)
State:
2.0% (28,228)
Number of families with income $20k - 30k:
Millwood:
2.6% (11)
State:
2.9% (39,288)
Number of families with income $30k - 40k:
Millwood:
6.8% (29)
State:
3.6% (50,190)
Number of families with income $40k - 50k:
Millwood:
4.6% (20)
Washington:
4.6% (63,009)
Number of families with income $50k - 60k:
Millwood:
9.6% (41)
State:
5.0% (69,270)
Number of families with income $60k - 75k:
Millwood:
5.7% (25)
Washington:
8.2% (112,369)
Number of families with income $75k - 100k:
Millwood:
25.5% (110)
State:
14.1% (194,214)
Number of families with income $100k - 125k:
Millwood:
7.2% (31)
State:
13.2% (182,184)
Number of families with income $125k - 150k:
Millwood:
9.7% (42)
State:
9.5% (130,928)
Number of families with income $150k - 200k:
Millwood:
10.8% (47)
State:
13.7% (188,621)
Number of families with income > $200k:
Millwood:
12.3% (53)
State:
20.8% (285,982)
Median non-family income in Millwood in 2022:
Millwood:
$46,543
Washington:
$56,103
Change in median non-family income between 2000 and 2022:
Millwood, Washington:
+99.7%
Washington:
+87.7%
Median per capita income in Millwood in 2022:
Millwood:
$45,033
State:
$55,212
Change in median per capita income between 2000 and 2022:
Millwood, Washington:
+147.0%
State:
+123.8%
Income statistics for Black or African American residents
Aggregate household income in Millwood in 2022: $54,424
Median per capita income in Millwood in 2022:
Millwood:
$46,883
State:
$38,209
Income statistics for Asian residents
Aggregate household income in Millwood in 2022: $2,598,627
Median per capita income in Millwood in 2022:
Millwood:
$32,086
Washington:
$67,666
Income statistics for Hispanic or Latino residents
Number of households with income < $10k:
Millwood:
0.0% (0)
Washington:
4.9% (14,456)
Number of households with income $10k - 20k:
Millwood:
28.6% (6)
State:
5.3% (15,449)
Number of households with income $20k - 30k:
Millwood:
0.0% (0)
State:
6.8% (20,016)
Number of households with income $30k - 40k:
Millwood:
0.0% (0)
State:
7.7% (22,548)
Number of households with income $40k - 50k:
Millwood:
28.6% (6)
State:
7.3% (21,450)
Number of households with income $50k - 60k:
Millwood:
0.0% (0)
State:
7.7% (22,744)
Number of households with income $60k - 75k:
Millwood:
0.0% (0)
State:
10.5% (30,737)
Number of households with income $75k - 100k:
Millwood:
19.0% (4)
State:
14.9% (43,843)
Number of households with income $100k - 125k:
Millwood:
0.0% (0)
Washington:
11.1% (32,554)
Number of households with income $125k - 150k:
Millwood:
0.0% (0)
State:
7.4% (21,624)
Number of households with income $150k - 200k:
Millwood:
9.5% (2)
State:
7.3% (21,360)
Number of households with income > $200k:
Millwood:
14.3% (3)
Washington:
9.2% (27,055)
Aggregate household income in Millwood in 2022: $1,940,270
Median per capita income in Millwood in 2022:
Millwood:
$14,610
State:
$28,252
Income statistics for American Indian and Alaska Native residents
Aggregate household income in Millwood in 2022: $454,547
Median per capita income in Millwood in 2022:
Millwood:
$29,871
Washington:
$27,053
Change in median per capita income between 2000 and 2022:
Millwood, Washington:
+87.7%
Washington:
+98.6%
Income statistics for Multirace residents
Median household income in Millwood, WA in 2022:
Millwood:
$37,999
Washington:
$84,303
Number of households with income < $10k:
Millwood:
0.0% (0)
Washington:
4.3% (12,040)
Number of households with income $10k - 20k:
Millwood:
28.0% (7)
State:
6.6% (18,437)
Number of households with income $20k - 30k:
Millwood:
0.0% (0)
State:
5.2% (14,559)
Number of households with income $30k - 40k:
Millwood:
16.0% (4)
State:
6.7% (18,491)
Number of households with income $40k - 50k:
Millwood:
32.0% (8)
State:
6.3% (17,459)
Number of households with income $50k - 60k:
Millwood:
0.0% (0)
Washington:
6.9% (19,086)
Number of households with income $60k - 75k:
Millwood:
0.0% (0)
Washington:
9.1% (25,310)
Number of households with income $75k - 100k:
Millwood:
12.0% (3)
Washington:
13.5% (37,493)
Number of households with income $100k - 125k:
Millwood:
0.0% (0)
State:
10.7% (29,626)
Number of households with income $125k - 150k:
Millwood:
0.0% (0)
State:
8.6% (23,899)
Number of households with income $150k - 200k:
Millwood:
12.0% (3)
State:
10.2% (28,214)
Number of households with income > $200k:
Millwood:
0.0% (0)
State:
11.9% (32,947)
Aggregate household income in Millwood in 2022: $1,201,545
Median family income in Millwood in 2022:
Millwood:
$39,427
Washington:
$95,629
Number of families with income $10k - 20k:
Millwood:
35.3% (6)
Washington:
4.3% (7,519)
Number of families with income $40k - 50k:
Millwood:
50.9% (9)
State:
5.9% (10,412)
Number of families with income $150k - 200k:
Millwood:
13.8% (2)
State:
11.9% (20,852)
Median per capita income in Millwood in 2022:
Millwood:
$13,306
Washington:
$32,496
Change in median per capita income between 2000 and 2022:
Millwood, Washington:
+114.4%
State:
+156.8%
Income statistics for other residents
Median per capita income in Millwood in 2022:
Millwood:
$119,980
Washington:
$27,542
Discuss Millwood, Washington (WA) on our hugely popular Washington forum.