Milton Mills, New Hampshire (NH) income map, earnings map, and wages data

Data:
The per capita income in 2022 was $22,580, which means an increase of 9.3% compared to 2000 when it was $20,479.
Whole page based on the data from 2000 / 2022 when the population of Milton Mills, New Hampshire was 299 / 122
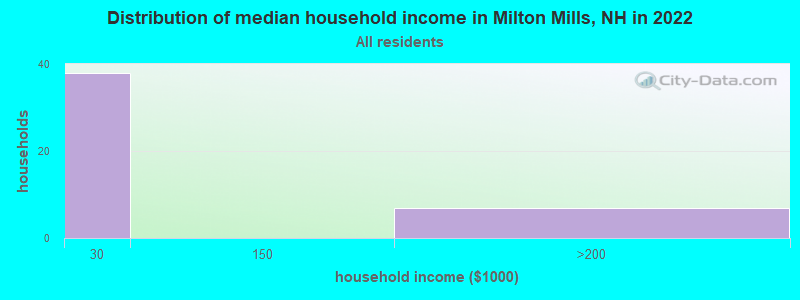
Income statistics for all residents
Number of households with income < $10k:| Milton Mills: | 0.0% (0) |
| State: | 3.1% (17,541) |
Number of households with income $10k - 20k:| Milton Mills: | 0.0% (0) |
| State: | 5.4% (29,916) |
Number of households with income $20k - 30k:| Milton Mills: | 84.4% (38) |
| State: | 5.5% (30,783) |
Number of households with income $30k - 40k:| Milton Mills: | 0.0% (0) |
| State: | 5.9% (32,868) |
Number of households with income $40k - 50k:| Milton Mills: | 0.0% (0) |
| New Hampshire: | 5.9% (32,728) |
Number of households with income $50k - 60k:| Milton Mills: | 0.0% (0) |
| State: | 6.9% (38,422) |
Number of households with income $60k - 75k:| Milton Mills: | 0.0% (0) |
| New Hampshire: | 9.1% (50,552) |
Number of households with income $75k - 100k:| Milton Mills: | 0.0% (0) |
| New Hampshire: | 13.1% (73,145) |
Number of households with income $100k - 125k:| Milton Mills: | 0.0% (0) |
| State: | 10.5% (58,593) |
Number of households with income $125k - 150k:| Milton Mills: | 0.0% (0) |
| New Hampshire: | 8.1% (44,878) |
Number of households with income $150k - 200k:| Milton Mills: | 15.6% (7) |
| State: | 11.5% (64,340) |
Number of households with income > $200k:| Milton Mills: | 0.0% (0) |
| State: | 15.0% (83,454) |
Aggregate household income in Milton Mills in 2022: $5,477,368
Median per capita income in Milton Mills in 2022:| Milton Mills: | $22,581 |
| State: | $49,281 |
Change in median per capita income between 2000 and 2022:| Milton Mills, New Hampshire: | +10.3% |
| State: | +106.7% |
Income statistics for White residents
Number of households with income < $10k:| Milton Mills: | 0.0% (0) |
| State: | 3.1% (15,499) |
Number of households with income $10k - 20k:| Milton Mills: | 0.0% (0) |
| State: | 5.6% (27,915) |
Number of households with income $20k - 30k:| Milton Mills: | 82.6% (38) |
| State: | 5.4% (27,382) |
Number of households with income $30k - 40k:| Milton Mills: | 0.0% (0) |
| State: | 5.9% (29,681) |
Number of households with income $40k - 50k:| Milton Mills: | 0.0% (0) |
| State: | 5.7% (28,456) |
Number of households with income $50k - 60k:| Milton Mills: | 0.0% (0) |
| New Hampshire: | 6.9% (34,641) |
Number of households with income $60k - 75k:| Milton Mills: | 0.0% (0) |
| State: | 9.0% (45,144) |
Number of households with income $75k - 100k:| Milton Mills: | 0.0% (0) |
| State: | 13.0% (65,259) |
Number of households with income $100k - 125k:| Milton Mills: | 0.0% (0) |
| State: | 10.7% (53,931) |
Number of households with income $125k - 150k:| Milton Mills: | 0.0% (0) |
| State: | 8.1% (40,466) |
Number of households with income $150k - 200k:| Milton Mills: | 17.4% (8) |
| State: | 11.9% (59,781) |
Number of households with income > $200k:| Milton Mills: | 0.0% (0) |
| State: | 14.8% (74,387) |
Aggregate household income in Milton Mills in 2022: $5,270,468
Median per capita income in Milton Mills in 2022:| Milton Mills: | $22,377 |
| State: | $50,469 |
Change in median per capita income between 2000 and 2022:| Milton Mills, New Hampshire: | +8.4% |
| State: | +109.2% |