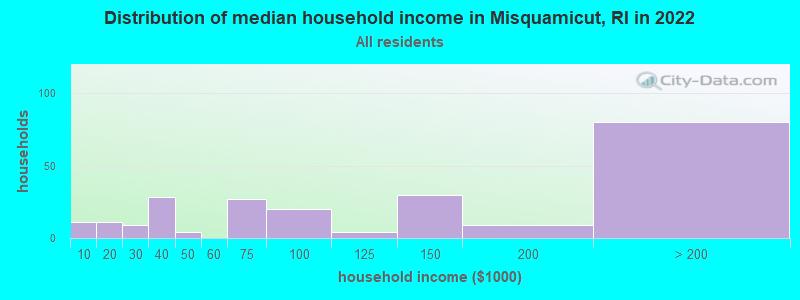
The median household income in Misquamicut, RI in 2022 was $114,519, which was 28.5% greater than the median annual income of $81,854 across the entire state of Rhode Island. Compared to the median income of $53,103 in 2000 this represents an increase of 53.6%. The per capita income in 2022 was $114,659, which means an increase of 77.7% compared to 2000 when it was $25,530.
Whole page based on the data from 2000 / 2022 when the population of Misquamicut, Rhode Island was 390 / 380
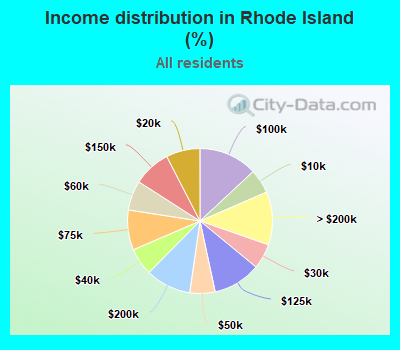
Income statistics for all residents
Median household income in Misquamicut, RI in 2022:
Misquamicut:
$114,520
Rhode Island:
$81,854
Change in median household income between 2000 and 2022:
Misquamicut, Rhode Island:
+115.7%
State:
+94.5%
Number of households with income < $10k:
Misquamicut:
4.7% (11)
State:
5.4% (24,165)
Number of households with income $10k - 20k:
Misquamicut:
4.7% (11)
State:
7.6% (33,817)
Number of households with income $20k - 30k:
Misquamicut:
3.9% (9)
Rhode Island:
5.6% (25,137)
Number of households with income $30k - 40k:
Misquamicut:
12.0% (28)
State:
6.1% (27,221)
Number of households with income $40k - 50k:
Misquamicut:
1.7% (4)
State:
5.6% (25,200)
Number of households with income $50k - 60k:
Misquamicut:
0.0% (0)
Rhode Island:
6.6% (29,522)
Number of households with income $60k - 75k:
Misquamicut:
11.6% (27)
State:
8.9% (39,922)
Number of households with income $75k - 100k:
Misquamicut:
8.6% (20)
Rhode Island:
13.1% (58,406)
Number of households with income $100k - 125k:
Misquamicut:
1.7% (4)
State:
10.7% (47,690)
Number of households with income $125k - 150k:
Misquamicut:
12.9% (30)
State:
8.4% (37,334)
Number of households with income $150k - 200k:
Misquamicut:
3.9% (9)
State:
10.1% (45,318)
Number of households with income > $200k:
Misquamicut:
34.3% (80)
State:
11.9% (52,956)
Aggregate household income in Misquamicut in 2022: $42,705,934
Median non-family income in Misquamicut in 2022:
Misquamicut:
$63,047
State:
$48,459
Change in median non-family income between 2000 and 2022:
Misquamicut, Rhode Island:
+115.0%
State:
+105.7%
Median per capita income in Misquamicut in 2022:
Misquamicut:
$114,659
Rhode Island:
$44,538
Income statistics for White residents
Median household income in Misquamicut, RI in 2022:
Misquamicut:
$115,863
Rhode Island:
$86,507
Change in median household income between 2000 and 2022:
Misquamicut, Rhode Island:
+114.8%
Rhode Island:
+93.9%
Number of households with income < $10k:
Misquamicut:
5.7% (13)
Rhode Island:
4.1% (14,023)
Number of households with income $10k - 20k:
Misquamicut:
3.1% (7)
Rhode Island:
6.3% (21,775)
Number of households with income $20k - 30k:
Misquamicut:
4.4% (10)
State:
5.6% (19,359)
Number of households with income $30k - 40k:
Misquamicut:
10.6% (24)
State:
5.8% (20,001)
Number of households with income $40k - 50k:
Misquamicut:
2.2% (5)
Rhode Island:
5.8% (20,112)
Number of households with income $50k - 60k:
Misquamicut:
0.0% (0)
State:
6.8% (23,542)
Number of households with income $60k - 75k:
Misquamicut:
11.9% (27)
State:
8.8% (30,321)
Number of households with income $75k - 100k:
Misquamicut:
8.8% (20)
Rhode Island:
13.0% (44,807)
Number of households with income $100k - 125k:
Misquamicut:
1.8% (4)
State:
10.9% (37,478)
Number of households with income $125k - 150k:
Misquamicut:
13.7% (31)
Rhode Island:
9.3% (32,110)
Number of households with income $150k - 200k:
Misquamicut:
4.0% (9)
State:
10.5% (36,226)
Number of households with income > $200k:
Misquamicut:
33.9% (77)
State:
13.1% (45,303)
Aggregate household income in Misquamicut in 2022: $42,345,827
Median non-family income in Misquamicut in 2022:
Misquamicut:
$64,233
State:
$51,671
Change in median non-family income between 2000 and 2022:
Misquamicut, Rhode Island:
+118.1%
State:
+111.1%
Median per capita income in Misquamicut in 2022:
Misquamicut:
$114,687
State:
$50,823
Discuss Misquamicut, Rhode Island (RI) on our hugely popular Rhode Island forum.