Monson, Massachusetts (MA) income map, earnings map, and wages data
The median household income in Monson, MA in 2022 was $83,663, which was 12.9% less than the median annual income of $94,488 across the entire state of Massachusetts. Compared to the median income of $52,030 in 2000 this represents an increase of 37.8%. The per capita income in 2022 was $39,515, which means an increase of 43.0% compared to 2000 when it was $22,519.
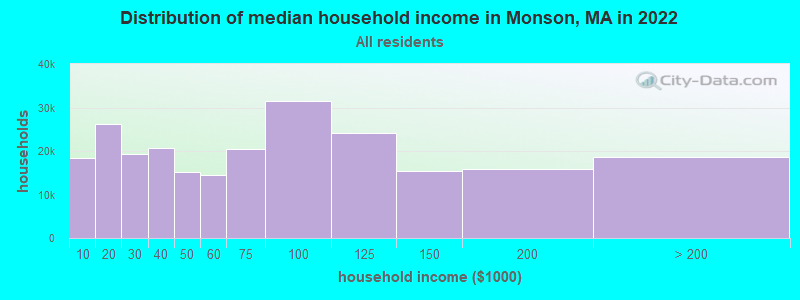
Income statistics for all residents
Median household income in Monson, MA in 2022:| Monson: | $83,664 |
| Massachusetts: | $94,488 |
Change in median household income between 2000 and 2022:| Monson, Massachusetts: | +60.8% |
| State: | +87.1% |
Number of households with income < $10k:| Monson: | 7.6% (18,356) |
| State: | 5.2% (146,170) |
Number of households with income $10k - 20k:| Monson: | 10.9% (26,104) |
| Massachusetts: | 6.4% (180,001) |
Number of households with income $20k - 30k:| Monson: | 8.0% (19,310) |
| State: | 5.6% (156,667) |
Number of households with income $30k - 40k:| Monson: | 8.6% (20,720) |
| State: | 5.6% (157,168) |
Number of households with income $40k - 50k:| Monson: | 6.3% (15,181) |
| Massachusetts: | 5.4% (151,455) |
Number of households with income $50k - 60k:| Monson: | 6.0% (14,529) |
| State: | 5.1% (142,726) |
Number of households with income $60k - 75k:| Monson: | 8.5% (20,467) |
| Massachusetts: | 7.6% (212,203) |
Number of households with income $75k - 100k:| Monson: | 13.1% (31,517) |
| State: | 11.3% (317,064) |
Number of households with income $100k - 125k:| Monson: | 10.0% (24,070) |
| State: | 9.7% (270,603) |
Number of households with income $125k - 150k:| Monson: | 6.4% (15,457) |
| Massachusetts: | 8.0% (223,140) |
Number of households with income $150k - 200k:| Monson: | 6.6% (15,901) |
| Massachusetts: | 11.0% (308,695) |
Number of households with income > $200k:| Monson: | 7.8% (18,693) |
| State: | 19.0% (531,884) |
Aggregate household income in Monson in 2022: $1,308,573,795
Median family income in Monson in 2022:| Monson: | $99,866 |
| Massachusetts: | $120,263 |
Median non-family income in Monson in 2022:| Monson: | $48,126 |
| State: | $55,979 |
Change in median non-family income between 2000 and 2022:| Monson, Massachusetts: | +57.0% |
| State: | +88.0% |
Median per capita income in Monson in 2022:| Monson: | $39,516 |
| State: | $54,025 |
Change in median per capita income between 2000 and 2022:| Monson, Massachusetts: | +75.5% |
| Massachusetts: | +108.2% |
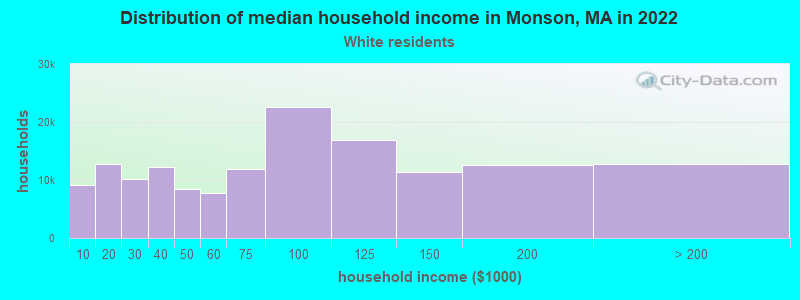
Income statistics for White residents
Median household income in Monson, MA in 2022:| Monson: | $93,618 |
| State: | $101,391 |
Change in median household income between 2000 and 2022:| Monson, Massachusetts: | +79.4% |
| State: | +93.3% |
Number of households with income < $10k:| Monson: | 6.1% (9,072) |
| State: | 4.4% (91,120) |
Number of households with income $10k - 20k:| Monson: | 8.6% (12,753) |
| Massachusetts: | 5.9% (122,055) |
Number of households with income $20k - 30k:| Monson: | 6.8% (10,113) |
| State: | 5.1% (105,311) |
Number of households with income $30k - 40k:| Monson: | 8.3% (12,243) |
| State: | 5.3% (110,239) |
Number of households with income $40k - 50k:| Monson: | 5.7% (8,507) |
| Massachusetts: | 5.0% (104,636) |
Number of households with income $50k - 60k:| Monson: | 5.2% (7,731) |
| State: | 4.8% (99,486) |
Number of households with income $60k - 75k:| Monson: | 8.0% (11,867) |
| State: | 7.5% (155,124) |
Number of households with income $75k - 100k:| Monson: | 15.2% (22,611) |
| State: | 11.4% (236,252) |
Number of households with income $100k - 125k:| Monson: | 11.3% (16,838) |
| State: | 9.9% (204,731) |
Number of households with income $125k - 150k:| Monson: | 7.6% (11,304) |
| State: | 8.5% (175,324) |
Number of households with income $150k - 200k:| Monson: | 8.5% (12,631) |
| State: | 11.7% (242,980) |
Number of households with income > $200k:| Monson: | 8.6% (12,709) |
| State: | 20.5% (425,966) |
Aggregate household income in Monson in 2022: $961,745,125
Median family income in Monson in 2022:| Monson: | $106,499 |
| State: | $133,153 |
Number of families with income < $10k:| Monson: | 2.6% (45) |
| Massachusetts: | 2.0% (25,038) |
Number of families with income $10k - 20k:| Monson: | 2.8% (49) |
| State: | 2.1% (26,403) |
Number of families with income $20k - 30k:| Monson: | 2.1% (37) |
| State: | 2.6% (32,525) |
Number of families with income $30k - 40k:| Monson: | 4.2% (72) |
| Massachusetts: | 3.9% (48,079) |
Number of families with income $40k - 50k:| Monson: | 3.6% (62) |
| State: | 3.8% (46,908) |
Number of families with income $50k - 60k:| Monson: | 6.8% (118) |
| State: | 3.8% (46,476) |
Number of families with income $60k - 75k:| Monson: | 6.3% (110) |
| State: | 6.4% (79,040) |
Number of families with income $75k - 100k:| Monson: | 23.7% (411) |
| State: | 11.1% (137,395) |
Number of families with income $100k - 125k:| Monson: | 17.9% (311) |
| State: | 11.1% (136,771) |
Number of families with income $125k - 150k:| Monson: | 10.7% (186) |
| State: | 10.0% (123,709) |
Number of families with income $150k - 200k:| Monson: | 11.9% (206) |
| Massachusetts: | 14.7% (181,602) |
Number of families with income > $200k:| Monson: | 7.4% (128) |
| Massachusetts: | 28.5% (351,887) |
Median non-family income in Monson in 2022:| Monson: | $50,743 |
| State: | $59,323 |
Change in median non-family income between 2000 and 2022:| Monson, Massachusetts: | +64.6% |
| State: | +94.3% |
Median per capita income in Monson in 2022:| Monson: | $42,243 |
| Massachusetts: | $60,804 |
Change in median per capita income between 2000 and 2022:| Monson, Massachusetts: | +87.0% |
| Massachusetts: | +118.7% |
Income statistics for Black or African American residents
Number of households with income < $10k:| Monson: | 9.4% (843) |
| State: | 9.1% (15,797) |
Number of households with income $10k - 20k:| Monson: | 7.0% (623) |
| State: | 9.4% (16,267) |
Number of households with income $20k - 30k:| Monson: | 7.8% (700) |
| State: | 7.8% (13,520) |
Number of households with income $30k - 40k:| Monson: | 15.3% (1,375) |
| State: | 8.3% (14,412) |
Number of households with income $40k - 50k:| Monson: | 11.2% (1,008) |
| State: | 7.9% (13,790) |
Number of households with income $50k - 60k:| Monson: | 6.9% (621) |
| State: | 5.8% (10,041) |
Number of households with income $60k - 75k:| Monson: | 10.1% (909) |
| State: | 8.5% (14,822) |
Number of households with income $75k - 100k:| Monson: | 8.8% (789) |
| State: | 11.0% (19,122) |
Number of households with income $100k - 125k:| Monson: | 7.2% (649) |
| Massachusetts: | 8.4% (14,575) |
Number of households with income $125k - 150k:| Monson: | 2.2% (199) |
| State: | 6.0% (10,429) |
Number of households with income $150k - 200k:| Monson: | 3.8% (342) |
| State: | 7.2% (12,539) |
Number of households with income > $200k:| Monson: | 10.1% (906) |
| State: | 10.5% (18,185) |
Median per capita income in Monson in 2022:| Monson: | $15,871 |
| Massachusetts: | $33,524 |
Change in median per capita income between 2000 and 2022:| Monson, Massachusetts: | +95.7% |
| State: | +109.4% |
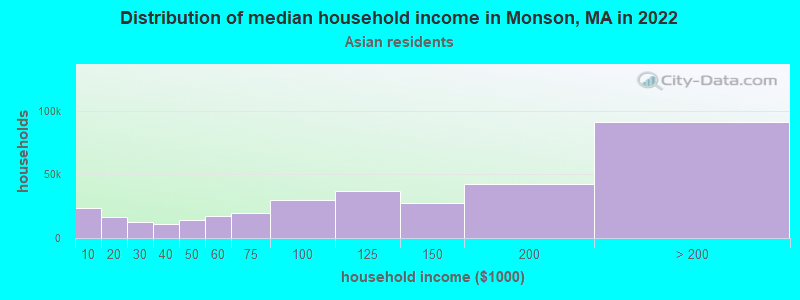
Income statistics for Asian residents
Median household income in Monson, MA in 2022:| Monson: | $134,671 |
| State: | $117,855 |
Change in median household income between 2000 and 2022:| Monson, Massachusetts: | +34.4% |
| Massachusetts: | +129.9% |
Number of households with income < $10k:| Monson: | 6.8% (23,412) |
| Massachusetts: | 6.8% (11,982) |
Number of households with income $10k - 20k:| Monson: | 4.8% (16,366) |
| State: | 4.8% (8,376) |
Number of households with income $20k - 30k:| Monson: | 3.7% (12,814) |
| Massachusetts: | 3.7% (6,558) |
Number of households with income $30k - 40k:| Monson: | 3.3% (11,231) |
| State: | 3.3% (5,748) |
Number of households with income $40k - 50k:| Monson: | 4.1% (14,053) |
| Massachusetts: | 4.1% (7,192) |
Number of households with income $50k - 60k:| Monson: | 5.0% (17,065) |
| Massachusetts: | 5.0% (8,734) |
Number of households with income $60k - 75k:| Monson: | 5.8% (19,936) |
| State: | 5.8% (10,203) |
Number of households with income $75k - 100k:| Monson: | 8.6% (29,610) |
| Massachusetts: | 8.6% (15,154) |
Number of households with income $100k - 125k:| Monson: | 10.8% (37,011) |
| State: | 10.8% (18,942) |
Number of households with income $125k - 150k:| Monson: | 8.0% (27,427) |
| Massachusetts: | 8.0% (14,037) |
Number of households with income $150k - 200k:| Monson: | 12.5% (42,705) |
| State: | 12.5% (21,856) |
Number of households with income > $200k:| Monson: | 26.6% (91,236) |
| Massachusetts: | 26.6% (46,694) |
Aggregate household income in Monson in 2022: $5,374,670
Median family income in Monson in 2022:| Monson: | $154,965 |
| State: | $140,113 |
Number of families with income $40k - 50k:| Monson: | 26.1% (9) |
| Massachusetts: | 3.9% (4,621) |
Number of families with income $100k - 125k:| Monson: | 73.9% (27) |
| State: | 10.0% (11,697) |
Median per capita income in Monson in 2022:| Monson: | $60,685 |
| State: | $58,900 |
Change in median per capita income between 2000 and 2022:| Monson, Massachusetts: | +87.5% |
| State: | +174.6% |
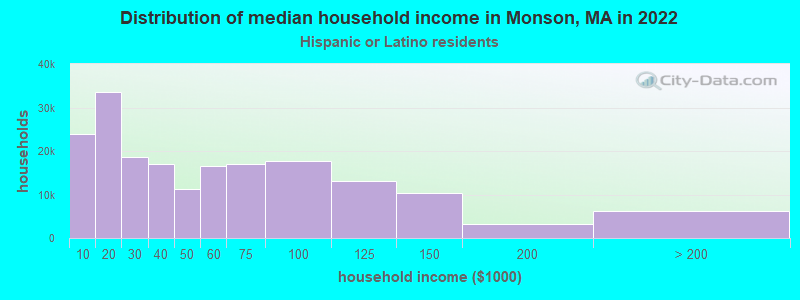
Income statistics for Hispanic or Latino residents
Median household income in Monson, MA in 2022:| Monson: | $177,399 |
| State: | $61,523 |
Change in median household income between 2000 and 2022:| Monson, Massachusetts: | +120.4% |
| State: | +125.4% |
Number of households with income < $10k:| Monson: | 12.7% (23,858) |
| Massachusetts: | 8.8% (25,307) |
Number of households with income $10k - 20k:| Monson: | 17.8% (33,530) |
| State: | 10.0% (28,653) |
Number of households with income $20k - 30k:| Monson: | 10.0% (18,731) |
| State: | 8.8% (25,189) |
Number of households with income $30k - 40k:| Monson: | 9.0% (16,941) |
| Massachusetts: | 7.2% (20,822) |
Number of households with income $40k - 50k:| Monson: | 5.9% (11,191) |
| State: | 7.2% (20,817) |
Number of households with income $50k - 60k:| Monson: | 8.8% (16,480) |
| State: | 6.5% (18,748) |
Number of households with income $60k - 75k:| Monson: | 9.0% (16,963) |
| State: | 8.8% (25,390) |
Number of households with income $75k - 100k:| Monson: | 9.3% (17,594) |
| State: | 12.0% (34,488) |
Number of households with income $100k - 125k:| Monson: | 7.0% (13,211) |
| State: | 8.6% (24,599) |
Number of households with income $125k - 150k:| Monson: | 5.5% (10,421) |
| State: | 6.2% (17,743) |
Number of households with income $150k - 200k:| Monson: | 1.7% (3,169) |
| Massachusetts: | 7.3% (21,017) |
Number of households with income > $200k:| Monson: | 3.2% (6,107) |
| State: | 8.6% (24,606) |
Aggregate household income in Monson in 2022: $3,127,605
Median non-family income in Monson in 2022:| Monson: | $119,724 |
| State: | $37,563 |
Change in median non-family income between 2000 and 2022:| Monson, Massachusetts: | +48.7% |
| State: | +115.0% |
Median per capita income in Monson in 2022:| Monson: | $31,182 |
| Massachusetts: | $28,993 |
Change in median per capita income between 2000 and 2022:| Monson, Massachusetts: | +129.0% |
| State: | +142.4% |
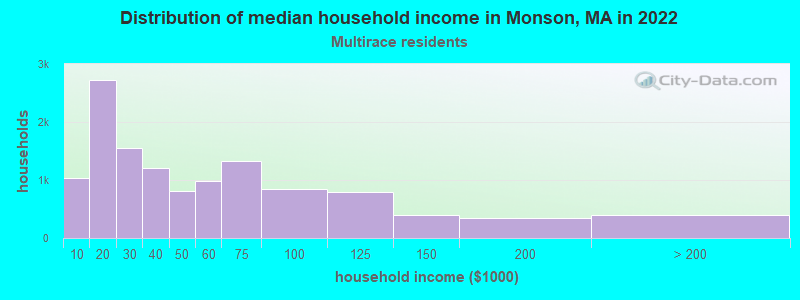
Income statistics for Multirace residents
Median household income in Monson, MA in 2022:| Monson: | $17,295 |
| State: | $71,552 |
Change in median household income between 2000 and 2022:| Monson, Massachusetts: | +42.6% |
| Massachusetts: | +109.0% |
Number of households with income < $10k:| Monson: | 8.4% (1,037) |
| State: | 6.6% (15,127) |
Number of households with income $10k - 20k:| Monson: | 22.0% (2,720) |
| State: | 9.2% (21,158) |
Number of households with income $20k - 30k:| Monson: | 12.5% (1,546) |
| Massachusetts: | 7.8% (18,016) |
Number of households with income $30k - 40k:| Monson: | 9.7% (1,207) |
| State: | 7.9% (18,260) |
Number of households with income $40k - 50k:| Monson: | 6.6% (812) |
| Massachusetts: | 5.6% (13,027) |
Number of households with income $50k - 60k:| Monson: | 7.9% (978) |
| State: | 5.6% (12,909) |
Number of households with income $60k - 75k:| Monson: | 10.7% (1,327) |
| Massachusetts: | 9.0% (20,800) |
Number of households with income $75k - 100k:| Monson: | 6.8% (843) |
| Massachusetts: | 12.1% (27,875) |
Number of households with income $100k - 125k:| Monson: | 6.4% (789) |
| State: | 8.1% (18,754) |
Number of households with income $125k - 150k:| Monson: | 3.2% (397) |
| State: | 6.8% (15,621) |
Number of households with income $150k - 200k:| Monson: | 2.8% (342) |
| State: | 9.4% (21,618) |
Number of households with income > $200k:| Monson: | 3.2% (392) |
| Massachusetts: | 12.0% (27,592) |
Aggregate household income in Monson in 2022: $4,372,834
Median non-family income in Monson in 2022:| Monson: | $12,535 |
| State: | $42,253 |
Change in median non-family income between 2000 and 2022:| Monson, Massachusetts: | +3.4% |
| State: | +93.7% |
Median per capita income in Monson in 2022:| Monson: | $25,707 |
| Massachusetts: | $34,029 |
Change in median per capita income between 2000 and 2022:| Monson, Massachusetts: | +88.2% |
| State: | +132.1% |