Mount Pisgah, South Carolina (SC) income map, earnings map, and wages data
The median household income in Mount Pisgah, SC in 2022 was $53,920, which was 18.9% less than the median annual income of $64,115 across the entire state of South Carolina. Compared to the median income of $35,654 in 2000 this represents an increase of 33.9%. The per capita income in 2022 was $36,091, which means an increase of 42.9% compared to 2000 when it was $20,613.
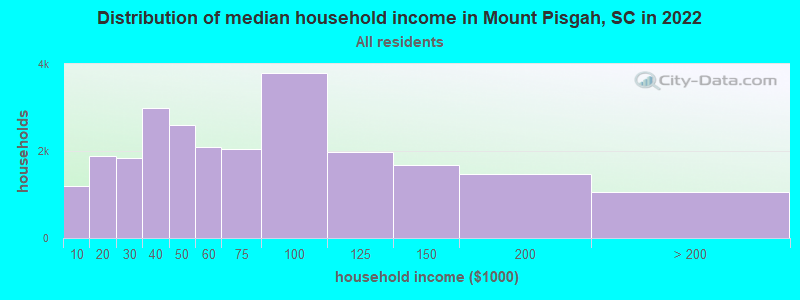
Income statistics for all residents
Median household income in Mount Pisgah, SC in 2022:| Mount Pisgah: | $53,920 |
| State: | $64,115 |
Change in median household income between 2000 and 2022:| Mount Pisgah, South Carolina: | +51.2% |
| State: | +72.9% |
Number of households with income < $10k:| Mount Pisgah: | 4.8% (1,190) |
| South Carolina: | 6.1% (130,922) |
Number of households with income $10k - 20k:| Mount Pisgah: | 7.7% (1,882) |
| State: | 7.9% (168,918) |
Number of households with income $20k - 30k:| Mount Pisgah: | 7.5% (1,849) |
| State: | 8.0% (171,564) |
Number of households with income $30k - 40k:| Mount Pisgah: | 12.1% (2,980) |
| State: | 9.2% (195,662) |
Number of households with income $40k - 50k:| Mount Pisgah: | 10.5% (2,591) |
| South Carolina: | 8.2% (176,179) |
Number of households with income $50k - 60k:| Mount Pisgah: | 8.5% (2,090) |
| State: | 7.5% (159,159) |
Number of households with income $60k - 75k:| Mount Pisgah: | 8.3% (2,042) |
| State: | 9.9% (211,862) |
Number of households with income $75k - 100k:| Mount Pisgah: | 15.4% (3,790) |
| South Carolina: | 13.5% (287,601) |
Number of households with income $100k - 125k:| Mount Pisgah: | 8.1% (1,979) |
| South Carolina: | 9.3% (199,068) |
Number of households with income $125k - 150k:| Mount Pisgah: | 6.8% (1,671) |
| State: | 6.2% (133,330) |
Number of households with income $150k - 200k:| Mount Pisgah: | 6.0% (1,466) |
| South Carolina: | 6.6% (141,363) |
Number of households with income > $200k:| Mount Pisgah: | 4.3% (1,050) |
| State: | 7.5% (160,452) |
Aggregate household income in Mount Pisgah in 2022: $111,748,873
Median family income in Mount Pisgah in 2022:| Mount Pisgah: | $67,259 |
| South Carolina: | $79,886 |
Median non-family income in Mount Pisgah in 2022:| Mount Pisgah: | $36,058 |
| South Carolina: | $38,426 |
Change in median non-family income between 2000 and 2022:| Mount Pisgah, South Carolina: | +69.7% |
| State: | +78.7% |
Median per capita income in Mount Pisgah in 2022:| Mount Pisgah: | $36,092 |
| South Carolina: | $36,675 |
Change in median per capita income between 2000 and 2022:| Mount Pisgah, South Carolina: | +75.1% |
| State: | +95.1% |
Income statistics for White residents
Median household income in Mount Pisgah, SC in 2022:| Mount Pisgah: | $54,823 |
| South Carolina: | $73,516 |
Change in median household income between 2000 and 2022:| Mount Pisgah, South Carolina: | +51.1% |
| State: | +74.8% |
Number of households with income < $10k:| Mount Pisgah: | 5.0% (790) |
| South Carolina: | 4.8% (68,379) |
Number of households with income $10k - 20k:| Mount Pisgah: | 5.3% (844) |
| State: | 5.9% (85,105) |
Number of households with income $20k - 30k:| Mount Pisgah: | 4.5% (720) |
| South Carolina: | 7.1% (101,178) |
Number of households with income $30k - 40k:| Mount Pisgah: | 13.5% (2,144) |
| State: | 8.0% (114,877) |
Number of households with income $40k - 50k:| Mount Pisgah: | 10.9% (1,740) |
| State: | 7.9% (112,749) |
Number of households with income $50k - 60k:| Mount Pisgah: | 9.2% (1,466) |
| State: | 7.1% (101,835) |
Number of households with income $60k - 75k:| Mount Pisgah: | 8.1% (1,288) |
| State: | 10.2% (145,879) |
Number of households with income $75k - 100k:| Mount Pisgah: | 14.0% (2,227) |
| State: | 14.0% (200,068) |
Number of households with income $100k - 125k:| Mount Pisgah: | 9.6% (1,525) |
| South Carolina: | 10.4% (148,542) |
Number of households with income $125k - 150k:| Mount Pisgah: | 7.2% (1,144) |
| State: | 7.3% (105,118) |
Number of households with income $150k - 200k:| Mount Pisgah: | 7.9% (1,257) |
| State: | 8.0% (114,506) |
Number of households with income > $200k:| Mount Pisgah: | 4.7% (748) |
| South Carolina: | 9.3% (133,550) |
Aggregate household income in Mount Pisgah in 2022: $98,885,006
Median family income in Mount Pisgah in 2022:| Mount Pisgah: | $65,704 |
| State: | $90,709 |
Number of families with income $10k - 20k:| Mount Pisgah: | 3.6% (19) |
| State: | 3.0% (28,325) |
Number of families with income $20k - 30k:| Mount Pisgah: | 4.9% (26) |
| State: | 4.4% (42,131) |
Number of families with income $30k - 40k:| Mount Pisgah: | 22.2% (115) |
| State: | 6.1% (57,510) |
Number of families with income $40k - 50k:| Mount Pisgah: | 13.2% (68) |
| State: | 7.0% (66,712) |
Number of families with income $50k - 60k:| Mount Pisgah: | 12.9% (67) |
| State: | 6.6% (62,489) |
Number of families with income $60k - 75k:| Mount Pisgah: | 10.0% (52) |
| South Carolina: | 10.0% (94,724) |
Number of families with income $75k - 100k:| Mount Pisgah: | 13.0% (68) |
| State: | 15.5% (147,207) |
Number of families with income $100k - 125k:| Mount Pisgah: | 14.5% (75) |
| State: | 12.5% (118,160) |
Number of families with income > $200k:| Mount Pisgah: | 5.7% (30) |
| State: | 12.4% (117,500) |
Median non-family income in Mount Pisgah in 2022:| Mount Pisgah: | $35,796 |
| South Carolina: | $42,596 |
Change in median non-family income between 2000 and 2022:| Mount Pisgah, South Carolina: | +67.0% |
| State: | +74.9% |
Median per capita income in Mount Pisgah in 2022:| Mount Pisgah: | $37,413 |
| State: | $42,728 |
Change in median per capita income between 2000 and 2022:| Mount Pisgah, South Carolina: | +73.7% |
| South Carolina: | +93.4% |
Income statistics for Black or African American residents
Median household income in Mount Pisgah, SC in 2022:| Mount Pisgah: | $53,898 |
| State: | $44,187 |
Change in median household income between 2000 and 2022:| Mount Pisgah, South Carolina: | +121.1% |
| State: | +76.5% |
Number of households with income < $10k:| Mount Pisgah: | 10.0% (25,462) |
| South Carolina: | 10.0% (52,303) |
Number of households with income $10k - 20k:| Mount Pisgah: | 13.4% (34,041) |
| State: | 13.4% (69,913) |
Number of households with income $20k - 30k:| Mount Pisgah: | 10.4% (26,395) |
| South Carolina: | 10.4% (54,216) |
Number of households with income $30k - 40k:| Mount Pisgah: | 12.0% (30,534) |
| State: | 12.0% (62,722) |
Number of households with income $40k - 50k:| Mount Pisgah: | 9.2% (23,259) |
| South Carolina: | 9.2% (47,773) |
Number of households with income $50k - 60k:| Mount Pisgah: | 8.3% (20,971) |
| South Carolina: | 8.3% (43,083) |
Number of households with income $60k - 75k:| Mount Pisgah: | 9.3% (23,678) |
| State: | 9.3% (48,640) |
Number of households with income $75k - 100k:| Mount Pisgah: | 12.2% (31,019) |
| State: | 12.2% (63,723) |
Number of households with income $100k - 125k:| Mount Pisgah: | 6.4% (16,120) |
| State: | 6.4% (33,117) |
Number of households with income $125k - 150k:| Mount Pisgah: | 3.2% (8,015) |
| South Carolina: | 3.2% (16,465) |
Number of households with income $150k - 200k:| Mount Pisgah: | 3.2% (8,115) |
| State: | 3.2% (16,672) |
Number of households with income > $200k:| Mount Pisgah: | 2.3% (5,945) |
| State: | 2.3% (12,213) |
Aggregate household income in Mount Pisgah in 2022: $5,330,287
Median family income in Mount Pisgah in 2022:| Mount Pisgah: | $54,253 |
| South Carolina: | $54,267 |
Number of families with income < $10k:| Mount Pisgah: | 16.3% (6) |
| State: | 7.3% (23,752) |
Number of families with income $10k - 20k:| Mount Pisgah: | 14.7% (5) |
| State: | 8.5% (27,789) |
Number of families with income $20k - 30k:| Mount Pisgah: | 15.8% (6) |
| South Carolina: | 9.4% (30,766) |
Number of families with income $30k - 40k:| Mount Pisgah: | 32.6% (12) |
| South Carolina: | 11.6% (37,651) |
Number of families with income $40k - 50k:| Mount Pisgah: | 8.3% (3) |
| State: | 9.5% (30,858) |
Number of families with income $50k - 60k:| Mount Pisgah: | 12.3% (5) |
| State: | 8.7% (28,419) |
Median non-family income in Mount Pisgah in 2022:| Mount Pisgah: | $25,392 |
| South Carolina: | $28,585 |
Median per capita income in Mount Pisgah in 2022:| Mount Pisgah: | $27,788 |
| South Carolina: | $24,863 |
Change in median per capita income between 2000 and 2022:| Mount Pisgah, South Carolina: | +139.3% |
| South Carolina: | +111.1% |
Income statistics for Asian residents
Aggregate household income in Mount Pisgah in 2022: $954,869
Median per capita income in Mount Pisgah in 2022:| Mount Pisgah: | $28,955 |
| South Carolina: | $48,909 |
Change in median per capita income between 2000 and 2022:| Mount Pisgah, South Carolina: | +116.3% |
| South Carolina: | +138.1% |
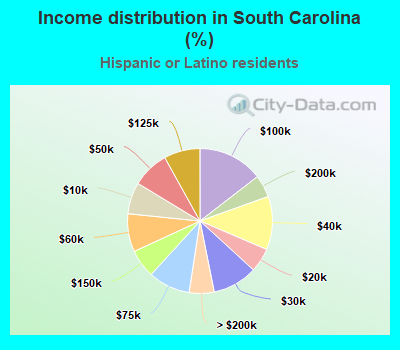
Income statistics for Hispanic or Latino residents
Median household income in Mount Pisgah, SC in 2022:| Mount Pisgah: | $1,450 |
| State: | $58,486 |
Number of households with income < $10k:| Mount Pisgah: | 7.1% (278) |
| State: | 7.1% (7,036) |
Number of households with income $10k - 20k:| Mount Pisgah: | 5.4% (213) |
| South Carolina: | 5.4% (5,379) |
Number of households with income $20k - 30k:| Mount Pisgah: | 10.0% (394) |
| State: | 10.0% (9,993) |
Number of households with income $30k - 40k:| Mount Pisgah: | 11.9% (466) |
| State: | 11.9% (11,872) |
Number of households with income $40k - 50k:| Mount Pisgah: | 8.3% (324) |
| South Carolina: | 8.3% (8,239) |
Number of households with income $50k - 60k:| Mount Pisgah: | 8.5% (333) |
| South Carolina: | 8.5% (8,475) |
Number of households with income $60k - 75k:| Mount Pisgah: | 9.4% (367) |
| State: | 9.4% (9,330) |
Number of households with income $75k - 100k:| Mount Pisgah: | 14.6% (571) |
| South Carolina: | 14.5% (14,491) |
Number of households with income $100k - 125k:| Mount Pisgah: | 8.0% (315) |
| South Carolina: | 8.1% (8,026) |
Number of households with income $125k - 150k:| Mount Pisgah: | 6.3% (248) |
| State: | 6.3% (6,313) |
Number of households with income $150k - 200k:| Mount Pisgah: | 5.0% (195) |
| State: | 5.0% (4,963) |
Number of households with income > $200k:| Mount Pisgah: | 5.6% (218) |
| State: | 5.6% (5,548) |
Aggregate household income in Mount Pisgah in 2022: $57,402
Median family income in Mount Pisgah in 2022:| Mount Pisgah: | $1,348 |
| South Carolina: | $62,837 |
Number of families with income $10k - 20k:| Mount Pisgah: | 8.8% (4) |
| State: | 4.8% (3,459) |
Number of families with income $20k - 30k:| Mount Pisgah: | 16.6% (8) |
| State: | 8.4% (6,079) |
Number of families with income $30k - 40k:| Mount Pisgah: | 22.2% (11) |
| State: | 12.3% (8,946) |
Number of families with income $40k - 50k:| Mount Pisgah: | 17.1% (8) |
| State: | 8.9% (6,476) |
Number of families with income $50k - 60k:| Mount Pisgah: | 8.6% (4) |
| State: | 7.1% (5,144) |
Number of families with income $60k - 75k:| Mount Pisgah: | 8.2% (4) |
| State: | 9.5% (6,918) |
Number of families with income $75k - 100k:| Mount Pisgah: | 9.9% (5) |
| South Carolina: | 15.0% (10,886) |
Number of families with income $100k - 125k:| Mount Pisgah: | 5.4% (3) |
| State: | 9.5% (6,862) |
Number of families with income > $200k:| Mount Pisgah: | 3.3% (2) |
| South Carolina: | 5.6% (4,034) |
Median per capita income in Mount Pisgah in 2022:| Mount Pisgah: | $606 |
| State: | $23,692 |