Mulberry, Tennessee (TN) income map, earnings map, and wages data
The median household income in Mulberry, TN in 2022 was $73,825, which was 11.6% greater than the median annual income of $65,254 across the entire state of Tennessee. Compared to the median income of $41,214 in 2000 this represents an increase of 44.2%. The per capita income in 2022 was $37,848, which means an increase of 47.0% compared to 2000 when it was $20,067.
Income statistics for all residents
Median household income in Mulberry, TN in 2022:| Mulberry: | $73,826 |
| Tennessee: | $65,254 |
Change in median household income between 2000 and 2022:| Mulberry, Tennessee: | +79.1% |
| State: | +79.5% |
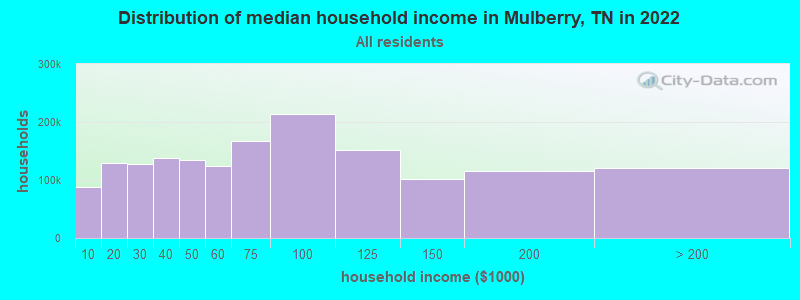
Number of households with income < $10k:| Mulberry: | 5.4% (87,604) |
| Tennessee: | 5.4% (154,793) |
Number of households with income $10k - 20k:| Mulberry: | 8.0% (129,562) |
| Tennessee: | 8.0% (228,599) |
Number of households with income $20k - 30k:| Mulberry: | 7.9% (127,414) |
| State: | 7.9% (224,908) |
Number of households with income $30k - 40k:| Mulberry: | 8.6% (138,304) |
| State: | 8.6% (244,297) |
Number of households with income $40k - 50k:| Mulberry: | 8.4% (135,258) |
| State: | 8.4% (238,949) |
Number of households with income $50k - 60k:| Mulberry: | 7.7% (123,665) |
| Tennessee: | 7.7% (218,438) |
Number of households with income $60k - 75k:| Mulberry: | 10.3% (166,564) |
| Tennessee: | 10.3% (294,172) |
Number of households with income $75k - 100k:| Mulberry: | 13.3% (213,623) |
| State: | 13.3% (377,310) |
Number of households with income $100k - 125k:| Mulberry: | 9.5% (152,453) |
| State: | 9.5% (269,124) |
Number of households with income $125k - 150k:| Mulberry: | 6.3% (100,900) |
| Tennessee: | 6.3% (178,328) |
Number of households with income $150k - 200k:| Mulberry: | 7.2% (115,393) |
| State: | 7.2% (204,030) |
Number of households with income > $200k:| Mulberry: | 7.5% (120,648) |
| Tennessee: | 7.5% (213,736) |
Aggregate household income in Mulberry in 2022: $2,074,003,023
Median family income in Mulberry in 2022:| Mulberry: | $82,475 |
| Tennessee: | $80,910 |
Median non-family income in Mulberry in 2022:| Mulberry: | $38,661 |
| State: | $40,285 |
Change in median non-family income between 2000 and 2022:| Mulberry, Tennessee: | +91.6% |
| State: | +91.5% |
Median per capita income in Mulberry in 2022:| Mulberry: | $37,849 |
| State: | $36,704 |
Change in median per capita income between 2000 and 2022:| Mulberry, Tennessee: | +88.6% |
| State: | +89.3% |
Income statistics for White residents
Median household income in Mulberry, TN in 2022:| Mulberry: | $74,858 |
| State: | $69,826 |
Change in median household income between 2000 and 2022:| Mulberry, Tennessee: | +80.8% |
| State: | +82.9% |
Number of households with income < $10k:| Mulberry: | 4.7% (54,459) |
| State: | 4.6% (100,279) |
Number of households with income $10k - 20k:| Mulberry: | 7.7% (89,768) |
| State: | 7.6% (165,031) |
Number of households with income $20k - 30k:| Mulberry: | 7.5% (87,125) |
| State: | 7.4% (160,229) |
Number of households with income $30k - 40k:| Mulberry: | 8.1% (94,532) |
| Tennessee: | 8.1% (174,784) |
Number of households with income $40k - 50k:| Mulberry: | 7.9% (91,861) |
| Tennessee: | 7.8% (169,622) |
Number of households with income $50k - 60k:| Mulberry: | 7.7% (89,415) |
| State: | 7.6% (165,508) |
Number of households with income $60k - 75k:| Mulberry: | 10.4% (121,147) |
| State: | 10.3% (223,937) |
Number of households with income $75k - 100k:| Mulberry: | 13.5% (157,962) |
| State: | 13.5% (292,688) |
Number of households with income $100k - 125k:| Mulberry: | 10.1% (118,327) |
| Tennessee: | 10.1% (219,251) |
Number of households with income $125k - 150k:| Mulberry: | 6.6% (76,674) |
| State: | 6.6% (142,574) |
Number of households with income $150k - 200k:| Mulberry: | 7.6% (89,085) |
| State: | 7.7% (166,039) |
Number of households with income > $200k:| Mulberry: | 8.4% (98,171) |
| State: | 8.5% (184,546) |
Aggregate household income in Mulberry in 2022: $1,616,927,659
Median family income in Mulberry in 2022:| Mulberry: | $85,034 |
| State: | $86,015 |
Number of families with income < $10k:| Mulberry: | 4.1% (20) |
| State: | 3.1% (43,751) |
Number of families with income $10k - 20k:| Mulberry: | 3.3% (16) |
| State: | 3.5% (49,925) |
Number of families with income $20k - 30k:| Mulberry: | 7.8% (38) |
| State: | 5.0% (70,431) |
Number of families with income $30k - 40k:| Mulberry: | 5.9% (29) |
| State: | 6.6% (93,498) |
Number of families with income $40k - 50k:| Mulberry: | 12.1% (59) |
| State: | 6.8% (96,726) |
Number of families with income $50k - 60k:| Mulberry: | 14.9% (73) |
| State: | 7.2% (101,879) |
Number of families with income $60k - 75k:| Mulberry: | 14.2% (69) |
| State: | 10.7% (151,997) |
Number of families with income $75k - 100k:| Mulberry: | 11.7% (57) |
| Tennessee: | 15.4% (218,373) |
Number of families with income $100k - 125k:| Mulberry: | 8.7% (42) |
| State: | 12.6% (178,761) |
Number of families with income $150k - 200k:| Mulberry: | 6.3% (31) |
| State: | 9.9% (141,123) |
Number of families with income > $200k:| Mulberry: | 11.0% (54) |
| State: | 11.2% (159,431) |
Median non-family income in Mulberry in 2022:| Mulberry: | $36,913 |
| State: | $41,178 |
Change in median non-family income between 2000 and 2022:| Mulberry, Tennessee: | +91.1% |
| Tennessee: | +91.1% |
Median per capita income in Mulberry in 2022:| Mulberry: | $38,822 |
| State: | $40,126 |
Change in median per capita income between 2000 and 2022:| Mulberry, Tennessee: | +91.8% |
| State: | +92.6% |
Income statistics for Black or African American residents
Median household income in Mulberry, TN in 2022:| Mulberry: | $58,067 |
| State: | $49,531 |
Change in median household income between 2000 and 2022:| Mulberry, Tennessee: | +98.7% |
| State: | +82.3% |
Number of households with income < $10k:| Mulberry: | 9.1% (21,534) |
| Tennessee: | 9.1% (39,909) |
Number of households with income $10k - 20k:| Mulberry: | 10.5% (24,910) |
| State: | 10.5% (46,276) |
Number of households with income $20k - 30k:| Mulberry: | 10.2% (24,298) |
| State: | 10.2% (45,072) |
Number of households with income $30k - 40k:| Mulberry: | 10.0% (23,622) |
| State: | 10.0% (43,885) |
Number of households with income $40k - 50k:| Mulberry: | 10.7% (25,492) |
| State: | 10.7% (47,267) |
Number of households with income $50k - 60k:| Mulberry: | 7.7% (18,244) |
| Tennessee: | 7.7% (33,868) |
Number of households with income $60k - 75k:| Mulberry: | 10.5% (24,914) |
| Tennessee: | 10.5% (46,247) |
Number of households with income $75k - 100k:| Mulberry: | 12.6% (29,853) |
| State: | 12.6% (55,465) |
Number of households with income $100k - 125k:| Mulberry: | 6.7% (15,863) |
| Tennessee: | 6.7% (29,515) |
Number of households with income $125k - 150k:| Mulberry: | 4.8% (11,464) |
| Tennessee: | 4.8% (21,306) |
Number of households with income $150k - 200k:| Mulberry: | 4.6% (10,953) |
| State: | 4.6% (20,425) |
Number of households with income > $200k:| Mulberry: | 2.5% (5,999) |
| Tennessee: | 2.5% (11,183) |
Aggregate household income in Mulberry in 2022: $7,723,941
Median family income in Mulberry in 2022:| Mulberry: | $92,075 |
| Tennessee: | $61,153 |
Number of families with income $10k - 20k:| Mulberry: | 24.6% (4) |
| State: | 6.0% (15,530) |
Number of families with income $40k - 50k:| Mulberry: | 75.4% (13) |
| State: | 10.2% (26,463) |
Median non-family income in Mulberry in 2022:| Mulberry: | $63,750 |
| State: | $35,793 |
Change in median non-family income between 2000 and 2022:| Mulberry, Tennessee: | +121.7% |
| Tennessee: | +104.3% |
Median per capita income in Mulberry in 2022:| Mulberry: | $33,799 |
| Tennessee: | $27,306 |
Change in median per capita income between 2000 and 2022:| Mulberry, Tennessee: | +112.3% |
| State: | +105.3% |