The median household income in Muncie, IN in 2022 was $40,968, which was 63.0% less than the median annual income of $66,785 across the entire state of Indiana. Compared to the median income of $26,613 in 2000 this represents an increase of 35.0%. The per capita income in 2022 was $25,226, which means an increase of 37.3% compared to 2000 when it was $15,814.
Whole page based on the data from 2000 / 2022 when the population of Muncie, Indiana was 67,430 / 65,160
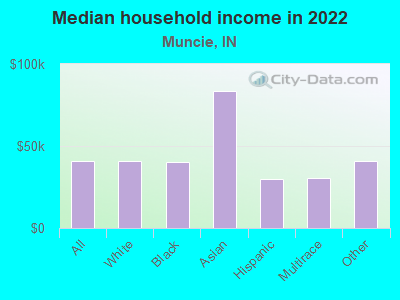
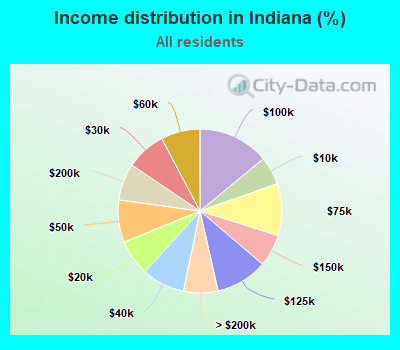
Income statistics for all residents
Median household income in Muncie, IN in 2022:
Muncie:
$40,968
Indiana:
$66,785
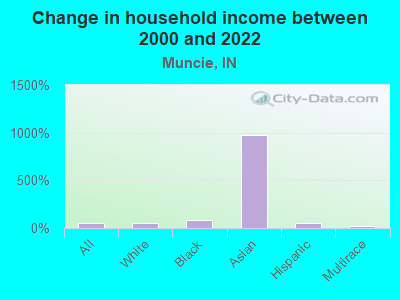
Change in median household income between 2000 and 2022:
Muncie, Indiana:
+53.9%
State:
+60.7%
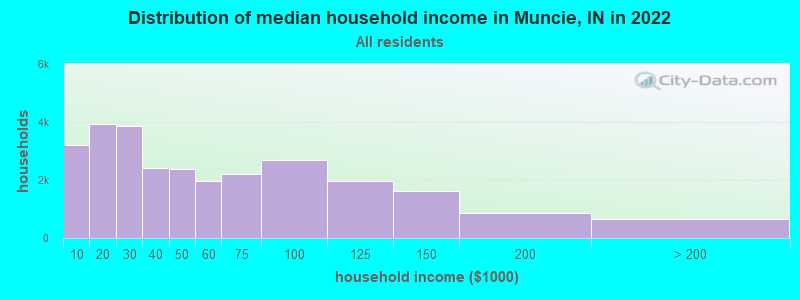
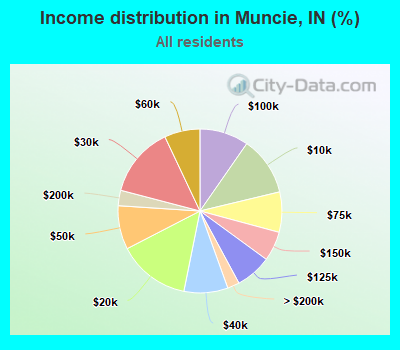
Number of households with income < $10k:
Muncie:
11.6% (3,212)
Indiana:
5.6% (151,905)
Number of households with income $10k - 20k:
Muncie:
14.2% (3,948)
State:
7.1% (193,665)
Number of households with income $20k - 30k:
Muncie:
13.9% (3,847)
Indiana:
7.8% (213,166)
Number of households with income $30k - 40k:
Muncie:
8.7% (2,404)
Indiana:
8.5% (231,051)
Number of households with income $40k - 50k:
Muncie:
8.6% (2,390)
Indiana:
8.4% (227,994)
Number of households with income $50k - 60k:
Muncie:
7.0% (1,949)
Indiana:
7.7% (210,699)
Number of households with income $60k - 75k:
Muncie:
8.0% (2,204)
State:
10.3% (279,665)
Number of households with income $75k - 100k:
Muncie:
9.7% (2,679)
State:
14.1% (383,225)
Number of households with income $100k - 125k:
Muncie:
7.1% (1,965)
Indiana:
10.3% (279,559)
Number of households with income $125k - 150k:
Muncie:
5.8% (1,617)
Indiana:
6.3% (172,553)
Number of households with income $150k - 200k:
Muncie:
3.0% (845)
State:
7.3% (198,086)
Number of households with income > $200k:
Muncie:
2.4% (656)
Indiana:
6.8% (184,921)
Aggregate household income in Muncie in 2022: $1,596,526,900
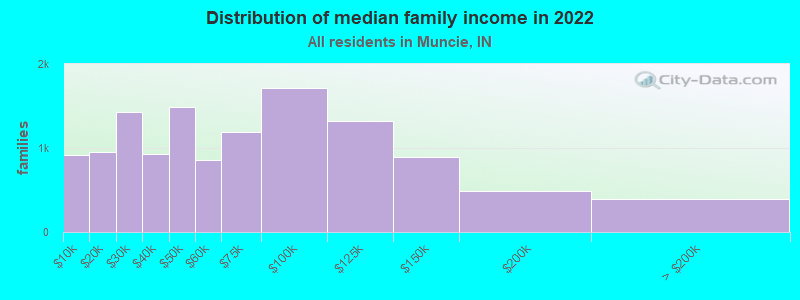
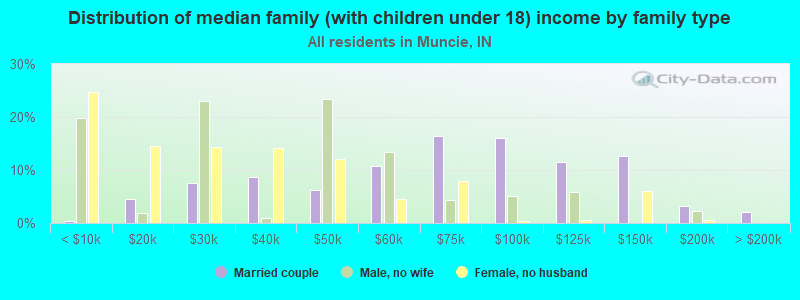
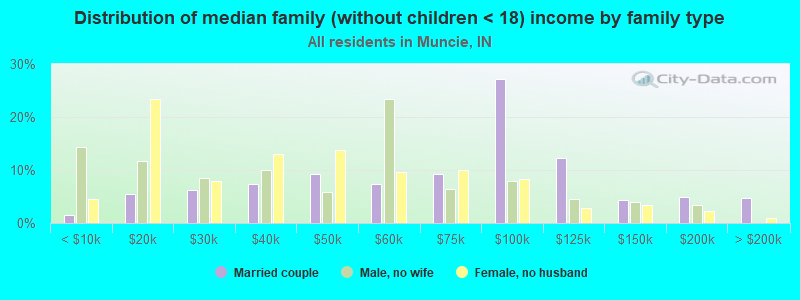
Median family income in Muncie in 2022:
Muncie:
$55,694
State:
$84,508
Number of families with income < $10k:
Muncie:
7.3% (919)
State:
3.5% (60,982)
Number of families with income $10k - 20k:
Muncie:
7.6% (949)
State:
3.8% (66,551)
Number of families with income $20k - 30k:
Muncie:
11.4% (1,427)
State:
4.7% (82,197)
Number of families with income $30k - 40k:
Muncie:
7.4% (924)
State:
6.2% (108,519)
Number of families with income $40k - 50k:
Muncie:
11.8% (1,486)
State:
7.3% (126,404)
Number of families with income $50k - 60k:
Muncie:
6.8% (858)
State:
7.4% (128,779)
Number of families with income $60k - 75k:
Muncie:
9.5% (1,189)
State:
10.7% (185,712)
Number of families with income $75k - 100k:
Muncie:
13.6% (1,713)
State:
16.1% (280,434)
Number of families with income $100k - 125k:
Muncie:
10.5% (1,323)
State:
12.7% (221,659)
Number of families with income $125k - 150k:
Muncie:
7.1% (887)
State:
8.2% (142,241)
Number of families with income $150k - 200k:
Muncie:
3.9% (487)
State:
9.9% (171,875)
Number of families with income > $200k:
Muncie:
3.1% (394)
Indiana:
9.5% (164,753)
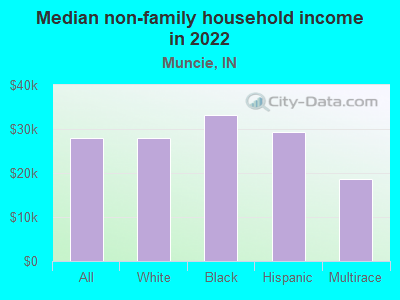
Median non-family income in Muncie in 2022:
Muncie:
$27,857
State:
$39,768
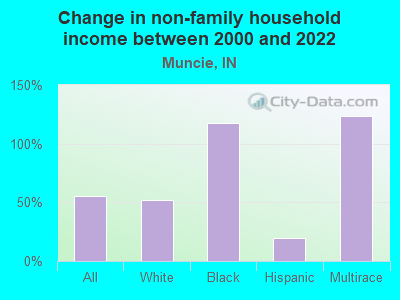
Change in median non-family income between 2000 and 2022:
Muncie, Indiana:
+54.8%
Indiana:
+67.9%
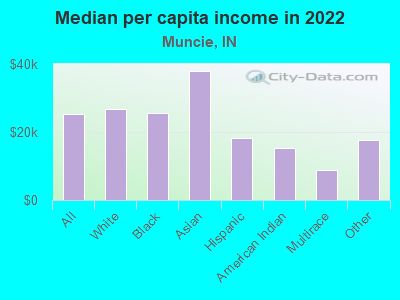
Median per capita income in Muncie in 2022:
Muncie:
$25,226
State:
$35,984
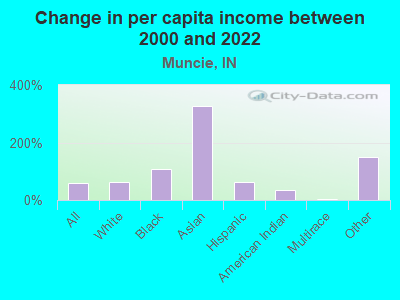
Change in median per capita income between 2000 and 2022:
Muncie, Indiana:
+59.5%
State:
+76.4%
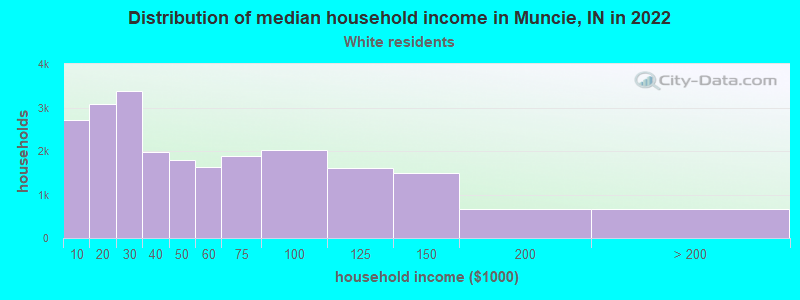
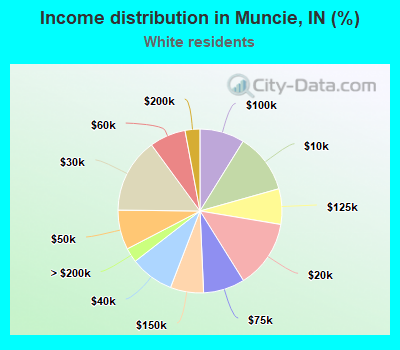
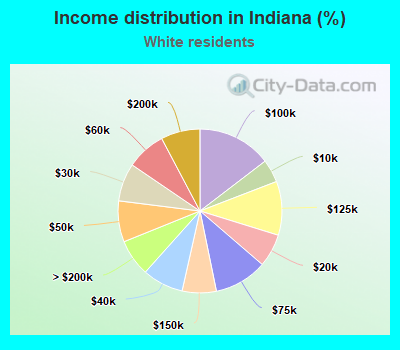
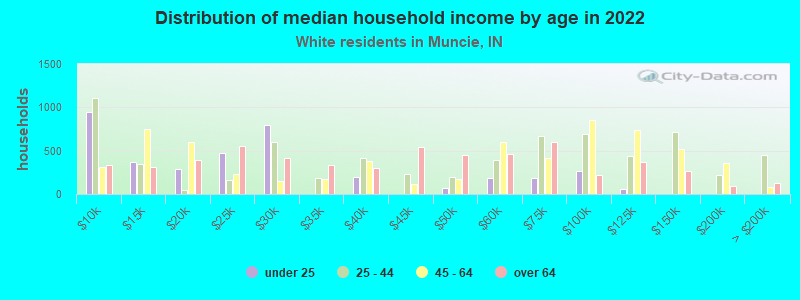
Income statistics for White residents
Median household income in Muncie, IN in 2022:
Muncie:
$41,063
State:
$70,619
Change in median household income between 2000 and 2022:
Muncie, Indiana:
+51.1%
Indiana:
+65.2%
Number of households with income < $10k:
Muncie:
11.8% (2,706)
Indiana:
4.5% (100,447)
Number of households with income $10k - 20k:
Muncie:
13.5% (3,090)
State:
6.5% (144,216)
Number of households with income $20k - 30k:
Muncie:
14.7% (3,382)
State:
7.5% (166,045)
Number of households with income $30k - 40k:
Muncie:
8.6% (1,983)
State:
8.1% (179,206)
Number of households with income $40k - 50k:
Muncie:
7.8% (1,794)
State:
8.1% (178,985)
Number of households with income $50k - 60k:
Muncie:
7.2% (1,640)
State:
7.8% (171,865)
Number of households with income $60k - 75k:
Muncie:
8.2% (1,875)
State:
10.5% (231,572)
Number of households with income $75k - 100k:
Muncie:
8.8% (2,025)
Indiana:
14.6% (323,007)
Number of households with income $100k - 125k:
Muncie:
7.0% (1,608)
State:
10.6% (235,112)
Number of households with income $125k - 150k:
Muncie:
6.6% (1,503)
State:
6.7% (148,936)
Number of households with income $150k - 200k:
Muncie:
2.9% (668)
State:
7.7% (170,750)
Number of households with income > $200k:
Muncie:
2.9% (656)
State:
7.3% (160,805)
Aggregate household income in Muncie in 2022: $1,356,209,600
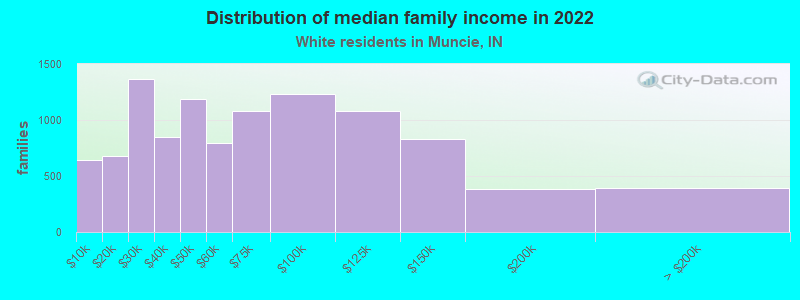
Median family income in Muncie in 2022:
Muncie:
$56,227
Indiana:
$88,109
Number of families with income < $10k:
Muncie:
6.1% (643)
Indiana:
2.5% (35,020)
Number of families with income $10k - 20k:
Muncie:
6.4% (676)
Indiana:
3.3% (47,383)
Number of families with income $20k - 30k:
Muncie:
13.0% (1,369)
State:
4.2% (60,156)
Number of families with income $30k - 40k:
Muncie:
8.1% (852)
Indiana:
5.8% (82,106)
Number of families with income $40k - 50k:
Muncie:
11.3% (1,187)
Indiana:
6.9% (98,385)
Number of families with income $50k - 60k:
Muncie:
7.5% (793)
State:
7.3% (104,303)
Number of families with income $60k - 75k:
Muncie:
10.2% (1,076)
State:
10.7% (152,202)
Number of families with income $75k - 100k:
Muncie:
11.7% (1,232)
State:
16.8% (237,844)
Number of families with income $100k - 125k:
Muncie:
10.3% (1,079)
State:
13.2% (187,178)
Number of families with income $125k - 150k:
Muncie:
7.9% (828)
Indiana:
8.6% (122,703)
Number of families with income $150k - 200k:
Muncie:
3.7% (387)
State:
10.5% (148,889)
Number of families with income > $200k:
Muncie:
3.7% (394)
Indiana:
10.1% (143,001)
Median non-family income in Muncie in 2022:
Muncie:
$27,987
State:
$41,009
Change in median non-family income between 2000 and 2022:
Muncie, Indiana:
+51.9%
Indiana:
+69.4%
Median per capita income in Muncie in 2022:
Muncie:
$26,650
Indiana:
$38,746
Change in median per capita income between 2000 and 2022:
Muncie, Indiana:
+61.4%
Indiana:
+82.8%
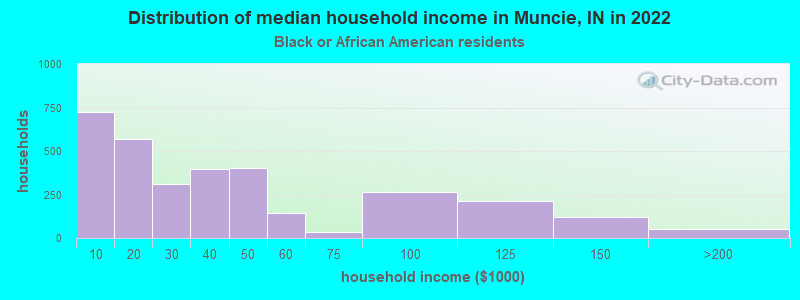
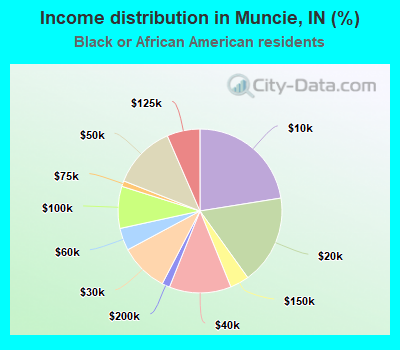
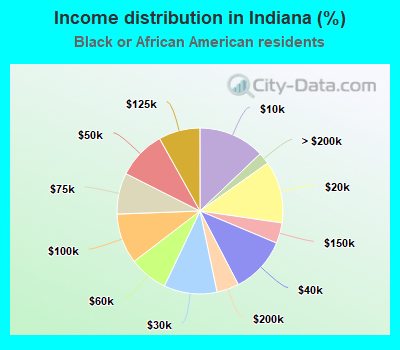
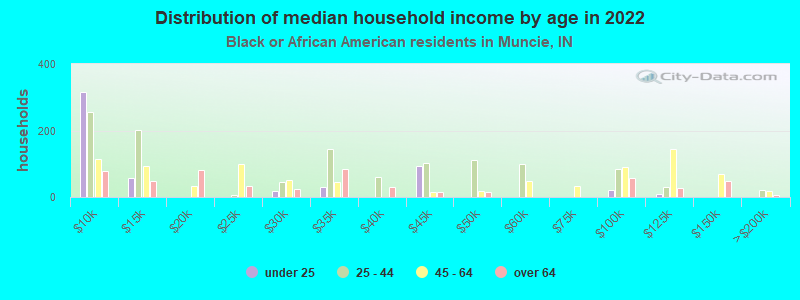
Income statistics for Black or African American residents
Median household income in Muncie, IN in 2022:
Muncie:
$40,224
State:
$43,638
Change in median household income between 2000 and 2022:
Muncie, Indiana:
+83.0%
State:
+49.6%
Number of households with income < $10k:
Muncie:
22.5% (725)
State:
12.9% (33,270)
Number of households with income $10k - 20k:
Muncie:
17.6% (568)
State:
12.1% (31,195)
Number of households with income $20k - 30k:
Muncie:
9.6% (308)
State:
10.4% (26,676)
Number of households with income $30k - 40k:
Muncie:
12.2% (394)
State:
11.0% (28,436)
Number of households with income $40k - 50k:
Muncie:
12.5% (403)
State:
9.5% (24,370)
Number of households with income $50k - 60k:
Muncie:
4.4% (142)
State:
7.5% (19,416)
Number of households with income $60k - 75k:
Muncie:
1.1% (36)
State:
8.0% (20,642)
Number of households with income $75k - 100k:
Muncie:
8.3% (267)
Indiana:
9.8% (25,235)
Number of households with income $100k - 125k:
Muncie:
6.5% (210)
Indiana:
8.1% (20,841)
Number of households with income $125k - 150k:
Muncie:
3.8% (121)
State:
4.0% (10,319)
Number of households with income $150k - 200k:
Muncie:
1.6% (50)
Indiana:
4.3% (11,187)
Number of households with income > $200k:
Muncie:
0.0% (0)
State:
2.3% (5,833)
Aggregate household income in Muncie in 2022: $113,515,800
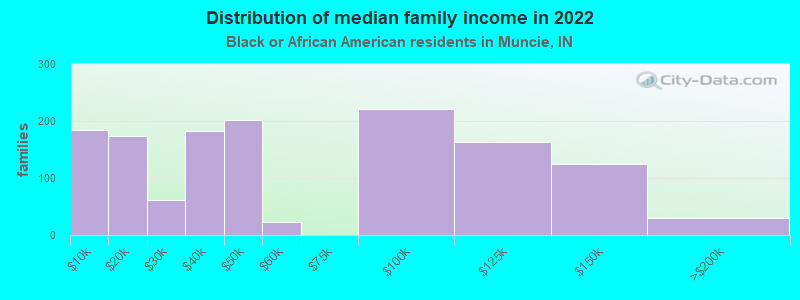
Median family income in Muncie in 2022:
Muncie:
$44,622
Indiana:
$55,405
Number of families with income < $10k:
Muncie:
13.5% (185)
Indiana:
10.9% (15,764)
Number of families with income $10k - 20k:
Muncie:
12.6% (173)
State:
7.8% (11,239)
Number of families with income $20k - 30k:
Muncie:
4.5% (61)
State:
7.9% (11,442)
Number of families with income $30k - 40k:
Muncie:
13.4% (183)
State:
9.0% (13,040)
Number of families with income $40k - 50k:
Muncie:
14.7% (201)
Indiana:
9.6% (13,856)
Number of families with income $50k - 60k:
Muncie:
1.7% (23)
Indiana:
8.1% (11,700)
Number of families with income $75k - 100k:
Muncie:
16.2% (221)
State:
11.1% (16,066)
Number of families with income $100k - 125k:
Muncie:
12.0% (164)
State:
10.7% (15,401)
Number of families with income $125k - 150k:
Muncie:
9.1% (124)
Indiana:
5.8% (8,303)
Number of families with income $150k - 200k:
Muncie:
2.2% (30)
State:
6.1% (8,745)
Median non-family income in Muncie in 2022:
Muncie:
$33,259
Indiana:
$31,410
Change in median non-family income between 2000 and 2022:
Muncie, Indiana:
+118.3%
Indiana:
+56.8%
Median per capita income in Muncie in 2022:
Muncie:
$25,620
State:
$25,414
Change in median per capita income between 2000 and 2022:
Muncie, Indiana:
+107.3%
State:
+68.9%
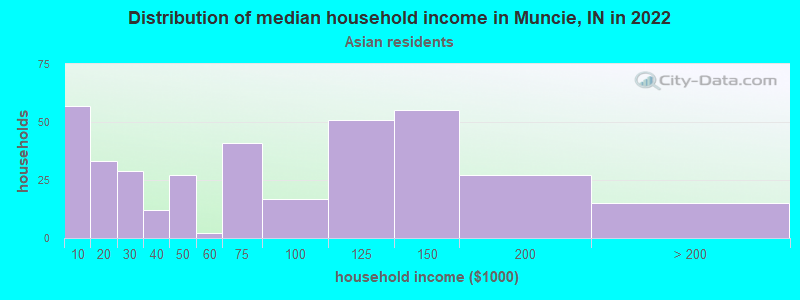
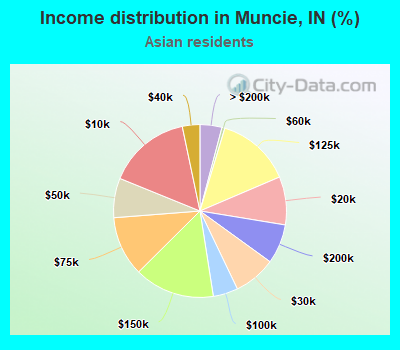
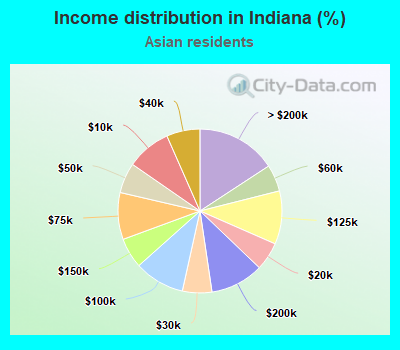
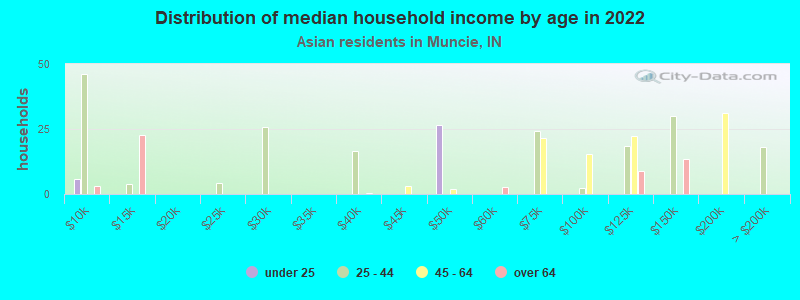
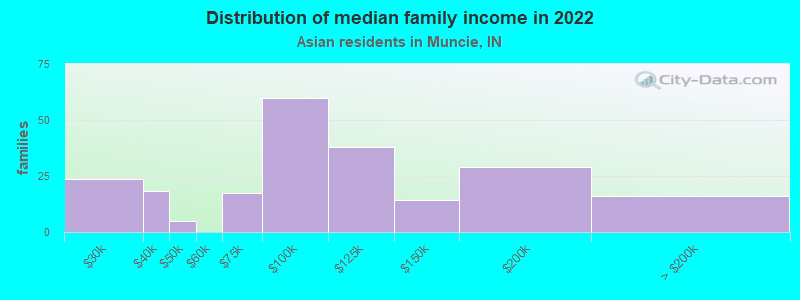
Income statistics for Asian residents
Median household income in Muncie, IN in 2022:
Muncie:
$83,263
State:
$83,010
Number of households with income < $10k:
Muncie:
15.6% (57)
State:
8.8% (4,794)
Number of households with income $10k - 20k:
Muncie:
9.0% (33)
State:
5.6% (3,049)
Number of households with income $20k - 30k:
Muncie:
7.9% (29)
State:
5.8% (3,176)
Number of households with income $30k - 40k:
Muncie:
3.3% (12)
State:
6.6% (3,602)
Number of households with income $40k - 50k:
Muncie:
7.4% (27)
State:
6.0% (3,269)
Number of households with income $50k - 60k:
Muncie:
0.5% (2)
State:
5.3% (2,888)
Number of households with income $60k - 75k:
Muncie:
11.2% (41)
Indiana:
9.3% (5,056)
Number of households with income $75k - 100k:
Muncie:
4.6% (17)
Indiana:
9.9% (5,425)
Number of households with income $100k - 125k:
Muncie:
13.9% (51)
State:
10.5% (5,738)
Number of households with income $125k - 150k:
Muncie:
15.0% (55)
State:
6.0% (3,266)
Number of households with income $150k - 200k:
Muncie:
7.4% (27)
State:
10.5% (5,738)
Number of households with income > $200k:
Muncie:
4.1% (15)
Indiana:
15.8% (8,618)
Aggregate household income in Muncie in 2022: $27,675,600
Median family income in Muncie in 2022:
Muncie:
$84,132
State:
$103,261
Number of families with income $20k - 30k:
Muncie:
10.8% (24)
State:
3.4% (1,330)
Number of families with income $30k - 40k:
Muncie:
8.3% (18)
State:
6.8% (2,631)
Number of families with income $40k - 50k:
Muncie:
2.1% (5)
State:
5.8% (2,242)
Number of families with income $60k - 75k:
Muncie:
7.8% (17)
State:
9.5% (3,666)
Number of families with income $75k - 100k:
Muncie:
27.1% (60)
State:
10.2% (3,955)
Number of families with income $100k - 125k:
Muncie:
17.2% (38)
State:
11.7% (4,516)
Number of families with income $125k - 150k:
Muncie:
6.4% (14)
State:
7.5% (2,915)
Number of families with income $150k - 200k:
Muncie:
13.1% (29)
State:
13.5% (5,212)
Number of families with income > $200k:
Muncie:
7.2% (16)
State:
21.5% (8,321)
Median per capita income in Muncie in 2022:
Muncie:
$37,905
State:
$41,211
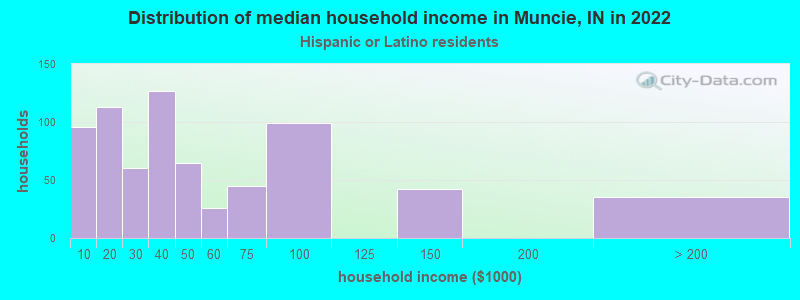
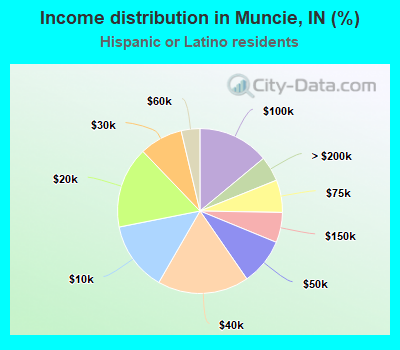
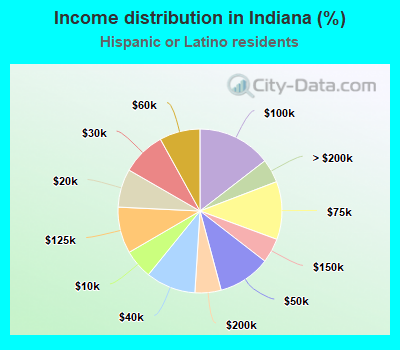
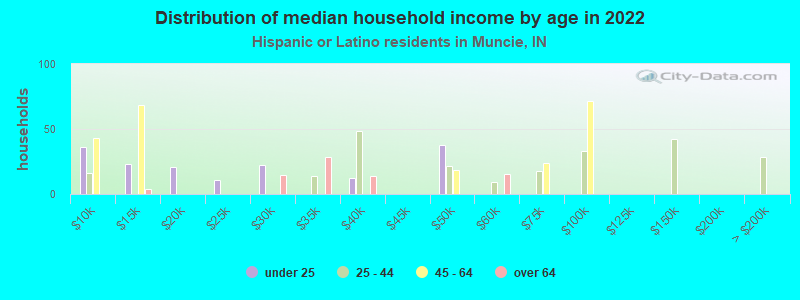
Income statistics for Hispanic or Latino residents
Median household income in Muncie, IN in 2022:
Muncie:
$30,014
Indiana:
$59,737
Change in median household income between 2000 and 2022:
Muncie, Indiana:
+52.3%
State:
+60.8%
Number of households with income < $10k:
Muncie:
13.6% (96)
State:
5.8% (8,513)
Number of households with income $10k - 20k:
Muncie:
16.0% (113)
State:
7.6% (11,151)
Number of households with income $20k - 30k:
Muncie:
8.5% (60)
State:
8.7% (12,768)
Number of households with income $30k - 40k:
Muncie:
17.9% (127)
Indiana:
9.8% (14,507)
Number of households with income $40k - 50k:
Muncie:
9.2% (65)
State:
10.4% (15,272)
Number of households with income $50k - 60k:
Muncie:
3.7% (26)
State:
8.0% (11,829)
Number of households with income $60k - 75k:
Muncie:
6.4% (45)
State:
11.4% (16,875)
Number of households with income $75k - 100k:
Muncie:
14.0% (99)
State:
14.5% (21,434)
Number of households with income $100k - 125k:
Muncie:
0.0% (0)
Indiana:
9.2% (13,525)
Number of households with income $125k - 150k:
Muncie:
5.9% (42)
State:
4.9% (7,171)
Number of households with income $150k - 200k:
Muncie:
0.0% (0)
State:
5.2% (7,618)
Number of households with income > $200k:
Muncie:
4.9% (35)
State:
4.7% (6,892)
Aggregate household income in Muncie in 2022: $20,829,500
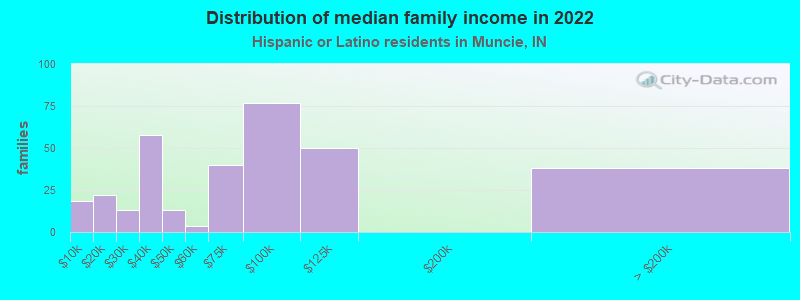
Median family income in Muncie in 2022:
Muncie:
$69,260
State:
$67,946
Number of families with income < $10k:
Muncie:
5.5% (18)
Indiana:
5.5% (5,742)
Number of families with income $10k - 20k:
Muncie:
6.6% (22)
Indiana:
6.0% (6,301)
Number of families with income $20k - 30k:
Muncie:
3.9% (13)
State:
7.4% (7,835)
Number of families with income $30k - 40k:
Muncie:
17.4% (58)
Indiana:
8.0% (8,423)
Number of families with income $40k - 50k:
Muncie:
4.0% (13)
Indiana:
8.8% (9,234)
Number of families with income $50k - 60k:
Muncie:
1.0% (3)
State:
8.1% (8,509)
Number of families with income $60k - 75k:
Muncie:
12.0% (40)
Indiana:
11.8% (12,426)
Number of families with income $75k - 100k:
Muncie:
23.1% (77)
Indiana:
16.8% (17,634)
Number of families with income $100k - 125k:
Muncie:
15.1% (50)
State:
9.8% (10,348)
Number of families with income > $200k:
Muncie:
11.4% (38)
State:
5.8% (6,146)
Median non-family income in Muncie in 2022:
Muncie:
$29,382
State:
$39,475
Change in median non-family income between 2000 and 2022:
Muncie, Indiana:
+19.7%
Indiana:
+68.5%
Median per capita income in Muncie in 2022:
Muncie:
$18,120
Indiana:
$22,779
Change in median per capita income between 2000 and 2022:
Muncie, Indiana:
+63.8%
State:
+76.3%
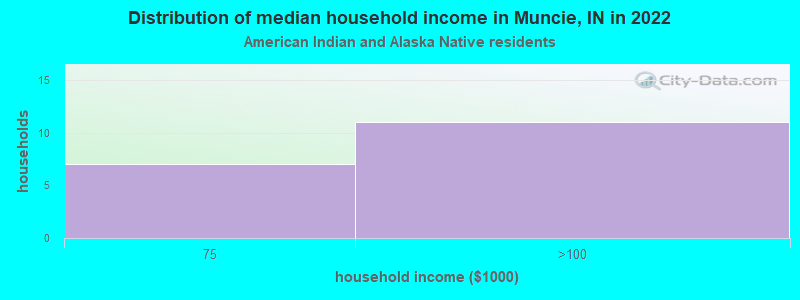
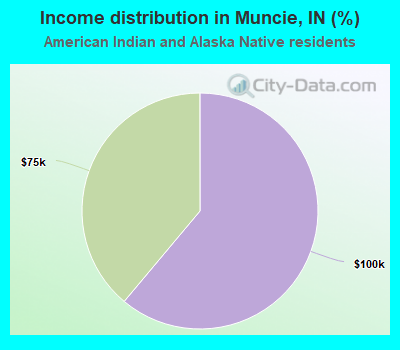
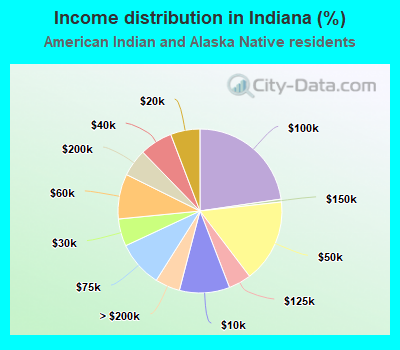
Income statistics for American Indian and Alaska Native residents
Number of households with income < $10k:
Muncie:
0.0% (0)
State:
9.9% (859)
Number of households with income $10k - 20k:
Muncie:
0.0% (0)
State:
5.8% (503)
Number of households with income $20k - 30k:
Muncie:
0.0% (0)
Indiana:
5.4% (467)
Number of households with income $30k - 40k:
Muncie:
0.0% (0)
State:
6.5% (560)
Number of households with income $40k - 50k:
Muncie:
0.0% (0)
Indiana:
16.4% (1,423)
Number of households with income $50k - 60k:
Muncie:
0.0% (0)
State:
8.9% (769)
Number of households with income $60k - 75k:
Muncie:
38.9% (7)
State:
9.1% (788)
Number of households with income $75k - 100k:
Muncie:
61.1% (11)
State:
22.7% (1,966)
Number of households with income $100k - 125k:
Muncie:
0.0% (0)
State:
4.5% (387)
Number of households with income $125k - 150k:
Muncie:
0.0% (0)
State:
0.6% (49)
Number of households with income $150k - 200k:
Muncie:
0.0% (0)
Indiana:
5.4% (469)
Number of households with income > $200k:
Muncie:
0.0% (0)
State:
4.9% (425)
Aggregate household income in Muncie in 2022: $1,691,259
Median per capita income in Muncie in 2022:
Muncie:
$15,366
State:
$27,558
Change in median per capita income between 2000 and 2022:
Muncie, Indiana:
+34.4%
State:
+66.2%
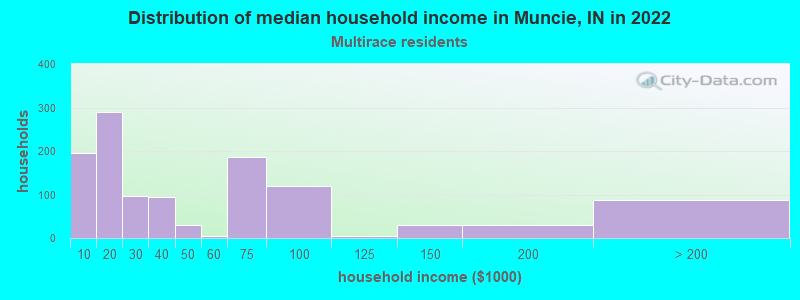
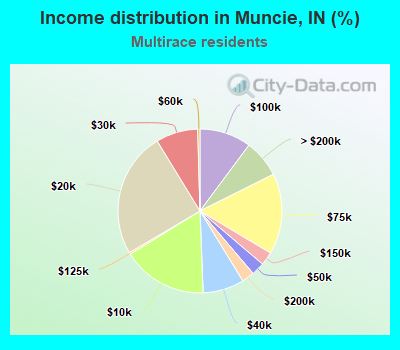
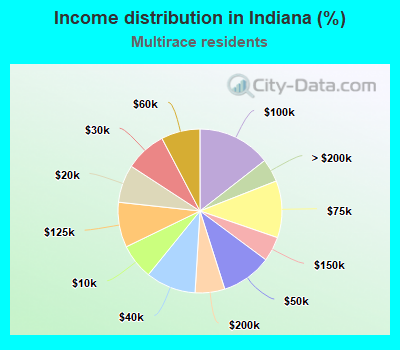
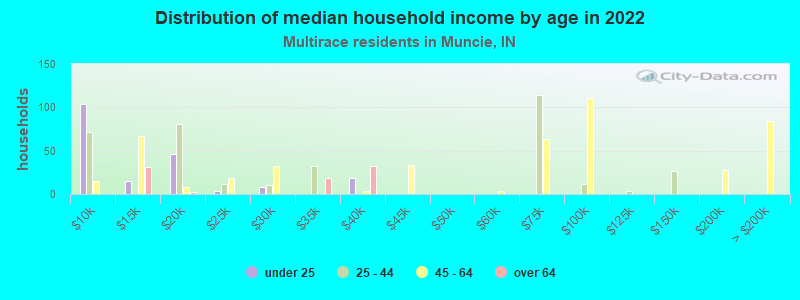
Income statistics for Multirace residents
Median household income in Muncie, IN in 2022:
Muncie:
$30,471
Indiana:
$59,942
Change in median household income between 2000 and 2022:
Muncie, Indiana:
+18.1%
Indiana:
+85.6%
Number of households with income < $10k:
Muncie:
16.8% (196)
Indiana:
7.0% (9,131)
Number of households with income $10k - 20k:
Muncie:
24.7% (289)
State:
7.5% (9,781)
Number of households with income $20k - 30k:
Muncie:
8.3% (97)
Indiana:
8.1% (10,666)
Number of households with income $30k - 40k:
Muncie:
8.1% (95)
State:
9.9% (12,947)
Number of households with income $40k - 50k:
Muncie:
2.6% (30)
State:
9.9% (13,028)
Number of households with income $50k - 60k:
Muncie:
0.4% (5)
State:
7.7% (10,076)
Number of households with income $60k - 75k:
Muncie:
15.9% (186)
State:
11.2% (14,741)
Number of households with income $75k - 100k:
Muncie:
10.2% (119)
Indiana:
14.5% (18,959)
Number of households with income $100k - 125k:
Muncie:
0.3% (4)
Indiana:
8.9% (11,697)
Number of households with income $125k - 150k:
Muncie:
2.7% (31)
State:
4.9% (6,406)
Number of households with income $150k - 200k:
Muncie:
2.5% (29)
State:
5.9% (7,688)
Number of households with income > $200k:
Muncie:
7.4% (87)
State:
4.6% (6,026)
Aggregate household income in Muncie in 2022: $79,579,700
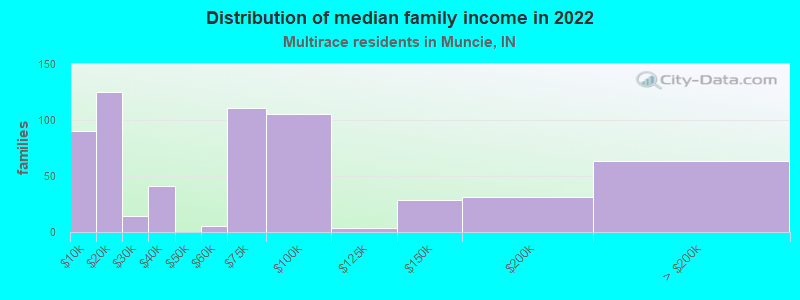
Median family income in Muncie in 2022:
Muncie:
$70,292
Indiana:
$70,519
Number of families with income < $10k:
Muncie:
14.5% (90)
State:
7.8% (6,802)
Number of families with income $10k - 20k:
Muncie:
20.2% (125)
State:
4.7% (4,071)
Number of families with income $20k - 30k:
Muncie:
2.2% (14)
State:
5.8% (5,034)
Number of families with income $30k - 40k:
Muncie:
6.6% (41)
Indiana:
6.6% (5,746)
Number of families with income $50k - 60k:
Muncie:
0.8% (5)
Indiana:
8.1% (7,047)
Number of families with income $60k - 75k:
Muncie:
18.0% (111)
State:
11.7% (10,192)
Number of families with income $75k - 100k:
Muncie:
16.9% (105)
State:
16.4% (14,276)
Number of families with income $100k - 125k:
Muncie:
0.7% (4)
State:
10.9% (9,477)
Number of families with income $125k - 150k:
Muncie:
4.7% (29)
State:
5.8% (5,065)
Number of families with income $150k - 200k:
Muncie:
5.0% (31)
Indiana:
7.8% (6,758)
Number of families with income > $200k:
Muncie:
10.3% (63)
Indiana:
6.1% (5,274)
Median non-family income in Muncie in 2022:
Muncie:
$18,712
State:
$38,166
Change in median non-family income between 2000 and 2022:
Muncie, Indiana:
+123.7%
Indiana:
+84.7%
Median per capita income in Muncie in 2022:
Muncie:
$8,872
State:
$23,668
Change in median per capita income between 2000 and 2022:
Muncie, Indiana:
+4.2%
Indiana:
+108.5%
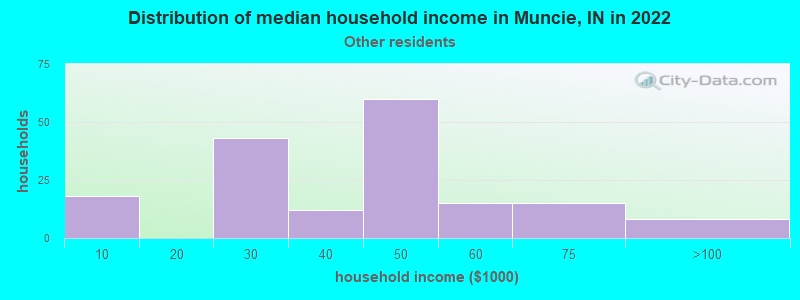
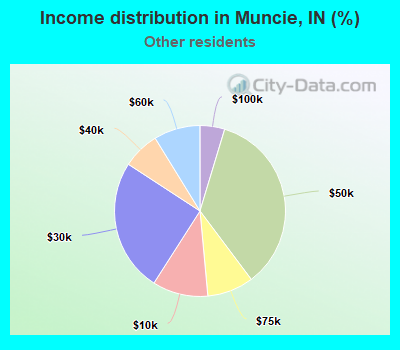
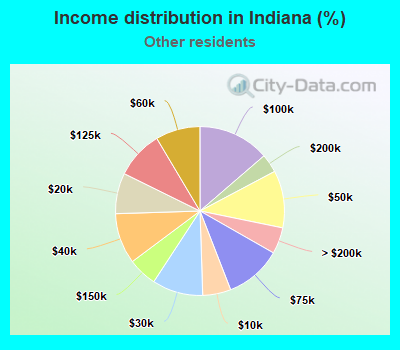
Income statistics for other residents
Median household income in Muncie, IN in 2022:
Muncie:
$41,050
State:
$56,644
Number of households with income < $10k:
Muncie:
10.5% (18)
Indiana:
5.4% (3,404)
Number of households with income $10k - 20k:
Muncie:
0.0% (0)
Indiana:
7.8% (4,921)
Number of households with income $20k - 30k:
Muncie:
25.1% (43)
Indiana:
9.7% (6,136)
Number of households with income $30k - 40k:
Muncie:
7.0% (12)
State:
9.7% (6,125)
Number of households with income $40k - 50k:
Muncie:
35.1% (60)
State:
11.0% (6,919)
Number of households with income $50k - 60k:
Muncie:
8.8% (15)
State:
8.5% (5,388)
Number of households with income $60k - 75k:
Muncie:
8.8% (15)
Indiana:
10.8% (6,838)
Number of households with income $75k - 100k:
Muncie:
4.7% (8)
State:
13.7% (8,633)
Number of households with income $100k - 125k:
Muncie:
0.0% (0)
State:
9.2% (5,784)
Number of households with income $125k - 150k:
Muncie:
0.0% (0)
Indiana:
5.6% (3,523)
Number of households with income $150k - 200k:
Muncie:
0.0% (0)
Indiana:
3.6% (2,254)
Number of households with income > $200k:
Muncie:
0.0% (0)
State:
5.0% (3,185)
Aggregate household income in Muncie in 2022: $14,404,190
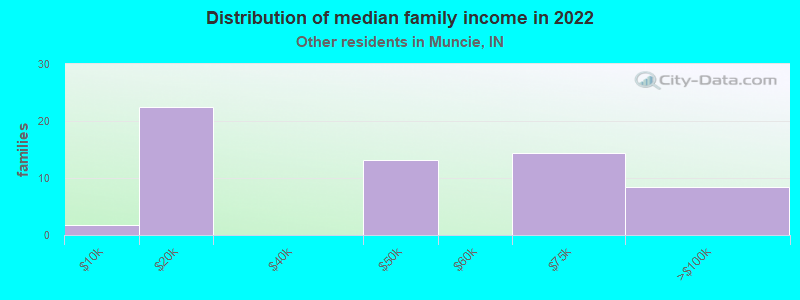
Median family income in Muncie in 2022:
Muncie:
$73,662
Indiana:
$64,622
Number of families with income < $10k:
Muncie:
3.0% (2)
State:
4.1% (1,855)
Number of families with income $10k - 20k:
Muncie:
37.3% (22)
State:
6.2% (2,796)
Number of families with income $40k - 50k:
Muncie:
21.9% (13)
Indiana:
8.7% (3,962)
Number of families with income $60k - 75k:
Muncie:
23.9% (14)
State:
11.3% (5,157)
Number of families with income $75k - 100k:
Muncie:
13.9% (8)
State:
15.0% (6,824)
Median per capita income in Muncie in 2022:
Muncie:
$17,611
State:
$23,719
Change in median per capita income between 2000 and 2022:
Muncie, Indiana:
+148.6%
Indiana:
+99.6%
Discuss Muncie, Indiana (IN) on our hugely popular Indiana forum.