The median household income in Neapolis, OH in 2022 was $102,634, which was 36.0% greater than the median annual income of $65,720 across the entire state of Ohio. Compared to the median income of $38,004 in 2000 this represents an increase of 63.0%. The per capita income in 2022 was $39,811, which means an increase of 48.5% compared to 2000 when it was $20,518.
Whole page based on the data from 2000 / 2022 when the population of Neapolis, Ohio was 423 / 622
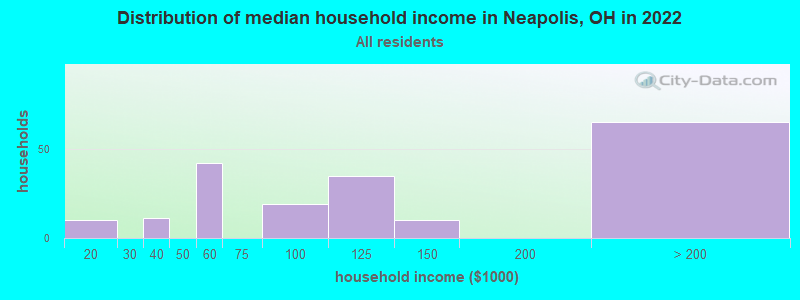
Income statistics for all residents
Median household income in Neapolis, OH in 2022:
Neapolis:
$102,634
State:
$65,720
Number of households with income < $10k:
Neapolis:
0.0% (0)
State:
5.9% (286,511)
Number of households with income $10k - 20k:
Neapolis:
5.2% (10)
State:
8.0% (392,234)
Number of households with income $20k - 30k:
Neapolis:
0.0% (0)
State:
7.8% (380,130)
Number of households with income $30k - 40k:
Neapolis:
5.7% (11)
Ohio:
8.3% (405,713)
Number of households with income $40k - 50k:
Neapolis:
0.0% (0)
State:
8.0% (388,158)
Number of households with income $50k - 60k:
Neapolis:
21.9% (42)
Ohio:
7.7% (378,045)
Number of households with income $60k - 75k:
Neapolis:
0.0% (0)
State:
10.0% (488,380)
Number of households with income $75k - 100k:
Neapolis:
9.9% (19)
Ohio:
13.2% (643,774)
Number of households with income $100k - 125k:
Neapolis:
18.2% (35)
State:
9.6% (467,137)
Number of households with income $125k - 150k:
Neapolis:
5.2% (10)
State:
6.4% (314,382)
Number of households with income $150k - 200k:
Neapolis:
0.0% (0)
State:
7.4% (359,847)
Number of households with income > $200k:
Neapolis:
33.9% (65)
Ohio:
7.7% (373,895)
Aggregate household income in Neapolis in 2022: $22,145,374
Median non-family income in Neapolis in 2022:
Neapolis:
$32,982
State:
$40,164
Change in median non-family income between 2000 and 2022:
Neapolis, Ohio:
+43.3%
State:
+67.3%
Median per capita income in Neapolis in 2022:
Neapolis:
$39,811
State:
$37,932
Change in median per capita income between 2000 and 2022:
Neapolis, Ohio:
+94.0%
Ohio:
+80.6%
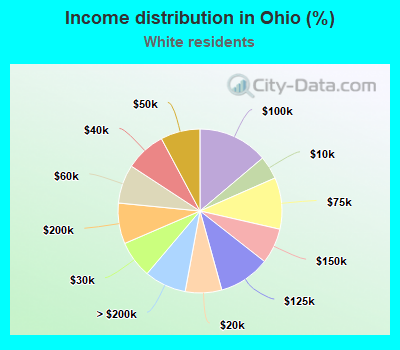
Income statistics for White residents
Median household income in Neapolis, OH in 2022:
Neapolis:
$98,693
Ohio:
$70,749
Change in median household income between 2000 and 2022:
Neapolis, Ohio:
+138.0%
State:
+65.2%
Number of households with income < $10k:
Neapolis:
0.0% (0)
State:
4.6% (178,598)
Number of households with income $10k - 20k:
Neapolis:
6.6% (12)
State:
7.2% (279,908)
Number of households with income $20k - 30k:
Neapolis:
0.0% (0)
State:
7.3% (285,935)
Number of households with income $30k - 40k:
Neapolis:
6.0% (11)
State:
8.0% (310,871)
Number of households with income $40k - 50k:
Neapolis:
0.0% (0)
State:
7.8% (303,221)
Number of households with income $50k - 60k:
Neapolis:
21.9% (40)
State:
7.7% (297,864)
Number of households with income $60k - 75k:
Neapolis:
0.0% (0)
Ohio:
10.2% (395,379)
Number of households with income $75k - 100k:
Neapolis:
10.4% (19)
State:
13.8% (538,093)
Number of households with income $100k - 125k:
Neapolis:
16.4% (30)
Ohio:
10.1% (394,658)
Number of households with income $125k - 150k:
Neapolis:
5.5% (10)
State:
7.0% (272,471)
Number of households with income $150k - 200k:
Neapolis:
0.0% (0)
State:
8.0% (312,939)
Number of households with income > $200k:
Neapolis:
33.3% (61)
State:
8.3% (321,654)
Aggregate household income in Neapolis in 2022: $21,399,064
Median non-family income in Neapolis in 2022:
Neapolis:
$31,948
State:
$42,037
Change in median non-family income between 2000 and 2022:
Neapolis, Ohio:
+28.4%
Ohio:
+68.0%
Median per capita income in Neapolis in 2022:
Neapolis:
$39,710
State:
$40,927
Change in median per capita income between 2000 and 2022:
Neapolis, Ohio:
+75.8%
State:
+85.3%
Income statistics for Hispanic or Latino residents
Median per capita income in Neapolis in 2022:
Neapolis:
$9,126
Ohio:
$25,336
Change in median per capita income between 2000 and 2022:: -27.8%
Neapolis, Ohio:
-27.8%
State:
+87.1%
Discuss Neapolis, Ohio (OH) on our hugely popular Ohio forum.