Nesbitt, Texas (TX) income map, earnings map, and wages data

Data:
The per capita income in 2022 was $41,702, which means an increase of 60.1% compared to 2000 when it was $16,632.
Whole page based on the data from 2000 / 2022 when the population of Nesbitt, Texas was 302 / 213
Income statistics for all residents
Number of households with income < $10k:| Nesbitt: | 0.0% (0) |
| State: | 5.5% (611,011) |
Number of households with income $10k - 20k:| Nesbitt: | 0.0% (0) |
| State: | 6.7% (743,157) |
Number of households with income $20k - 30k:| Nesbitt: | 0.0% (0) |
| Texas: | 7.2% (803,381) |
Number of households with income $30k - 40k:| Nesbitt: | 0.0% (0) |
| Texas: | 7.8% (866,080) |
Number of households with income $40k - 50k:| Nesbitt: | 0.0% (0) |
| State: | 7.3% (810,440) |
Number of households with income $50k - 60k:| Nesbitt: | 0.0% (0) |
| Texas: | 7.2% (799,783) |
Number of households with income $60k - 75k:| Nesbitt: | 0.0% (0) |
| Texas: | 9.9% (1,095,384) |
Number of households with income $75k - 100k:| Nesbitt: | 0.0% (0) |
| State: | 12.8% (1,419,057) |
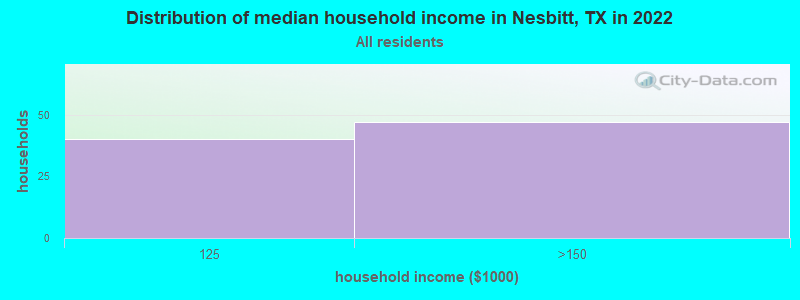
Number of households with income $100k - 125k:| Nesbitt: | 46.0% (40) |
| State: | 9.5% (1,054,577) |
Number of households with income $125k - 150k:| Nesbitt: | 54.0% (47) |
| Texas: | 6.7% (741,518) |
Number of households with income $150k - 200k:| Nesbitt: | 0.0% (0) |
| State: | 8.7% (961,776) |
Number of households with income > $200k:| Nesbitt: | 0.0% (0) |
| State: | 10.7% (1,181,544) |
Aggregate household income in Nesbitt in 2022: $11,133,892
Median per capita income in Nesbitt in 2022:| Nesbitt: | $41,702 |
| State: | $38,123 |
Income statistics for White residents
Median per capita income in Nesbitt in 2022:| Nesbitt: | $42,153 |
| State: | $47,740 |
Change in median per capita income between 2000 and 2022:| Nesbitt, Texas: | +149.8% |
| State: | +114.3% |
Income statistics for Black or African American residents
Number of households with income < $10k:| Nesbitt: | 0.0% (0) |
| Texas: | 8.9% (126,378) |
Number of households with income $10k - 20k:| Nesbitt: | 0.0% (0) |
| State: | 9.9% (140,369) |
Number of households with income $20k - 30k:| Nesbitt: | 0.0% (0) |
| State: | 8.5% (120,639) |
Number of households with income $30k - 40k:| Nesbitt: | 0.0% (0) |
| State: | 9.7% (137,517) |
Number of households with income $40k - 50k:| Nesbitt: | 0.0% (0) |
| State: | 8.0% (112,973) |
Number of households with income $50k - 60k:| Nesbitt: | 0.0% (0) |
| State: | 8.3% (117,156) |
Number of households with income $60k - 75k:| Nesbitt: | 0.0% (0) |
| State: | 10.4% (147,462) |
Number of households with income $75k - 100k:| Nesbitt: | 0.0% (0) |
| State: | 11.5% (162,718) |
Number of households with income $100k - 125k:| Nesbitt: | 100.0% (39) |
| State: | 8.2% (115,829) |
Number of households with income $125k - 150k:| Nesbitt: | 0.0% (0) |
| State: | 4.9% (69,556) |
Number of households with income $150k - 200k:| Nesbitt: | 0.0% (0) |
| State: | 6.4% (90,701) |
Number of households with income > $200k:| Nesbitt: | 0.0% (0) |
| Texas: | 5.5% (77,988) |
Aggregate household income in Nesbitt in 2022: $2,092,024
Median per capita income in Nesbitt in 2022:| Nesbitt: | $45,686 |
| State: | $30,490 |