The median household income in New Baltimore, MI in 2022 was $89,971, which was 25.5% greater than the median annual income of $66,986 across the entire state of Michigan. Compared to the median income of $60,699 in 2000 this represents an increase of 32.5%. The per capita income in 2022 was $40,572, which means an increase of 33.6% compared to 2000 when it was $26,921.
Whole page based on the data from 2000 / 2022 when the population of New Baltimore, Michigan was 7,405 / 12,045
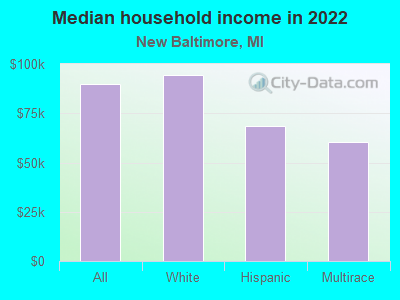
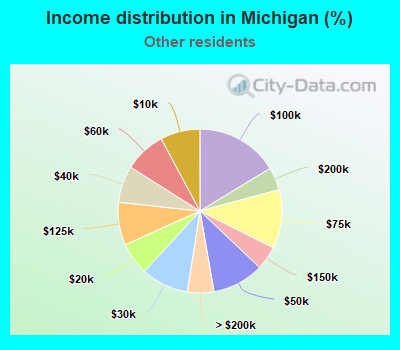
Income statistics for all residents
Median household income in New Baltimore, MI in 2022:
New Baltimore:
$89,972
State:
$66,986
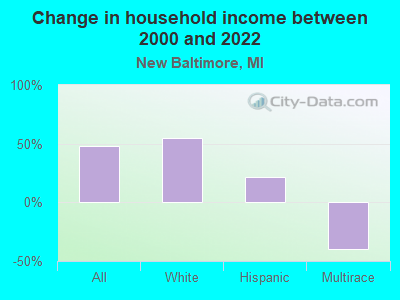
Change in median household income between 2000 and 2022:
New Baltimore, Michigan:
+48.2%
State:
+50.0%
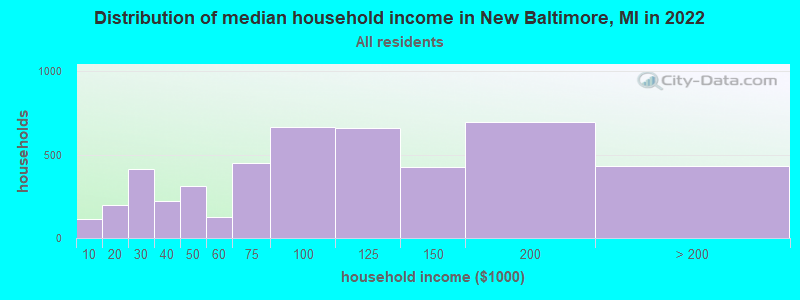
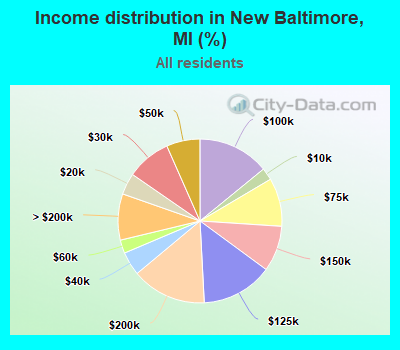
Number of households with income < $10k:
New Baltimore:
2.4% (113)
State:
5.7% (231,223)
Number of households with income $10k - 20k:
New Baltimore:
4.3% (200)
Michigan:
7.5% (306,955)
Number of households with income $20k - 30k:
New Baltimore:
8.8% (412)
State:
7.9% (324,153)
Number of households with income $30k - 40k:
New Baltimore:
4.7% (220)
State:
8.3% (341,408)
Number of households with income $40k - 50k:
New Baltimore:
6.6% (311)
State:
7.9% (322,255)
Number of households with income $50k - 60k:
New Baltimore:
2.6% (123)
Michigan:
7.5% (305,914)
Number of households with income $60k - 75k:
New Baltimore:
9.5% (449)
Michigan:
10.1% (414,440)
Number of households with income $75k - 100k:
New Baltimore:
14.1% (663)
State:
13.2% (538,299)
Number of households with income $100k - 125k:
New Baltimore:
14.1% (662)
State:
9.7% (396,282)
Number of households with income $125k - 150k:
New Baltimore:
9.0% (425)
Michigan:
6.7% (273,144)
Number of households with income $150k - 200k:
New Baltimore:
14.8% (695)
Michigan:
7.5% (305,077)
Number of households with income > $200k:
New Baltimore:
9.1% (429)
State:
8.1% (330,644)
Aggregate household income in New Baltimore in 2022: $493,331,429
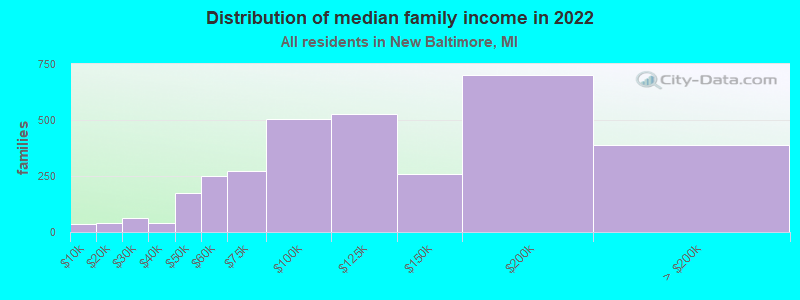
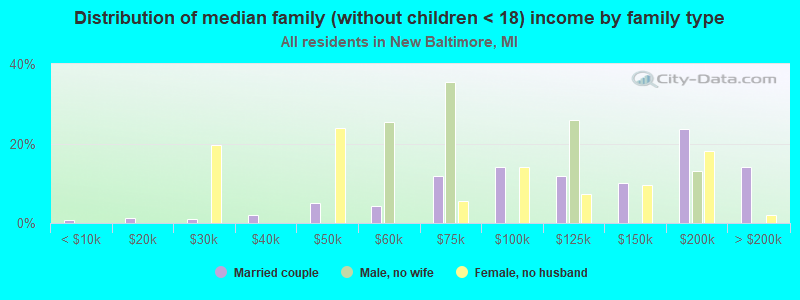
Median family income in New Baltimore in 2022:
New Baltimore:
$111,099
State:
$85,865
Number of families with income < $10k:
New Baltimore:
1.1% (35)
State:
3.5% (89,010)
Number of families with income $10k - 20k:
New Baltimore:
1.3% (41)
State:
3.9% (100,567)
Number of families with income $20k - 30k:
New Baltimore:
2.0% (64)
State:
5.0% (127,320)
Number of families with income $30k - 40k:
New Baltimore:
1.3% (42)
Michigan:
6.4% (163,565)
Number of families with income $40k - 50k:
New Baltimore:
5.3% (173)
State:
6.8% (172,384)
Number of families with income $50k - 60k:
New Baltimore:
7.7% (251)
Michigan:
7.1% (179,870)
Number of families with income $60k - 75k:
New Baltimore:
8.4% (274)
State:
10.3% (263,723)
Number of families with income $75k - 100k:
New Baltimore:
15.4% (503)
Michigan:
15.0% (383,364)
Number of families with income $100k - 125k:
New Baltimore:
16.2% (528)
Michigan:
11.8% (301,751)
Number of families with income $125k - 150k:
New Baltimore:
7.9% (258)
Michigan:
8.6% (220,338)
Number of families with income $150k - 200k:
New Baltimore:
21.5% (702)
Michigan:
10.2% (259,462)
Number of families with income > $200k:
New Baltimore:
11.9% (389)
State:
11.3% (287,206)
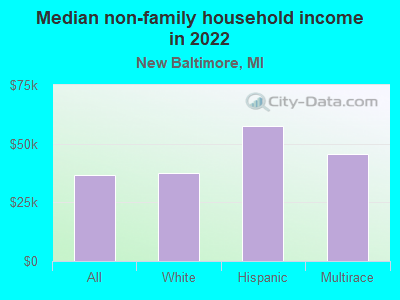
Median non-family income in New Baltimore in 2022:
New Baltimore:
$36,603
State:
$40,459
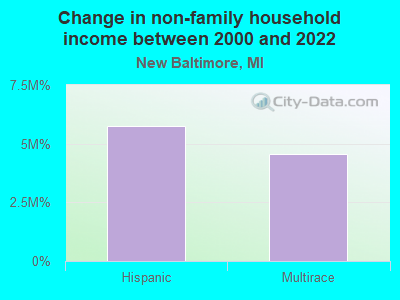
Change in median non-family income between 2000 and 2022:
New Baltimore, Michigan:
+21.5%
State:
+54.5%
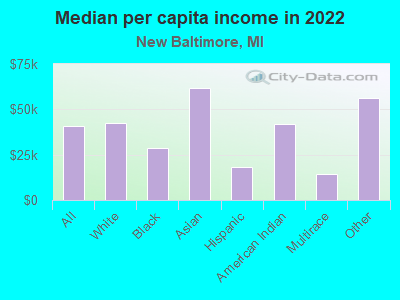
Median per capita income in New Baltimore in 2022:
New Baltimore:
$40,573
State:
$38,151
Change in median per capita income between 2000 and 2022:
New Baltimore, Michigan:
+50.7%
State:
+72.1%
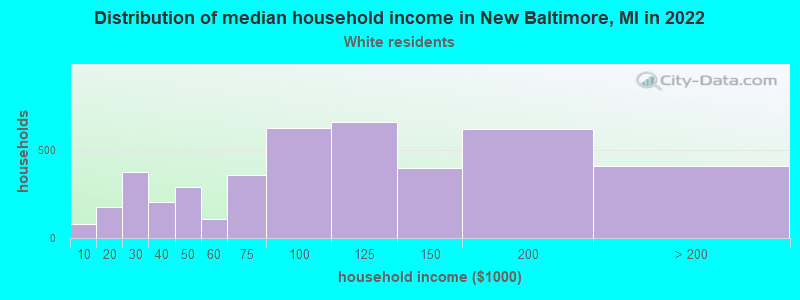
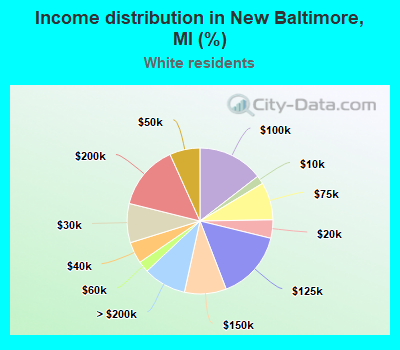
Income statistics for White residents
Median household income in New Baltimore, MI in 2022:
New Baltimore:
$94,474
State:
$71,609
Change in median household income between 2000 and 2022:
New Baltimore, Michigan:
+55.2%
State:
+52.9%
Number of households with income < $10k:
New Baltimore:
1.9% (80)
State:
4.4% (140,440)
Number of households with income $10k - 20k:
New Baltimore:
4.1% (176)
State:
6.5% (205,547)
Number of households with income $20k - 30k:
New Baltimore:
8.7% (374)
Michigan:
7.6% (242,254)
Number of households with income $30k - 40k:
New Baltimore:
4.8% (205)
State:
8.1% (257,175)
Number of households with income $40k - 50k:
New Baltimore:
6.7% (290)
Michigan:
7.8% (246,839)
Number of households with income $50k - 60k:
New Baltimore:
2.5% (107)
State:
7.4% (233,723)
Number of households with income $60k - 75k:
New Baltimore:
8.4% (360)
State:
10.4% (328,664)
Number of households with income $75k - 100k:
New Baltimore:
14.5% (626)
State:
13.6% (431,867)
Number of households with income $100k - 125k:
New Baltimore:
15.3% (661)
Michigan:
10.3% (325,164)
Number of households with income $125k - 150k:
New Baltimore:
9.3% (400)
Michigan:
7.1% (226,232)
Number of households with income $150k - 200k:
New Baltimore:
14.4% (620)
State:
8.1% (255,445)
Number of households with income > $200k:
New Baltimore:
9.5% (410)
State:
8.7% (276,727)
Aggregate household income in New Baltimore in 2022: $460,720,657
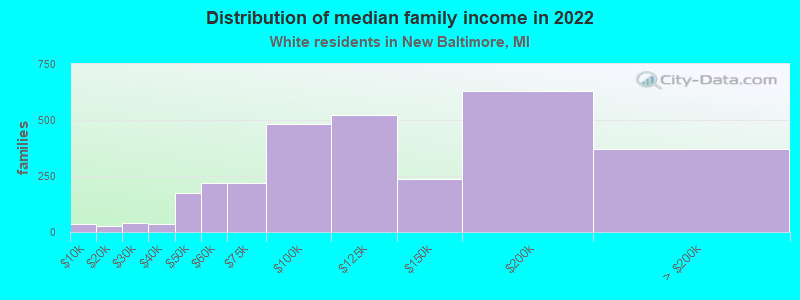
Median family income in New Baltimore in 2022:
New Baltimore:
$112,910
Michigan:
$90,317
Number of families with income < $10k:
New Baltimore:
1.2% (36)
State:
2.5% (49,508)
Number of families with income $10k - 20k:
New Baltimore:
0.9% (26)
State:
3.2% (64,106)
Number of families with income $20k - 30k:
New Baltimore:
1.4% (41)
State:
4.6% (91,551)
Number of families with income $30k - 40k:
New Baltimore:
1.2% (37)
Michigan:
5.9% (117,356)
Number of families with income $40k - 50k:
New Baltimore:
5.7% (172)
Michigan:
6.4% (127,491)
Number of families with income $50k - 60k:
New Baltimore:
7.4% (220)
State:
6.8% (135,883)
Number of families with income $60k - 75k:
New Baltimore:
7.3% (218)
State:
10.5% (209,130)
Number of families with income $75k - 100k:
New Baltimore:
16.1% (481)
State:
15.5% (309,815)
Number of families with income $100k - 125k:
New Baltimore:
17.4% (521)
State:
12.4% (248,235)
Number of families with income $125k - 150k:
New Baltimore:
7.9% (237)
State:
9.2% (182,895)
Number of families with income $150k - 200k:
New Baltimore:
21.1% (630)
State:
11.0% (218,573)
Number of families with income > $200k:
New Baltimore:
12.4% (372)
Michigan:
12.0% (239,713)
Median non-family income in New Baltimore in 2022:
New Baltimore:
$37,287
State:
$42,438
Change in median non-family income between 2000 and 2022:
New Baltimore, Michigan:
+25.9%
State:
+56.8%
Median per capita income in New Baltimore in 2022:
New Baltimore:
$42,566
State:
$41,514
Change in median per capita income between 2000 and 2022:
New Baltimore, Michigan:
+56.4%
State:
+75.2%
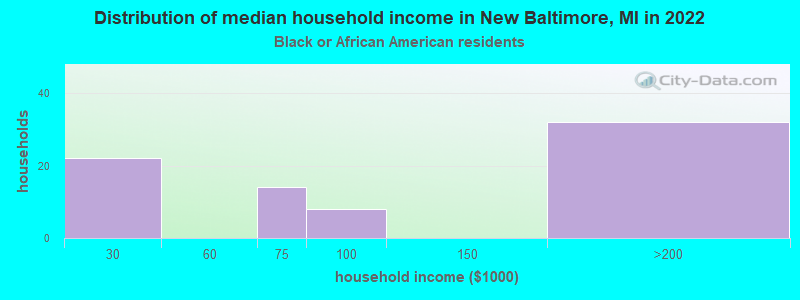
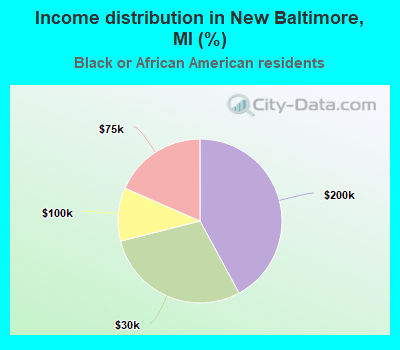
Income statistics for Black or African American residents
Number of households with income < $10k:
New Baltimore:
0.0% (0)
Michigan:
12.7% (66,307)
Number of households with income $10k - 20k:
New Baltimore:
0.0% (0)
Michigan:
14.2% (73,877)
Number of households with income $20k - 30k:
New Baltimore:
28.9% (22)
Michigan:
10.2% (52,930)
Number of households with income $30k - 40k:
New Baltimore:
0.0% (0)
State:
10.3% (53,542)
Number of households with income $40k - 50k:
New Baltimore:
0.0% (0)
Michigan:
9.1% (47,110)
Number of households with income $50k - 60k:
New Baltimore:
0.0% (0)
Michigan:
8.1% (41,969)
Number of households with income $60k - 75k:
New Baltimore:
18.4% (14)
State:
9.0% (46,784)
Number of households with income $75k - 100k:
New Baltimore:
10.5% (8)
State:
9.7% (50,718)
Number of households with income $100k - 125k:
New Baltimore:
0.0% (0)
State:
6.7% (34,802)
Number of households with income $125k - 150k:
New Baltimore:
0.0% (0)
State:
4.1% (21,083)
Number of households with income $150k - 200k:
New Baltimore:
42.1% (32)
Michigan:
3.4% (17,885)
Number of households with income > $200k:
New Baltimore:
0.0% (0)
State:
2.6% (13,430)
Aggregate household income in New Baltimore in 2022: $7,623,051
Median per capita income in New Baltimore in 2022:
New Baltimore:
$28,596
Michigan:
$25,207
Change in median per capita income between 2000 and 2022:
New Baltimore, Michigan:
+72.6%
State:
+60.4%
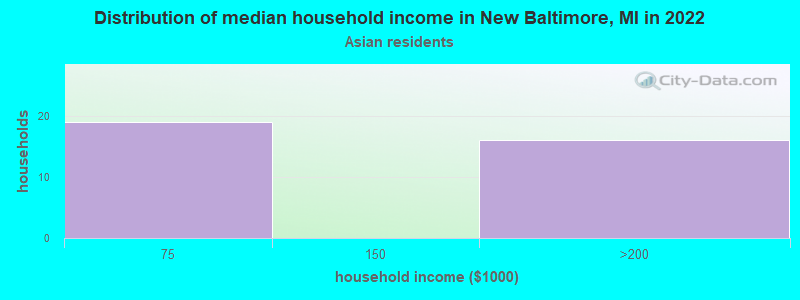
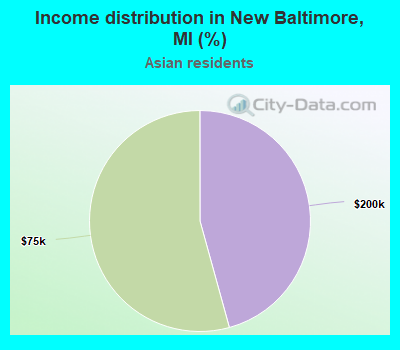
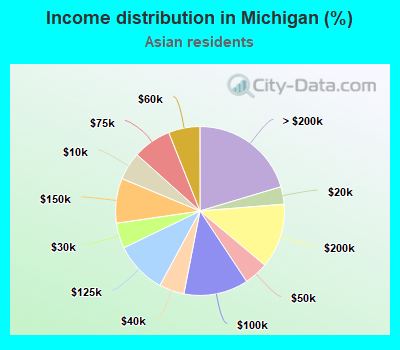
Income statistics for Asian residents
Number of households with income < $10k:
New Baltimore:
0.0% (0)
Michigan:
5.4% (6,241)
Number of households with income $10k - 20k:
New Baltimore:
0.0% (0)
Michigan:
3.3% (3,891)
Number of households with income $20k - 30k:
New Baltimore:
0.0% (0)
Michigan:
4.9% (5,669)
Number of households with income $30k - 40k:
New Baltimore:
0.0% (0)
State:
4.8% (5,590)
Number of households with income $40k - 50k:
New Baltimore:
0.0% (0)
State:
4.6% (5,395)
Number of households with income $50k - 60k:
New Baltimore:
0.0% (0)
State:
6.0% (7,014)
Number of households with income $60k - 75k:
New Baltimore:
54.3% (19)
State:
7.4% (8,566)
Number of households with income $75k - 100k:
New Baltimore:
0.0% (0)
State:
12.4% (14,398)
Number of households with income $100k - 125k:
New Baltimore:
0.0% (0)
State:
10.0% (11,621)
Number of households with income $125k - 150k:
New Baltimore:
0.0% (0)
State:
8.6% (9,986)
Number of households with income $150k - 200k:
New Baltimore:
45.7% (16)
State:
12.4% (14,400)
Number of households with income > $200k:
New Baltimore:
0.0% (0)
State:
20.4% (23,760)
Aggregate household income in New Baltimore in 2022: $8,424,693
Median per capita income in New Baltimore in 2022:
New Baltimore:
$61,972
Michigan:
$48,128
Change in median per capita income between 2000 and 2022:
New Baltimore, Michigan:
+110.8%
Michigan:
+95.8%
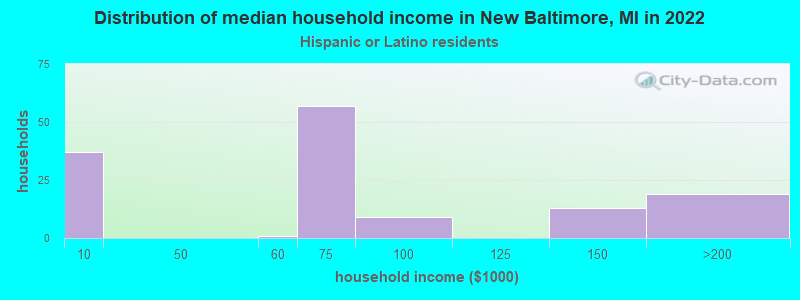
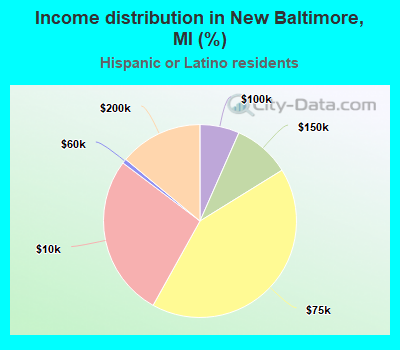
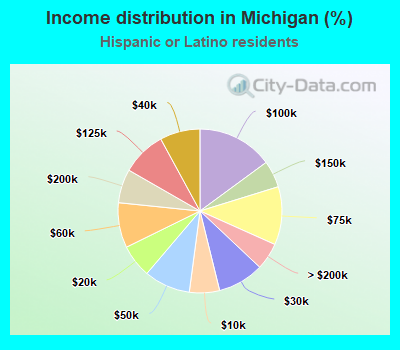
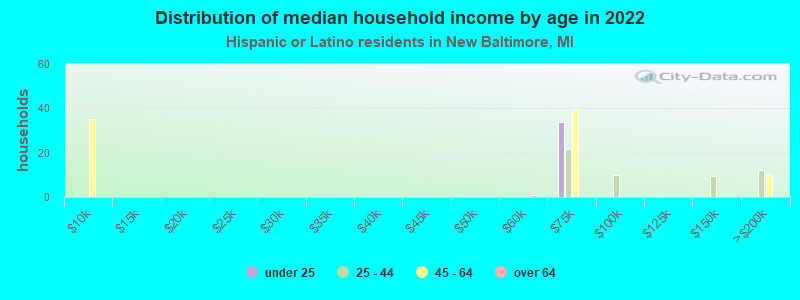
Income statistics for Hispanic or Latino residents
Median household income in New Baltimore, MI in 2022:
New Baltimore:
$68,276
State:
$62,497
Change in median household income between 2000 and 2022:
New Baltimore, Michigan:
+22.0%
Michigan:
+62.4%
Number of households with income < $10k:
New Baltimore:
27.2% (37)
State:
6.0% (10,028)
Number of households with income $10k - 20k:
New Baltimore:
0.0% (0)
Michigan:
6.5% (10,959)
Number of households with income $20k - 30k:
New Baltimore:
0.0% (0)
Michigan:
9.1% (15,369)
Number of households with income $30k - 40k:
New Baltimore:
0.0% (0)
State:
7.9% (13,373)
Number of households with income $40k - 50k:
New Baltimore:
0.0% (0)
State:
9.1% (15,369)
Number of households with income $50k - 60k:
New Baltimore:
0.7% (1)
State:
8.9% (14,990)
Number of households with income $60k - 75k:
New Baltimore:
41.9% (57)
Michigan:
11.5% (19,325)
Number of households with income $75k - 100k:
New Baltimore:
6.6% (9)
Michigan:
14.9% (25,158)
Number of households with income $100k - 125k:
New Baltimore:
0.0% (0)
State:
8.8% (14,758)
Number of households with income $125k - 150k:
New Baltimore:
9.6% (13)
State:
5.3% (8,915)
Number of households with income $150k - 200k:
New Baltimore:
14.0% (19)
Michigan:
6.7% (11,249)
Number of households with income > $200k:
New Baltimore:
0.0% (0)
State:
5.3% (8,978)
Aggregate household income in New Baltimore in 2022: $9,499,384
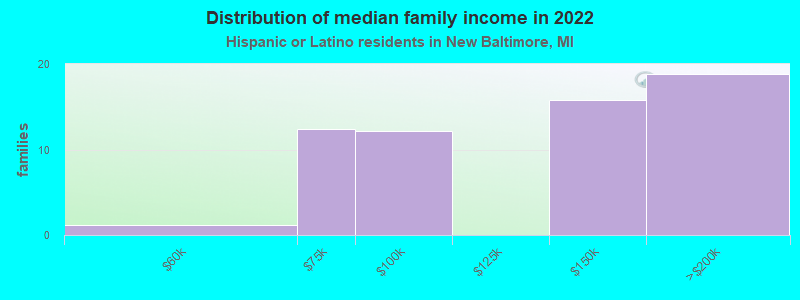
Median family income in New Baltimore in 2022:
New Baltimore:
$123,215
Michigan:
$69,994
Number of families with income $50k - 60k:
New Baltimore:
1.9% (1)
Michigan:
9.1% (10,009)
Number of families with income $60k - 75k:
New Baltimore:
20.5% (12)
State:
10.8% (11,865)
Number of families with income $75k - 100k:
New Baltimore:
20.2% (12)
State:
16.4% (18,094)
Number of families with income $125k - 150k:
New Baltimore:
26.2% (16)
State:
6.6% (7,234)
Number of families with income $150k - 200k:
New Baltimore:
31.3% (19)
State:
7.4% (8,182)
Median non-family income in New Baltimore in 2022:
New Baltimore:
$57,368
State:
$43,705
Median per capita income in New Baltimore in 2022:
New Baltimore:
$18,097
State:
$25,462
Change in median per capita income between 2000 and 2022:
New Baltimore, Michigan:
+21.7%
State:
+83.3%
Income statistics for American Indian and Alaska Native residents
Median per capita income in New Baltimore in 2022:
New Baltimore:
$41,920
State:
$27,661
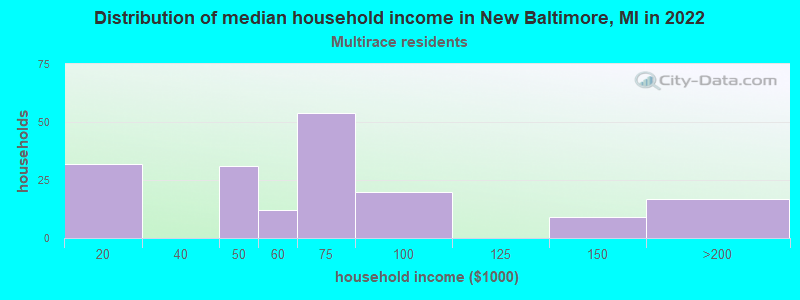
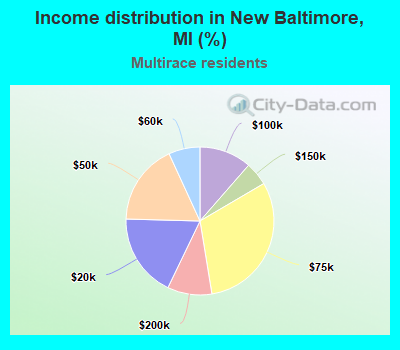
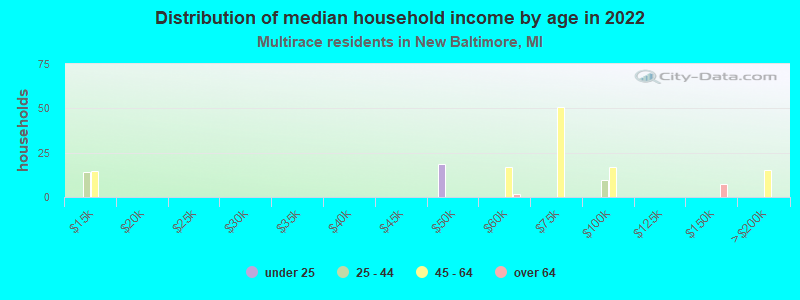
Income statistics for Multirace residents
Median household income in New Baltimore, MI in 2022:
New Baltimore:
$60,656
State:
$63,251
Change in median household income between 2000 and 2022:: -39.6%
New Baltimore, Michigan:
-39.6%
Michigan:
+82.6%
Number of households with income < $10k:
New Baltimore:
0.0% (0)
Michigan:
6.1% (12,463)
Number of households with income $10k - 20k:
New Baltimore:
18.3% (32)
State:
8.7% (17,830)
Number of households with income $20k - 30k:
New Baltimore:
0.0% (0)
State:
7.6% (15,686)
Number of households with income $30k - 40k:
New Baltimore:
0.0% (0)
State:
9.5% (19,444)
Number of households with income $40k - 50k:
New Baltimore:
17.7% (31)
Michigan:
7.5% (15,476)
Number of households with income $50k - 60k:
New Baltimore:
6.9% (12)
State:
8.1% (16,622)
Number of households with income $60k - 75k:
New Baltimore:
30.9% (54)
State:
10.6% (21,725)
Number of households with income $75k - 100k:
New Baltimore:
11.4% (20)
State:
14.4% (29,501)
Number of households with income $100k - 125k:
New Baltimore:
0.0% (0)
State:
8.9% (18,231)
Number of households with income $125k - 150k:
New Baltimore:
5.1% (9)
State:
5.8% (11,923)
Number of households with income $150k - 200k:
New Baltimore:
9.7% (17)
State:
6.8% (13,956)
Number of households with income > $200k:
New Baltimore:
0.0% (0)
State:
6.2% (12,672)
Aggregate household income in New Baltimore in 2022: $10,452,740
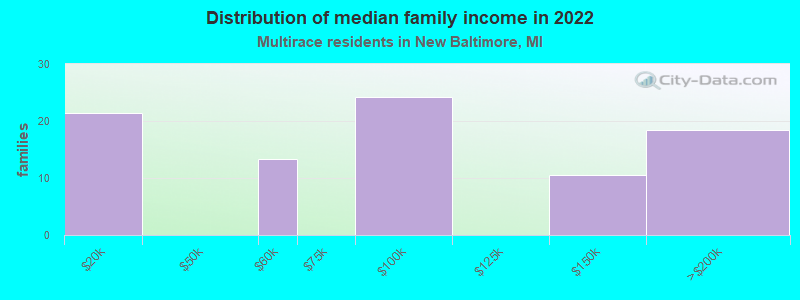
Median family income in New Baltimore in 2022:
New Baltimore:
$81,260
State:
$75,671
Number of families with income $10k - 20k:
New Baltimore:
24.4% (21)
State:
6.1% (8,152)
Number of families with income $50k - 60k:
New Baltimore:
15.3% (13)
State:
8.0% (10,690)
Number of families with income $75k - 100k:
New Baltimore:
27.5% (24)
State:
15.5% (20,677)
Number of families with income $125k - 150k:
New Baltimore:
12.1% (11)
Michigan:
7.6% (10,084)
Number of families with income $150k - 200k:
New Baltimore:
20.9% (18)
State:
7.9% (10,475)
Median non-family income in New Baltimore in 2022:
New Baltimore:
$45,556
State:
$38,642
Median per capita income in New Baltimore in 2022:
New Baltimore:
$14,588
State:
$26,098
Change in median per capita income between 2000 and 2022:: -39.0%
New Baltimore, Michigan:
-39.0%
State:
+106.5%
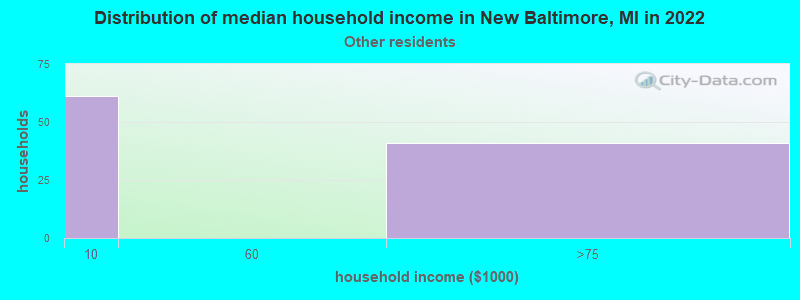
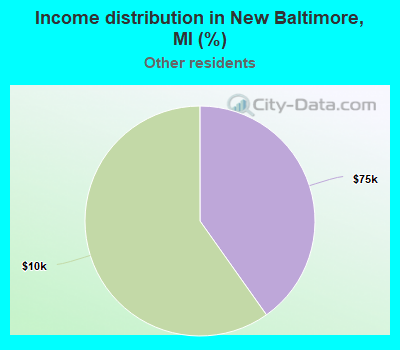
Income statistics for other residents
Number of households with income < $10k:
New Baltimore:
59.8% (61)
Michigan:
7.8% (4,680)
Number of households with income $10k - 20k:
New Baltimore:
0.0% (0)
State:
6.4% (3,815)
Number of households with income $20k - 30k:
New Baltimore:
0.0% (0)
State:
9.4% (5,582)
Number of households with income $30k - 40k:
New Baltimore:
0.0% (0)
State:
7.3% (4,338)
Number of households with income $40k - 50k:
New Baltimore:
0.0% (0)
State:
10.2% (6,092)
Number of households with income $50k - 60k:
New Baltimore:
0.0% (0)
Michigan:
8.2% (4,875)
Number of households with income $60k - 75k:
New Baltimore:
40.2% (41)
State:
11.6% (6,923)
Number of households with income $75k - 100k:
New Baltimore:
0.0% (0)
State:
16.3% (9,741)
Number of households with income $100k - 125k:
New Baltimore:
0.0% (0)
State:
8.5% (5,050)
Number of households with income $125k - 150k:
New Baltimore:
0.0% (0)
State:
4.7% (2,776)
Number of households with income $150k - 200k:
New Baltimore:
0.0% (0)
Michigan:
4.5% (2,682)
Number of households with income > $200k:
New Baltimore:
0.0% (0)
Michigan:
5.2% (3,111)
Aggregate household income in New Baltimore in 2022: $8,174,461
Median per capita income in New Baltimore in 2022:
New Baltimore:
$56,145
State:
$27,114
Discuss New Baltimore, Michigan (MI) on our hugely popular Michigan forum.