The median household income in New England, ND in 2022 was $68,832, which was 4.6% less than the median annual income of $71,970 across the entire state of North Dakota. Compared to the median income of $30,764 in 2000 this represents an increase of 55.3%. The per capita income in 2022 was $39,252, which means an increase of 55.4% compared to 2000 when it was $17,489.
Whole page based on the data from 2000 / 2022 when the population of New England, North Dakota was 555 / 812
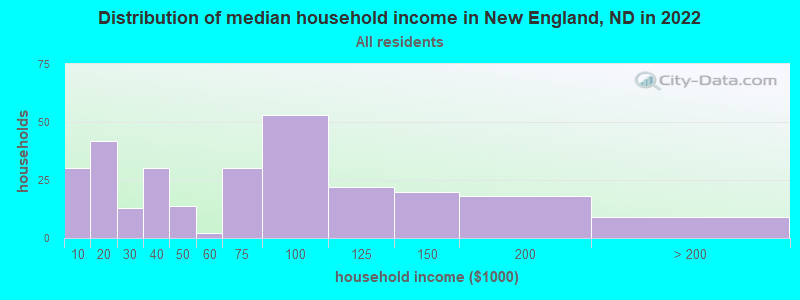
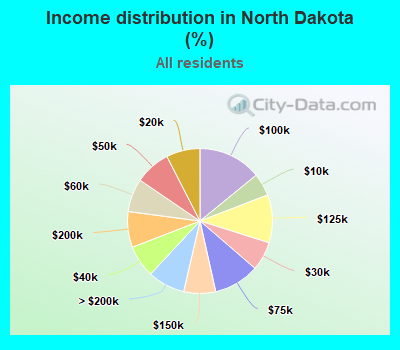
Income statistics for all residents
Median household income in New England, ND in 2022:
New England:
$68,833
State:
$71,970
Change in median household income between 2000 and 2022:
New England, North Dakota:
+123.7%
State:
+108.0%
Number of households with income < $10k:
New England:
10.6% (30)
State:
5.0% (16,738)
Number of households with income $10k - 20k:
New England:
14.8% (42)
North Dakota:
7.5% (24,966)
Number of households with income $20k - 30k:
New England:
4.6% (13)
State:
6.5% (21,449)
Number of households with income $30k - 40k:
New England:
10.6% (30)
State:
7.2% (23,867)
Number of households with income $40k - 50k:
New England:
4.9% (14)
North Dakota:
7.9% (26,327)
Number of households with income $50k - 60k:
New England:
0.7% (2)
North Dakota:
7.4% (24,569)
Number of households with income $60k - 75k:
New England:
10.6% (30)
North Dakota:
10.2% (33,764)
Number of households with income $75k - 100k:
New England:
18.7% (53)
North Dakota:
14.1% (46,776)
Number of households with income $100k - 125k:
New England:
7.8% (22)
State:
10.7% (35,487)
Number of households with income $125k - 150k:
New England:
7.1% (20)
State:
7.1% (23,582)
Number of households with income $150k - 200k:
New England:
6.4% (18)
State:
8.0% (26,504)
Number of households with income > $200k:
New England:
3.2% (9)
State:
8.3% (27,452)
Aggregate household income in New England in 2022: $25,847,799
Median family income in New England in 2022:
New England:
$86,377
State:
$97,853
Number of families with income $10k - 20k:
New England:
2.1% (3)
State:
2.9% (5,653)
Number of families with income $20k - 30k:
New England:
4.5% (7)
State:
3.7% (7,207)
Number of families with income $30k - 40k:
New England:
13.3% (22)
North Dakota:
4.9% (9,437)
Number of families with income $40k - 50k:
New England:
5.8% (9)
North Dakota:
5.8% (11,239)
Number of families with income $50k - 60k:
New England:
1.3% (2)
State:
6.2% (11,919)
Number of families with income $60k - 75k:
New England:
17.7% (29)
State:
10.5% (20,388)
Number of families with income $75k - 100k:
New England:
13.1% (22)
State:
15.4% (29,879)
Number of families with income $100k - 125k:
New England:
20.3% (34)
North Dakota:
14.1% (27,380)
Number of families with income $125k - 150k:
New England:
5.6% (9)
State:
9.9% (19,262)
Number of families with income $150k - 200k:
New England:
10.6% (17)
State:
11.9% (23,019)
Number of families with income > $200k:
New England:
5.7% (9)
State:
12.4% (24,074)
Median non-family income in New England in 2022:
New England:
$16,483
State:
$43,372
Change in median non-family income between 2000 and 2022:: -3.0%
New England, North Dakota:
-3.0%
State:
+113.7%
Median per capita income in New England in 2022:
New England:
$39,253
North Dakota:
$41,800
Change in median per capita income between 2000 and 2022:
New England, North Dakota:
+124.4%
State:
+135.2%
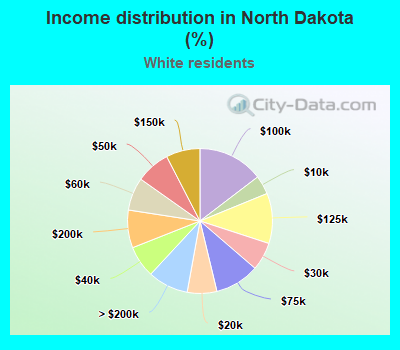
Income statistics for White residents
Median household income in New England, ND in 2022:
New England:
$71,036
North Dakota:
$76,610
Change in median household income between 2000 and 2022:
New England, North Dakota:
+127.3%
State:
+117.5%
Number of households with income < $10k:
New England:
3.2% (8)
North Dakota:
4.2% (12,045)
Number of households with income $10k - 20k:
New England:
14.2% (36)
State:
6.6% (18,882)
Number of households with income $20k - 30k:
New England:
5.5% (14)
State:
6.3% (17,984)
Number of households with income $30k - 40k:
New England:
11.9% (30)
State:
7.1% (20,327)
Number of households with income $40k - 50k:
New England:
5.5% (14)
State:
7.6% (21,810)
Number of households with income $50k - 60k:
New England:
0.8% (2)
State:
7.3% (21,030)
Number of households with income $60k - 75k:
New England:
11.5% (29)
State:
9.9% (28,447)
Number of households with income $75k - 100k:
New England:
20.6% (52)
North Dakota:
14.6% (41,846)
Number of households with income $100k - 125k:
New England:
8.7% (22)
State:
11.2% (32,059)
Number of households with income $125k - 150k:
New England:
7.9% (20)
State:
7.6% (21,722)
Number of households with income $150k - 200k:
New England:
6.7% (17)
State:
8.4% (24,142)
Number of households with income > $200k:
New England:
3.6% (9)
North Dakota:
9.1% (25,904)
Aggregate household income in New England in 2022: $25,642,370
Median family income in New England in 2022:
New England:
$86,905
State:
$102,692
Number of families with income $10k - 20k:
New England:
1.8% (3)
State:
2.2% (3,640)
Number of families with income $20k - 30k:
New England:
5.3% (9)
State:
3.4% (5,695)
Number of families with income $30k - 40k:
New England:
14.4% (24)
State:
4.5% (7,464)
Number of families with income $40k - 50k:
New England:
5.6% (9)
State:
5.2% (8,758)
Number of families with income $50k - 60k:
New England:
1.2% (2)
State:
5.5% (9,269)
Number of families with income $60k - 75k:
New England:
16.9% (28)
North Dakota:
9.7% (16,326)
Number of families with income $75k - 100k:
New England:
13.2% (22)
North Dakota:
16.5% (27,571)
Number of families with income $100k - 125k:
New England:
20.1% (33)
State:
14.8% (24,772)
Number of families with income $125k - 150k:
New England:
5.7% (9)
State:
10.8% (18,004)
Number of families with income $150k - 200k:
New England:
10.2% (17)
State:
12.5% (20,867)
Number of families with income > $200k:
New England:
5.7% (9)
State:
13.6% (22,731)
Median per capita income in New England in 2022:
New England:
$43,655
State:
$45,414
Change in median per capita income between 2000 and 2022:
New England, North Dakota:
+149.6%
State:
+146.8%
Income statistics for Black or African American residents
Median per capita income in New England in 2022:
New England:
$1,087
State:
$21,552
Income statistics for Hispanic or Latino residents
Median per capita income in New England in 2022:
New England:
$16,640
North Dakota:
$26,282
Change in median per capita income between 2000 and 2022:
New England, North Dakota:
+113.3%
State:
+116.2%
Income statistics for American Indian and Alaska Native residents
Number of households with income < $10k:
New England:
100.0% (29)
North Dakota:
19.0% (2,148)
Number of households with income $10k - 20k:
New England:
0.0% (0)
State:
16.4% (1,853)
Number of households with income $20k - 30k:
New England:
0.0% (0)
State:
8.8% (1,001)
Number of households with income $30k - 40k:
New England:
0.0% (0)
State:
8.5% (959)
Number of households with income $40k - 50k:
New England:
0.0% (0)
State:
9.8% (1,112)
Number of households with income $50k - 60k:
New England:
0.0% (0)
North Dakota:
8.2% (934)
Number of households with income $60k - 75k:
New England:
0.0% (0)
State:
7.2% (819)
Number of households with income $75k - 100k:
New England:
0.0% (0)
State:
8.5% (963)
Number of households with income $100k - 125k:
New England:
0.0% (0)
North Dakota:
6.2% (702)
Number of households with income $125k - 150k:
New England:
0.0% (0)
State:
3.6% (408)
Number of households with income $150k - 200k:
New England:
0.0% (0)
State:
2.7% (310)
Number of households with income > $200k:
New England:
0.0% (0)
State:
1.0% (118)
Aggregate household income in New England in 2022: $168,971
Median per capita income in New England in 2022:
New England:
$13,008
North Dakota:
$17,975
Change in median per capita income between 2000 and 2022:: -2.6%
New England, North Dakota:
-2.6%
State:
+113.8%
Income statistics for Multirace residents
Median per capita income in New England in 2022:
New England:
$23,644
State:
$26,749
Change in median per capita income between 2000 and 2022:: -6.3%
New England, North Dakota:
-6.3%
State:
+178.2%
Discuss New England, North Dakota (ND) on our hugely popular North Dakota forum.