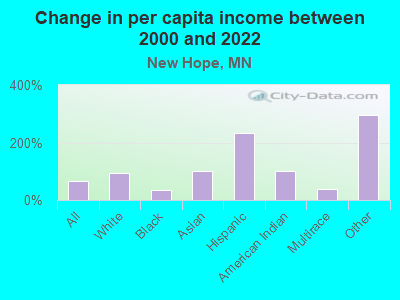
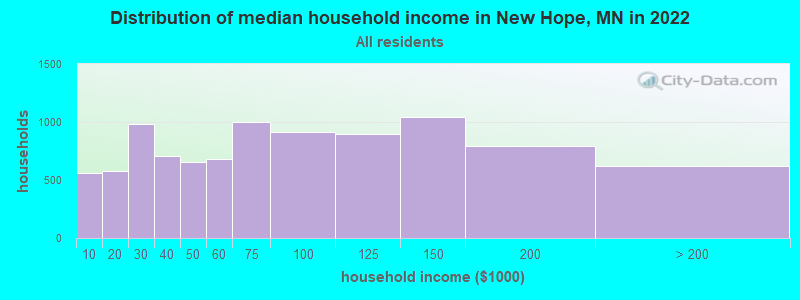
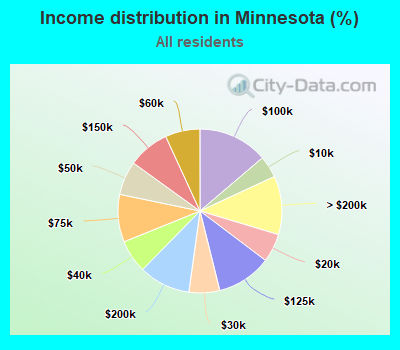
The median household income in New Hope, MN in 2022 was $66,853, which was 23.2% less than the median annual income of $82,338 across the entire state of Minnesota. Compared to the median income of $46,795 in 2000 this represents an increase of 30.0%. The per capita income in 2022 was $38,914, which means an increase of 39.5% compared to 2000 when it was $23,562.
Whole page based on the data from 2000 / 2022 when the population of New Hope, Minnesota was 20,873 / 21,439
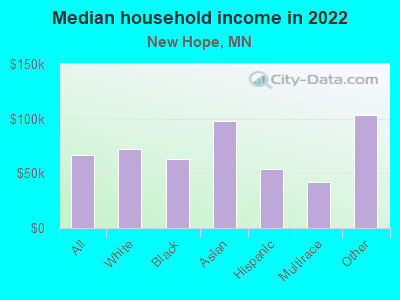
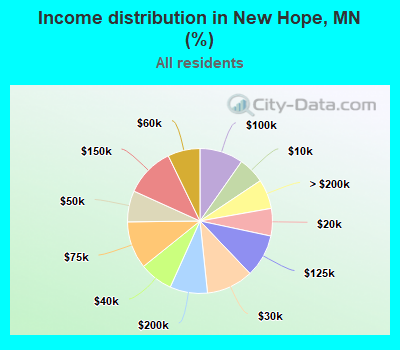
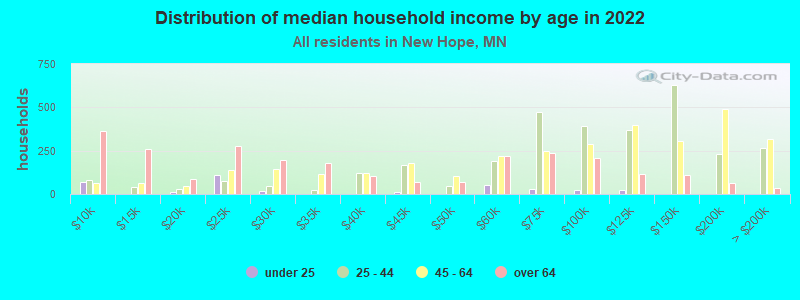
Income statistics for all residents
Median household income in New Hope, MN in 2022:
New Hope:
$66,854
State:
$82,338
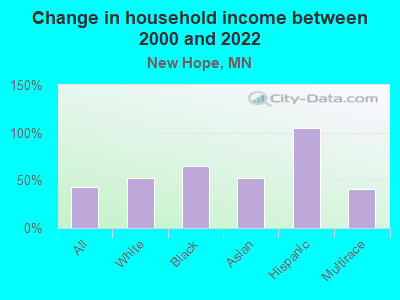
Change in median household income between 2000 and 2022:
New Hope, Minnesota:
+42.9%
State:
+74.8%
Number of households with income < $10k:
New Hope:
5.9% (557)
Minnesota:
4.3% (100,518)
Number of households with income $10k - 20k:
New Hope:
6.1% (577)
State:
5.6% (130,945)
Number of households with income $20k - 30k:
New Hope:
10.5% (986)
State:
6.1% (140,637)
Number of households with income $30k - 40k:
New Hope:
7.5% (707)
Minnesota:
6.5% (151,862)
Number of households with income $40k - 50k:
New Hope:
7.0% (655)
Minnesota:
6.7% (154,930)
Number of households with income $50k - 60k:
New Hope:
7.2% (679)
State:
6.9% (159,181)
Number of households with income $60k - 75k:
New Hope:
10.6% (997)
Minnesota:
9.4% (218,220)
Number of households with income $75k - 100k:
New Hope:
9.7% (916)
State:
13.8% (319,951)
Number of households with income $100k - 125k:
New Hope:
9.6% (900)
State:
10.8% (251,243)
Number of households with income $125k - 150k:
New Hope:
11.0% (1,039)
Minnesota:
8.2% (190,349)
Number of households with income $150k - 200k:
New Hope:
8.4% (789)
State:
10.2% (236,018)
Number of households with income > $200k:
New Hope:
6.6% (620)
State:
11.6% (268,336)
Aggregate household income in New Hope in 2022: $827,381,386
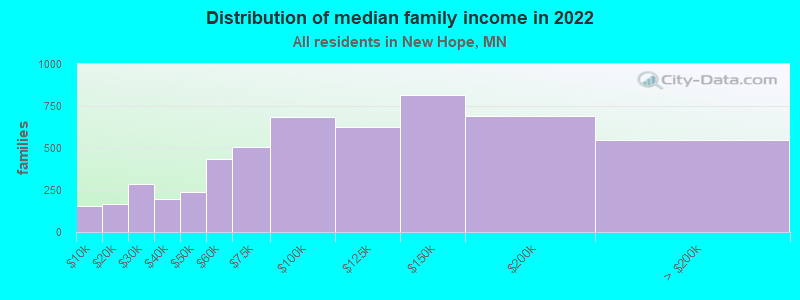
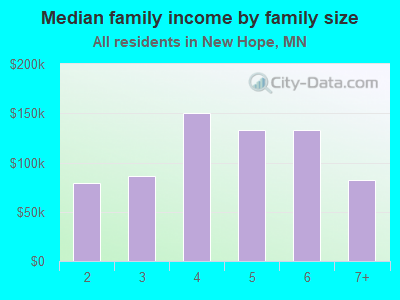
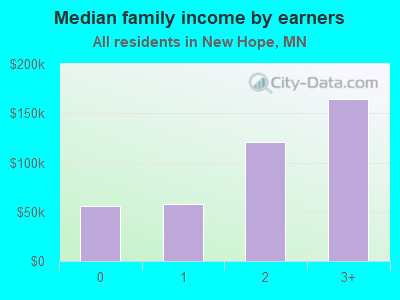
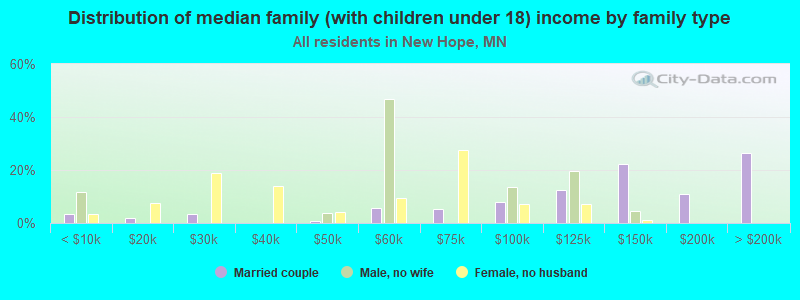
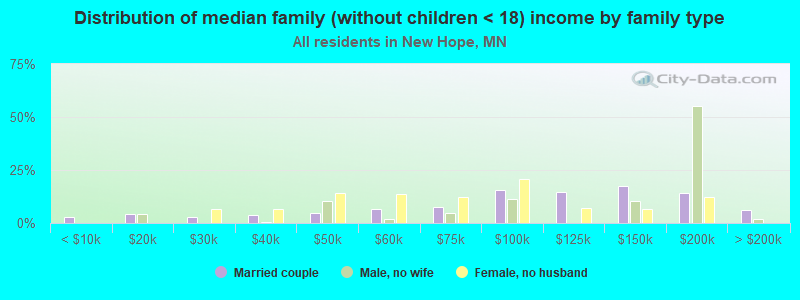
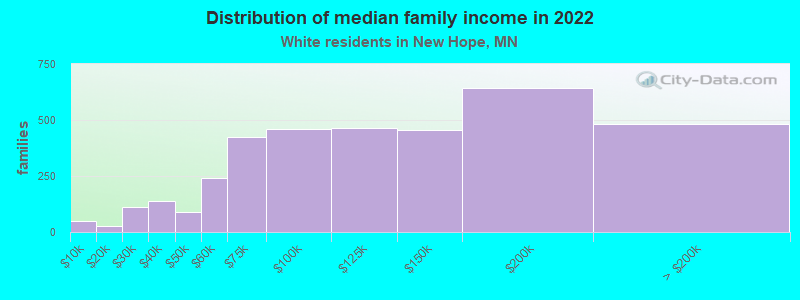
Median family income in New Hope in 2022:
New Hope:
$101,047
State:
$105,324
Number of families with income < $10k:
New Hope:
2.9% (157)
Minnesota:
2.2% (31,728)
Number of families with income $10k - 20k:
New Hope:
3.1% (164)
Minnesota:
2.5% (36,635)
Number of families with income $20k - 30k:
New Hope:
5.3% (286)
Minnesota:
3.5% (50,742)
Number of families with income $30k - 40k:
New Hope:
3.7% (198)
Minnesota:
4.4% (64,281)
Number of families with income $40k - 50k:
New Hope:
4.5% (241)
State:
5.2% (76,436)
Number of families with income $50k - 60k:
New Hope:
8.1% (435)
State:
5.7% (83,050)
Number of families with income $60k - 75k:
New Hope:
9.4% (503)
Minnesota:
8.8% (127,783)
Number of families with income $75k - 100k:
New Hope:
12.8% (683)
Minnesota:
14.7% (214,426)
Number of families with income $100k - 125k:
New Hope:
11.7% (623)
State:
13.1% (190,094)
Number of families with income $125k - 150k:
New Hope:
15.3% (817)
State:
10.3% (149,830)
Number of families with income $150k - 200k:
New Hope:
12.9% (692)
State:
13.6% (197,479)
Number of families with income > $200k:
New Hope:
10.3% (548)
State:
16.1% (233,828)
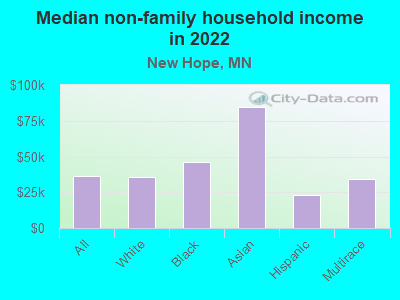
Median non-family income in New Hope in 2022:
New Hope:
$36,380
Minnesota:
$48,461
Change in median non-family income between 2000 and 2022:
New Hope, Minnesota:
+35.4%
State:
+73.6%
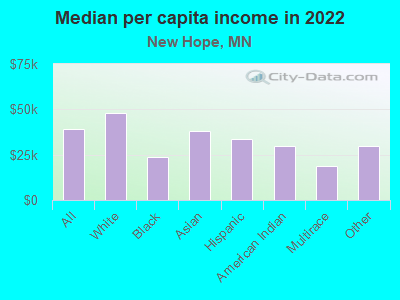
Median per capita income in New Hope in 2022:
New Hope:
$38,914
Minnesota:
$45,021
Change in median per capita income between 2000 and 2022:
New Hope, Minnesota:
+65.2%
State:
+94.1%
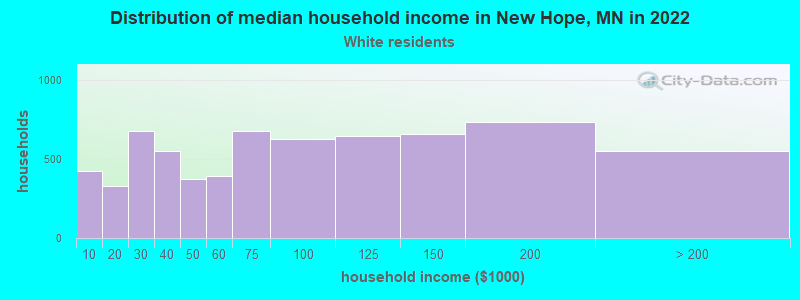
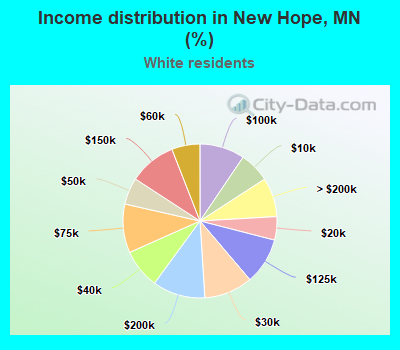
Income statistics for White residents
Median household income in New Hope, MN in 2022:
New Hope:
$72,319
State:
$85,697
Change in median household income between 2000 and 2022:
New Hope, Minnesota:
+52.1%
Minnesota:
+77.5%
Number of households with income < $10k:
New Hope:
6.4% (422)
Minnesota:
3.9% (74,145)
Number of households with income $10k - 20k:
New Hope:
4.9% (326)
State:
5.1% (97,289)
Number of households with income $20k - 30k:
New Hope:
10.2% (677)
State:
5.8% (111,536)
Number of households with income $30k - 40k:
New Hope:
8.3% (547)
Minnesota:
6.2% (118,402)
Number of households with income $40k - 50k:
New Hope:
5.6% (373)
State:
6.6% (126,331)
Number of households with income $50k - 60k:
New Hope:
5.9% (392)
Minnesota:
6.8% (129,961)
Number of households with income $60k - 75k:
New Hope:
10.2% (677)
State:
9.4% (181,337)
Number of households with income $75k - 100k:
New Hope:
9.5% (627)
State:
13.8% (265,776)
Number of households with income $100k - 125k:
New Hope:
9.8% (646)
State:
11.2% (214,803)
Number of households with income $125k - 150k:
New Hope:
9.9% (655)
State:
8.6% (164,715)
Number of households with income $150k - 200k:
New Hope:
11.1% (732)
Minnesota:
10.6% (203,283)
Number of households with income > $200k:
New Hope:
8.2% (546)
Minnesota:
12.2% (233,694)
Aggregate household income in New Hope in 2022: $626,838,893
Median family income in New Hope in 2022:
New Hope:
$109,965
State:
$110,049
Number of families with income < $10k:
New Hope:
1.4% (51)
Minnesota:
1.5% (17,407)
Number of families with income $10k - 20k:
New Hope:
0.7% (25)
State:
1.9% (22,955)
Number of families with income $20k - 30k:
New Hope:
3.1% (110)
State:
2.9% (34,913)
Number of families with income $30k - 40k:
New Hope:
3.9% (139)
State:
3.7% (44,598)
Number of families with income $40k - 50k:
New Hope:
2.5% (91)
Minnesota:
4.9% (58,683)
Number of families with income $50k - 60k:
New Hope:
6.8% (243)
State:
5.4% (64,644)
Number of families with income $60k - 75k:
New Hope:
11.8% (422)
Minnesota:
8.9% (105,839)
Number of families with income $75k - 100k:
New Hope:
12.8% (459)
State:
14.8% (177,106)
Number of families with income $100k - 125k:
New Hope:
12.9% (464)
Minnesota:
13.6% (162,292)
Number of families with income $125k - 150k:
New Hope:
12.7% (456)
Minnesota:
10.9% (130,417)
Number of families with income $150k - 200k:
New Hope:
18.0% (645)
State:
14.3% (171,257)
Number of families with income > $200k:
New Hope:
13.4% (483)
State:
17.1% (204,721)
Median non-family income in New Hope in 2022:
New Hope:
$35,709
State:
$49,920
Change in median non-family income between 2000 and 2022:
New Hope, Minnesota:
+32.7%
State:
+76.0%
Median per capita income in New Hope in 2022:
New Hope:
$47,759
State:
$49,507
Change in median per capita income between 2000 and 2022:
New Hope, Minnesota:
+93.6%
Minnesota:
+103.3%
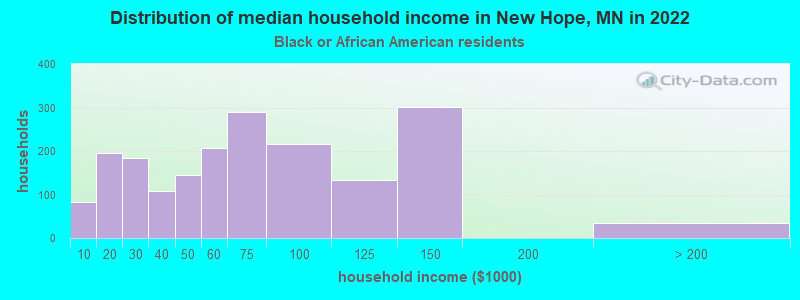
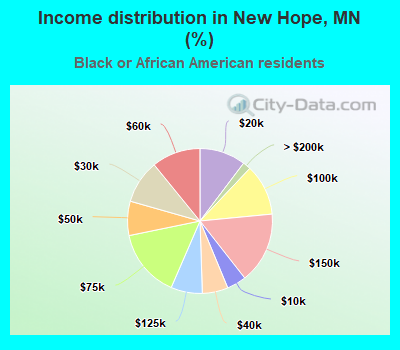
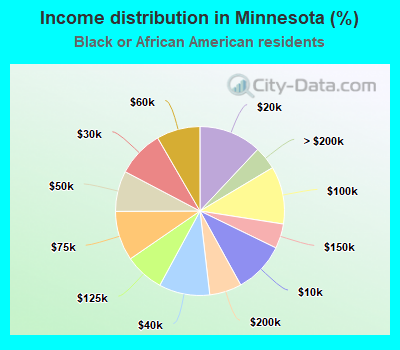
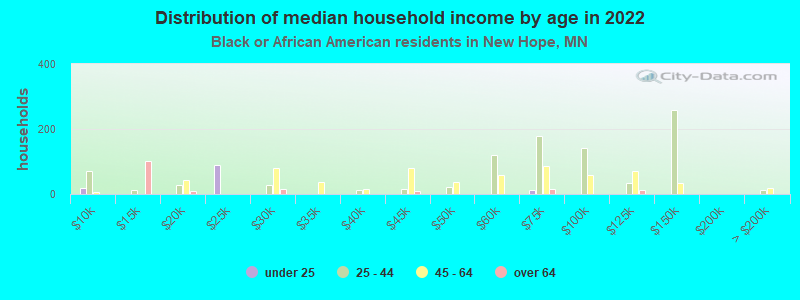
Income statistics for Black or African American residents
Median household income in New Hope, MN in 2022:
New Hope:
$62,819
State:
$51,320
Change in median household income between 2000 and 2022:
New Hope, Minnesota:
+64.8%
Minnesota:
+77.4%
Number of households with income < $10k:
New Hope:
4.3% (82)
Minnesota:
9.8% (13,122)
Number of households with income $10k - 20k:
New Hope:
10.3% (195)
State:
12.0% (16,076)
Number of households with income $20k - 30k:
New Hope:
9.7% (184)
State:
8.9% (11,986)
Number of households with income $30k - 40k:
New Hope:
5.8% (109)
Minnesota:
9.8% (13,064)
Number of households with income $40k - 50k:
New Hope:
7.7% (145)
State:
7.8% (10,426)
Number of households with income $50k - 60k:
New Hope:
10.9% (206)
Minnesota:
8.4% (11,191)
Number of households with income $60k - 75k:
New Hope:
15.3% (289)
State:
9.5% (12,717)
Number of households with income $75k - 100k:
New Hope:
11.4% (216)
Minnesota:
11.0% (14,800)
Number of households with income $100k - 125k:
New Hope:
7.0% (133)
State:
7.5% (10,088)
Number of households with income $125k - 150k:
New Hope:
15.9% (302)
Minnesota:
4.7% (6,321)
Number of households with income $150k - 200k:
New Hope:
0.0% (0)
Minnesota:
6.1% (8,240)
Number of households with income > $200k:
New Hope:
1.8% (34)
State:
4.4% (5,958)
Aggregate household income in New Hope in 2022: $142,368,334
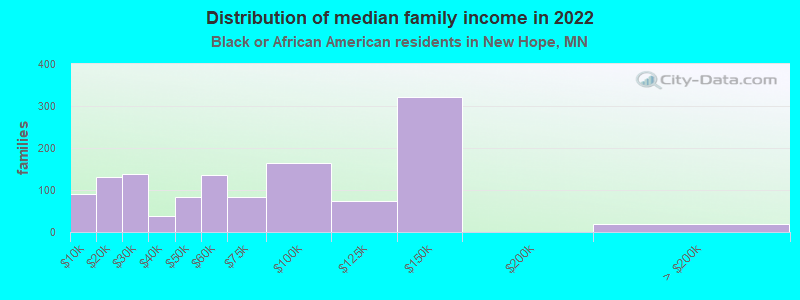
Median family income in New Hope in 2022:
New Hope:
$65,870
State:
$61,475
Number of families with income < $10k:
New Hope:
7.1% (91)
State:
7.6% (6,143)
Number of families with income $10k - 20k:
New Hope:
10.3% (132)
State:
7.0% (5,667)
Number of families with income $20k - 30k:
New Hope:
10.7% (138)
Minnesota:
8.2% (6,632)
Number of families with income $30k - 40k:
New Hope:
3.0% (38)
State:
9.4% (7,539)
Number of families with income $40k - 50k:
New Hope:
6.5% (83)
State:
7.9% (6,354)
Number of families with income $50k - 60k:
New Hope:
10.6% (136)
Minnesota:
8.7% (7,014)
Number of families with income $60k - 75k:
New Hope:
6.5% (84)
State:
9.4% (7,570)
Number of families with income $75k - 100k:
New Hope:
12.9% (165)
Minnesota:
12.0% (9,645)
Number of families with income $100k - 125k:
New Hope:
5.8% (74)
Minnesota:
10.6% (8,487)
Number of families with income $125k - 150k:
New Hope:
25.1% (322)
State:
6.3% (5,073)
Number of families with income > $200k:
New Hope:
1.6% (20)
State:
6.0% (4,815)
Median non-family income in New Hope in 2022:
New Hope:
$46,157
State:
$34,487
Change in median non-family income between 2000 and 2022:
New Hope, Minnesota:
+70.1%
State:
+60.8%
Median per capita income in New Hope in 2022:
New Hope:
$23,570
State:
$25,146
Change in median per capita income between 2000 and 2022:
New Hope, Minnesota:
+35.0%
State:
+83.0%
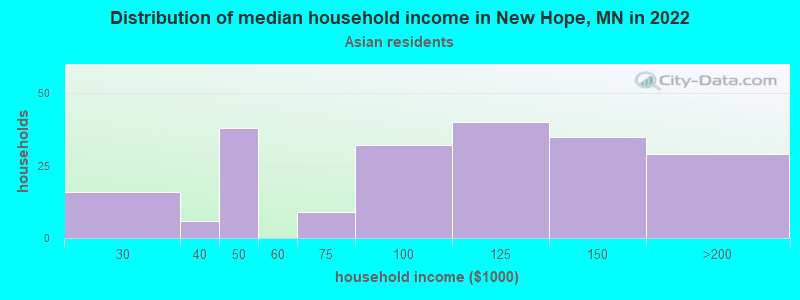
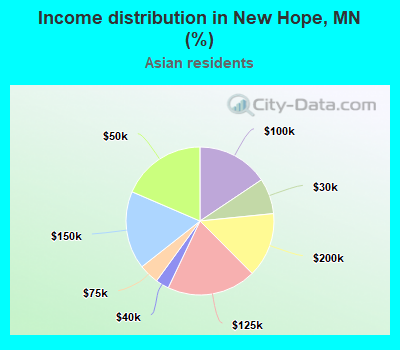
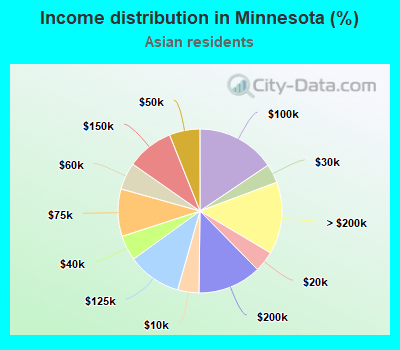
Income statistics for Asian residents
Median household income in New Hope, MN in 2022:
New Hope:
$98,018
State:
$93,773
Change in median household income between 2000 and 2022:
New Hope, Minnesota:
+52.1%
Minnesota:
+106.0%
Number of households with income < $10k:
New Hope:
0.0% (0)
Minnesota:
4.2% (3,886)
Number of households with income $10k - 20k:
New Hope:
0.0% (0)
State:
4.1% (3,821)
Number of households with income $20k - 30k:
New Hope:
7.8% (16)
State:
3.8% (3,485)
Number of households with income $30k - 40k:
New Hope:
2.9% (6)
State:
5.0% (4,620)
Number of households with income $40k - 50k:
New Hope:
18.5% (38)
State:
6.0% (5,609)
Number of households with income $50k - 60k:
New Hope:
0.0% (0)
Minnesota:
5.4% (4,977)
Number of households with income $60k - 75k:
New Hope:
4.4% (9)
State:
9.3% (8,666)
Number of households with income $75k - 100k:
New Hope:
15.6% (32)
Minnesota:
15.6% (14,466)
Number of households with income $100k - 125k:
New Hope:
19.5% (40)
Minnesota:
10.7% (9,893)
Number of households with income $125k - 150k:
New Hope:
17.1% (35)
State:
9.3% (8,600)
Number of households with income $150k - 200k:
New Hope:
14.1% (29)
Minnesota:
12.6% (11,662)
Number of households with income > $200k:
New Hope:
0.0% (0)
Minnesota:
14.2% (13,207)
Aggregate household income in New Hope in 2022: $20,233,507
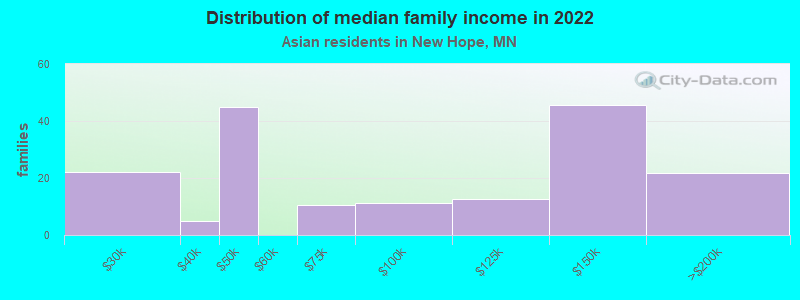
Median family income in New Hope in 2022:
New Hope:
$114,754
Minnesota:
$105,412
Number of families with income $20k - 30k:
New Hope:
12.8% (22)
State:
3.2% (2,190)
Number of families with income $30k - 40k:
New Hope:
2.8% (5)
State:
5.4% (3,668)
Number of families with income $40k - 50k:
New Hope:
25.9% (45)
State:
4.8% (3,312)
Number of families with income $60k - 75k:
New Hope:
6.0% (10)
Minnesota:
8.6% (5,887)
Number of families with income $75k - 100k:
New Hope:
6.4% (11)
State:
13.9% (9,500)
Number of families with income $100k - 125k:
New Hope:
7.2% (12)
Minnesota:
11.4% (7,777)
Number of families with income $125k - 150k:
New Hope:
26.4% (46)
State:
9.8% (6,734)
Number of families with income $150k - 200k:
New Hope:
12.5% (22)
State:
14.4% (9,877)
Median non-family income in New Hope in 2022:
New Hope:
$84,405
State:
$58,400
Change in median non-family income between 2000 and 2022:
New Hope, Minnesota:
+136.9%
State:
+115.0%
Median per capita income in New Hope in 2022:
New Hope:
$37,854
Minnesota:
$39,496
Change in median per capita income between 2000 and 2022:
New Hope, Minnesota:
+101.5%
State:
+156.7%
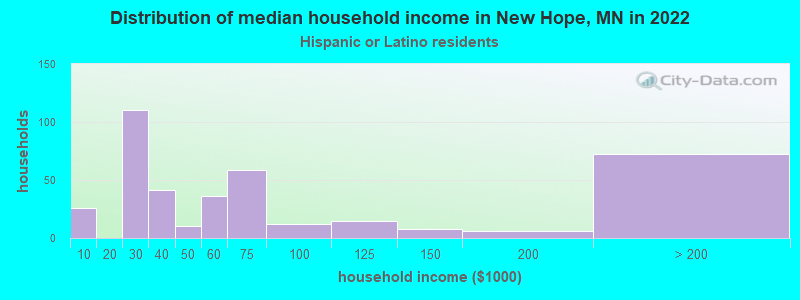
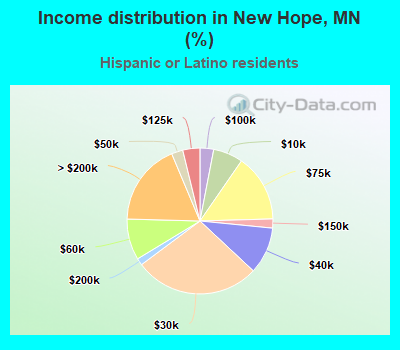
Income statistics for Hispanic or Latino residents
Median household income in New Hope, MN in 2022:
New Hope:
$53,867
State:
$63,399
Change in median household income between 2000 and 2022:
New Hope, Minnesota:
+105.2%
State:
+76.4%
Number of households with income < $10k:
New Hope:
6.6% (26)
State:
4.0% (3,834)
Number of households with income $10k - 20k:
New Hope:
0.0% (0)
State:
6.1% (5,874)
Number of households with income $20k - 30k:
New Hope:
27.8% (110)
State:
9.9% (9,526)
Number of households with income $30k - 40k:
New Hope:
10.4% (41)
State:
10.1% (9,710)
Number of households with income $40k - 50k:
New Hope:
2.5% (10)
Minnesota:
8.0% (7,724)
Number of households with income $50k - 60k:
New Hope:
9.1% (36)
Minnesota:
9.6% (9,248)
Number of households with income $60k - 75k:
New Hope:
14.9% (59)
State:
10.8% (10,444)
Number of households with income $75k - 100k:
New Hope:
3.0% (12)
Minnesota:
15.0% (14,464)
Number of households with income $100k - 125k:
New Hope:
3.8% (15)
State:
7.6% (7,348)
Number of households with income $125k - 150k:
New Hope:
2.0% (8)
State:
5.1% (4,890)
Number of households with income $150k - 200k:
New Hope:
1.5% (6)
State:
6.5% (6,257)
Number of households with income > $200k:
New Hope:
18.2% (72)
State:
7.3% (7,057)
Aggregate household income in New Hope in 2022: $37,056,939
Median non-family income in New Hope in 2022:
New Hope:
$22,863
State:
$41,691
Median per capita income in New Hope in 2022:
New Hope:
$33,687
State:
$27,748
Income statistics for American Indian and Alaska Native residents
Aggregate household income in New Hope in 2022: $2,711,012
Median per capita income in New Hope in 2022:
New Hope:
$29,717
State:
$24,180
Change in median per capita income between 2000 and 2022:
New Hope, Minnesota:
+100.2%
Minnesota:
+85.4%
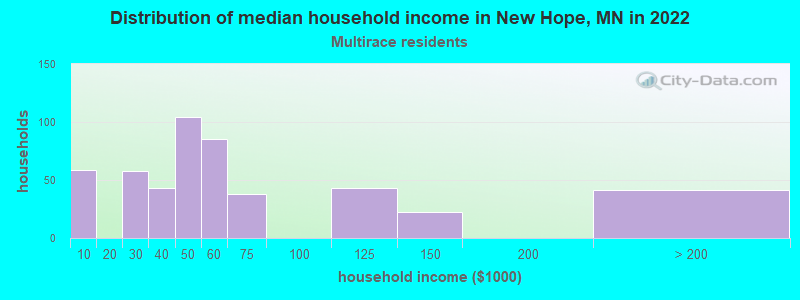
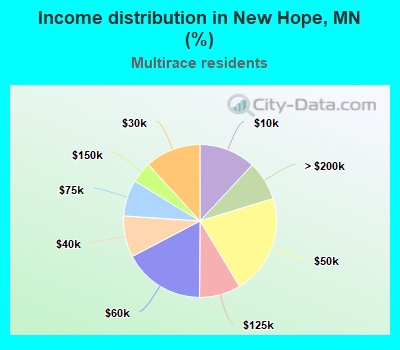
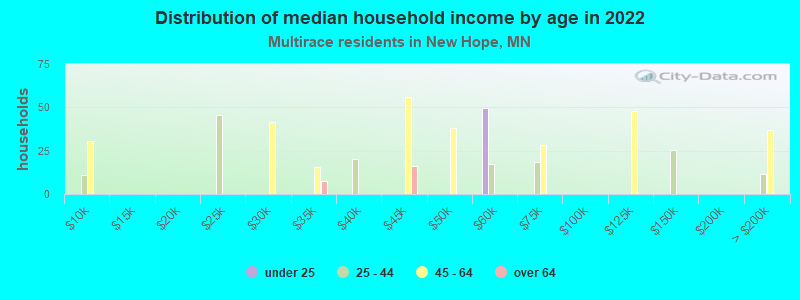
Income statistics for Multirace residents
Median household income in New Hope, MN in 2022:
New Hope:
$42,519
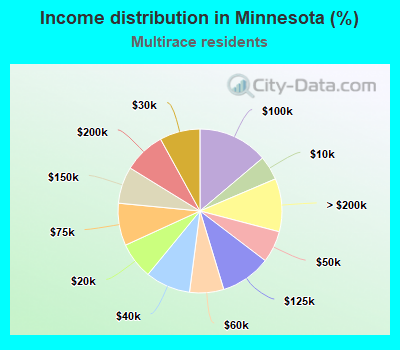
State:
$74,586
Change in median household income between 2000 and 2022:
New Hope, Minnesota:
+40.9%
Minnesota:
+117.9%
Number of households with income < $10k:
New Hope:
12.0% (59)
State:
4.8% (5,071)
Number of households with income $10k - 20k:
New Hope:
0.0% (0)
State:
7.2% (7,697)
Number of households with income $20k - 30k:
New Hope:
11.8% (58)
Minnesota:
8.0% (8,495)
Number of households with income $30k - 40k:
New Hope:
8.7% (43)
State:
8.9% (9,445)
Number of households with income $40k - 50k:
New Hope:
21.1% (104)
Minnesota:
6.3% (6,680)
Number of households with income $50k - 60k:
New Hope:
17.2% (85)
Minnesota:
6.7% (7,171)
Number of households with income $60k - 75k:
New Hope:
7.7% (38)
State:
8.4% (8,916)
Number of households with income $75k - 100k:
New Hope:
0.0% (0)
State:
13.8% (14,719)
Number of households with income $100k - 125k:
New Hope:
8.7% (43)
State:
10.0% (10,590)
Number of households with income $125k - 150k:
New Hope:
4.5% (22)
State:
7.3% (7,720)
Number of households with income $150k - 200k:
New Hope:
0.0% (0)
Minnesota:
8.2% (8,751)
Number of households with income > $200k:
New Hope:
8.3% (41)
Minnesota:
10.5% (11,170)
Aggregate household income in New Hope in 2022: $30,445,338
Median non-family income in New Hope in 2022:
New Hope:
$34,494
State:
$46,898
Change in median non-family income between 2000 and 2022:
New Hope, Minnesota:
+36.8%
State:
+90.3%
Median per capita income in New Hope in 2022:
New Hope:
$18,894
State:
$28,529
Change in median per capita income between 2000 and 2022:
New Hope, Minnesota:
+37.0%
State:
+155.0%
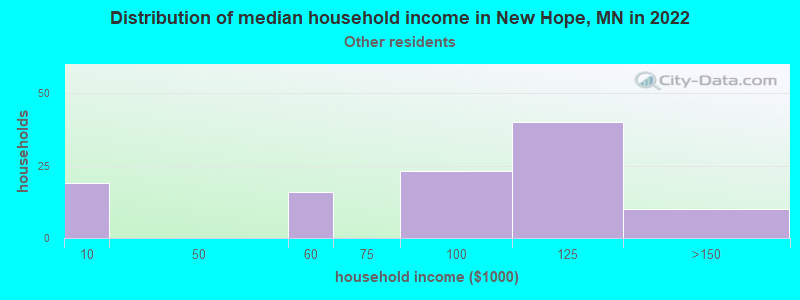
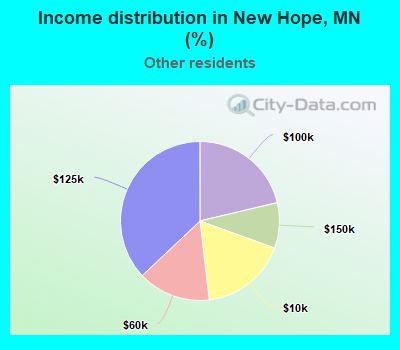
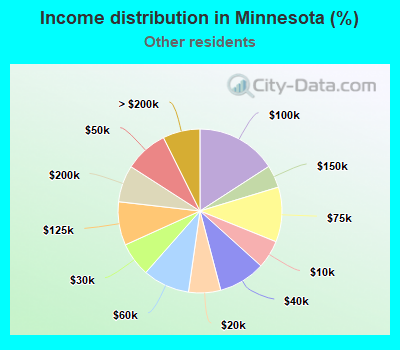
Income statistics for other residents
Median household income in New Hope, MN in 2022:
New Hope:
$102,975
State:
$65,473
Number of households with income < $10k:
New Hope:
17.6% (19)
State:
5.5% (2,716)
Number of households with income $10k - 20k:
New Hope:
0.0% (0)
State:
6.3% (3,106)
Number of households with income $20k - 30k:
New Hope:
0.0% (0)
State:
6.7% (3,298)
Number of households with income $30k - 40k:
New Hope:
0.0% (0)
State:
9.2% (4,529)
Number of households with income $40k - 50k:
New Hope:
0.0% (0)
State:
8.6% (4,198)
Number of households with income $50k - 60k:
New Hope:
14.8% (16)
State:
9.2% (4,519)
Number of households with income $60k - 75k:
New Hope:
0.0% (0)
Minnesota:
10.8% (5,300)
Number of households with income $75k - 100k:
New Hope:
21.3% (23)
Minnesota:
15.9% (7,771)
Number of households with income $100k - 125k:
New Hope:
37.0% (40)
Minnesota:
8.6% (4,216)
Number of households with income $125k - 150k:
New Hope:
9.3% (10)
State:
4.4% (2,178)
Number of households with income $150k - 200k:
New Hope:
0.0% (0)
Minnesota:
7.3% (3,556)
Number of households with income > $200k:
New Hope:
0.0% (0)
State:
7.3% (3,596)
Aggregate household income in New Hope in 2022: $11,056,455
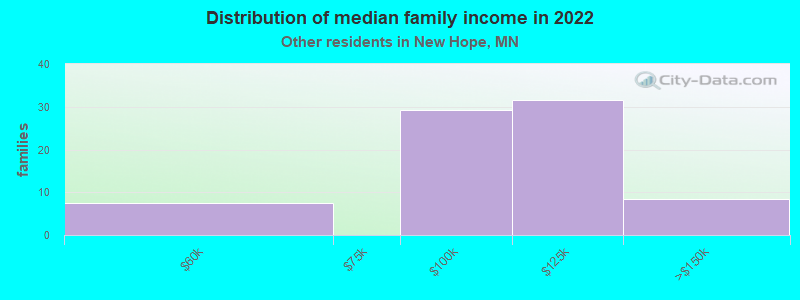
Median family income in New Hope in 2022:
New Hope:
$116,867
State:
$74,121
Number of families with income $50k - 60k:
New Hope:
9.9% (8)
State:
9.1% (3,326)
Number of families with income $75k - 100k:
New Hope:
37.9% (29)
State:
19.3% (7,050)
Number of families with income $100k - 125k:
New Hope:
41.2% (32)
Minnesota:
8.8% (3,224)
Number of families with income $125k - 150k:
New Hope:
11.0% (8)
State:
4.7% (1,728)
Median per capita income in New Hope in 2022:
New Hope:
$29,935
State:
$28,385
Discuss New Hope, Minnesota (MN) on our hugely popular Minnesota forum.