The median household income in New Hope, OR in 2022 was $65,481, which was 15.5% less than the median annual income of $75,657 across the entire state of Oregon. Compared to the median income of $31,229 in 2000 this represents an increase of 52.3%. The per capita income in 2022 was $32,371, which means an increase of 46.8% compared to 2000 when it was $17,234.
Whole page based on the data from 2000 / 2022 when the population of New Hope, Oregon was 1,515 / 1,395
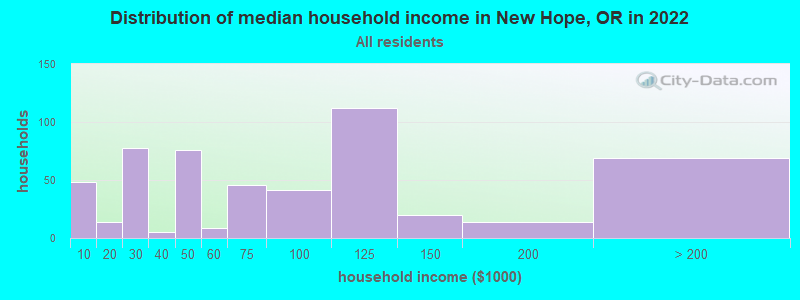
Income statistics for all residents
Median household income in New Hope, OR in 2022:
New Hope:
$65,482
State:
$75,657
Change in median household income between 2000 and 2022:
New Hope, Oregon:
+109.7%
State:
+84.9%
Number of households with income < $10k:
New Hope:
9.0% (48)
State:
5.1% (87,297)
Number of households with income $10k - 20k:
New Hope:
2.6% (14)
State:
6.7% (115,299)
Number of households with income $20k - 30k:
New Hope:
14.7% (78)
State:
6.9% (119,114)
Number of households with income $30k - 40k:
New Hope:
0.9% (5)
Oregon:
7.1% (122,333)
Number of households with income $40k - 50k:
New Hope:
14.3% (76)
State:
7.2% (124,562)
Number of households with income $50k - 60k:
New Hope:
1.7% (9)
State:
6.9% (118,435)
Number of households with income $60k - 75k:
New Hope:
8.6% (46)
State:
9.8% (168,926)
Number of households with income $75k - 100k:
New Hope:
7.7% (41)
State:
13.3% (229,104)
Number of households with income $100k - 125k:
New Hope:
21.1% (112)
State:
10.5% (181,787)
Number of households with income $125k - 150k:
New Hope:
3.8% (20)
State:
7.4% (127,392)
Number of households with income $150k - 200k:
New Hope:
2.6% (14)
Oregon:
8.6% (148,614)
Number of households with income > $200k:
New Hope:
13.0% (69)
Oregon:
10.6% (183,477)
Aggregate household income in New Hope in 2022: $46,713,276
Median family income in New Hope in 2022:
New Hope:
$73,958
State:
$93,384
Number of families with income $20k - 30k:
New Hope:
19.8% (79)
State:
4.5% (47,306)
Number of families with income $30k - 40k:
New Hope:
2.2% (9)
State:
5.8% (60,772)
Number of families with income $40k - 50k:
New Hope:
16.3% (65)
Oregon:
6.4% (66,435)
Number of families with income $50k - 60k:
New Hope:
2.3% (9)
State:
6.1% (63,915)
Number of families with income $60k - 75k:
New Hope:
9.9% (40)
Oregon:
9.9% (102,697)
Number of families with income $75k - 100k:
New Hope:
7.0% (28)
Oregon:
14.3% (148,745)
Number of families with income $100k - 125k:
New Hope:
28.7% (114)
State:
12.4% (129,023)
Number of families with income $125k - 150k:
New Hope:
5.3% (21)
State:
8.8% (91,808)
Number of families with income $150k - 200k:
New Hope:
3.3% (13)
State:
11.3% (117,224)
Number of families with income > $200k:
New Hope:
5.2% (21)
State:
14.4% (149,534)
Median income for 2 person families:
New Hope:
$66,713
Oregon:
$82,858
Median per capita income in New Hope in 2022:
New Hope:
$32,372
State:
$42,474
Change in median per capita income between 2000 and 2022:
New Hope, Oregon:
+87.8%
State:
+102.8%
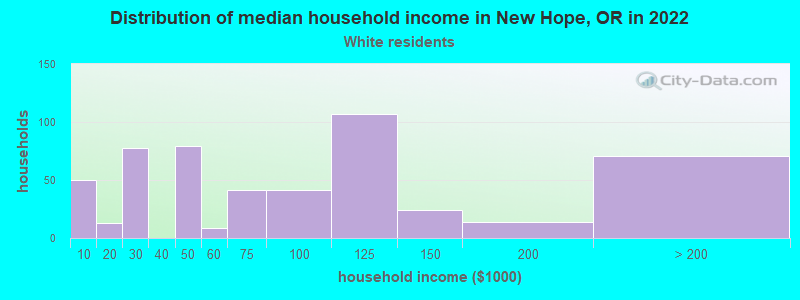
Income statistics for White residents
Median household income in New Hope, OR in 2022:
New Hope:
$65,454
State:
$76,846
Change in median household income between 2000 and 2022:
New Hope, Oregon:
+108.8%
Oregon:
+84.8%
Number of households with income < $10k:
New Hope:
9.5% (50)
State:
4.9% (67,757)
Number of households with income $10k - 20k:
New Hope:
2.5% (13)
Oregon:
6.6% (91,229)
Number of households with income $20k - 30k:
New Hope:
14.8% (78)
Oregon:
6.8% (93,981)
Number of households with income $30k - 40k:
New Hope:
0.0% (0)
Oregon:
6.9% (95,328)
Number of households with income $40k - 50k:
New Hope:
15.0% (79)
Oregon:
7.2% (100,221)
Number of households with income $50k - 60k:
New Hope:
1.7% (9)
State:
6.9% (95,294)
Number of households with income $60k - 75k:
New Hope:
7.8% (41)
State:
9.5% (132,178)
Number of households with income $75k - 100k:
New Hope:
7.8% (41)
Oregon:
13.5% (187,105)
Number of households with income $100k - 125k:
New Hope:
20.3% (107)
Oregon:
10.5% (145,264)
Number of households with income $125k - 150k:
New Hope:
4.6% (24)
State:
7.3% (101,755)
Number of households with income $150k - 200k:
New Hope:
2.7% (14)
State:
8.7% (121,099)
Number of households with income > $200k:
New Hope:
13.5% (71)
State:
11.1% (153,992)
Aggregate household income in New Hope in 2022: $46,682,294
Median family income in New Hope in 2022:
New Hope:
$73,839
State:
$95,912
Number of families with income $20k - 30k:
New Hope:
21.6% (87)
State:
4.1% (33,830)
Number of families with income $30k - 40k:
New Hope:
2.3% (9)
State:
5.6% (46,508)
Number of families with income $40k - 50k:
New Hope:
16.4% (66)
Oregon:
6.4% (53,001)
Number of families with income $50k - 60k:
New Hope:
2.2% (9)
State:
6.0% (49,589)
Number of families with income $60k - 75k:
New Hope:
8.0% (32)
State:
9.4% (77,838)
Number of families with income $75k - 100k:
New Hope:
6.9% (28)
State:
14.7% (121,106)
Number of families with income $100k - 125k:
New Hope:
28.0% (113)
Oregon:
12.3% (101,829)
Number of families with income $125k - 150k:
New Hope:
6.2% (25)
State:
8.9% (73,376)
Number of families with income $150k - 200k:
New Hope:
3.1% (13)
Oregon:
11.7% (96,629)
Number of families with income > $200k:
New Hope:
5.3% (21)
State:
15.2% (125,084)
Median per capita income in New Hope in 2022:
New Hope:
$33,033
Oregon:
$45,669
Change in median per capita income between 2000 and 2022:
New Hope, Oregon:
+88.5%
State:
+106.5%
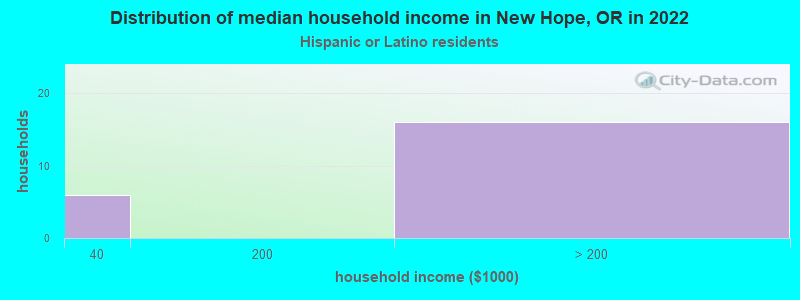
Income statistics for Hispanic or Latino residents
Number of households with income < $10k:
New Hope:
0.0% (0)
State:
5.0% (8,626)
Number of households with income $10k - 20k:
New Hope:
0.0% (0)
Oregon:
5.4% (9,284)
Number of households with income $20k - 30k:
New Hope:
0.0% (0)
State:
8.2% (14,265)
Number of households with income $30k - 40k:
New Hope:
27.3% (6)
State:
9.9% (17,228)
Number of households with income $40k - 50k:
New Hope:
0.0% (0)
Oregon:
9.2% (16,040)
Number of households with income $50k - 60k:
New Hope:
0.0% (0)
State:
7.8% (13,499)
Number of households with income $60k - 75k:
New Hope:
0.0% (0)
Oregon:
12.6% (21,845)
Number of households with income $75k - 100k:
New Hope:
0.0% (0)
State:
13.6% (23,566)
Number of households with income $100k - 125k:
New Hope:
0.0% (0)
Oregon:
10.2% (17,704)
Number of households with income $125k - 150k:
New Hope:
0.0% (0)
State:
5.9% (10,188)
Number of households with income $150k - 200k:
New Hope:
0.0% (0)
State:
7.1% (12,405)
Number of households with income > $200k:
New Hope:
72.7% (16)
Oregon:
5.1% (8,851)
Aggregate household income in New Hope in 2022: $107,894,900
Median per capita income in New Hope in 2022:
New Hope:
$21,786
State:
$25,274
Income statistics for Multirace residents
Aggregate household income in New Hope in 2022: $129,481,100
Median per capita income in New Hope in 2022:
New Hope:
$27,589
State:
$29,750
Change in median per capita income between 2000 and 2022:
New Hope, Oregon:
+95.4%
State:
+148.0%
Discuss New Hope, Oregon (OR) on our hugely popular Oregon forum.