The median household income in New Hope, TN in 2022 was $48,149, which was 35.5% less than the median annual income of $65,254 across the entire state of Tennessee. Compared to the median income of $35,179 in 2000 this represents an increase of 26.9%. The per capita income in 2022 was $27,485, which means an increase of 43.9% compared to 2000 when it was $15,424.
Whole page based on the data from 2000 / 2022 when the population of New Hope, Tennessee was 1,043 / 854
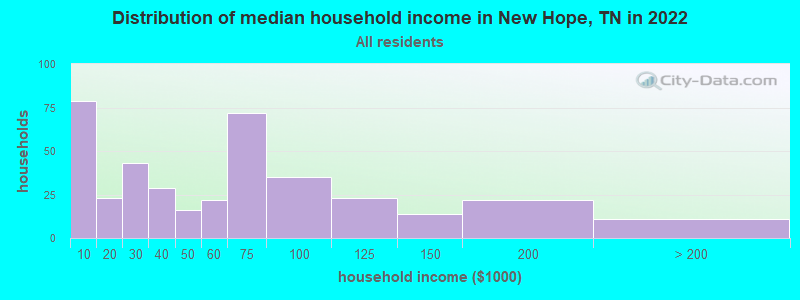
Income statistics for all residents
Median household income in New Hope, TN in 2022:
New Hope:
$48,149
State:
$65,254
Change in median household income between 2000 and 2022:
New Hope, Tennessee:
+36.9%
Tennessee:
+79.5%
Number of households with income < $10k:
New Hope:
20.3% (79)
Tennessee:
5.4% (154,793)
Number of households with income $10k - 20k:
New Hope:
5.9% (23)
State:
8.0% (228,599)
Number of households with income $20k - 30k:
New Hope:
11.1% (43)
State:
7.9% (224,908)
Number of households with income $30k - 40k:
New Hope:
7.5% (29)
State:
8.6% (244,297)
Number of households with income $40k - 50k:
New Hope:
4.1% (16)
State:
8.4% (238,949)
Number of households with income $50k - 60k:
New Hope:
5.7% (22)
State:
7.7% (218,438)
Number of households with income $60k - 75k:
New Hope:
18.5% (72)
State:
10.3% (294,172)
Number of households with income $75k - 100k:
New Hope:
9.0% (35)
State:
13.3% (377,310)
Number of households with income $100k - 125k:
New Hope:
5.9% (23)
State:
9.5% (269,124)
Number of households with income $125k - 150k:
New Hope:
3.6% (14)
Tennessee:
6.3% (178,328)
Number of households with income $150k - 200k:
New Hope:
5.7% (22)
State:
7.2% (204,030)
Number of households with income > $200k:
New Hope:
2.8% (11)
Tennessee:
7.5% (213,736)
Aggregate household income in New Hope in 2022: $23,346,240
Median family income in New Hope in 2022:
New Hope:
$62,664
State:
$80,910
Number of families with income < $10k:
New Hope:
4.4% (11)
State:
3.9% (72,917)
Number of families with income $10k - 20k:
New Hope:
6.6% (16)
State:
4.0% (73,770)
Number of families with income $20k - 30k:
New Hope:
6.4% (15)
State:
5.6% (104,070)
Number of families with income $30k - 40k:
New Hope:
6.1% (15)
State:
7.2% (133,292)
Number of families with income $40k - 50k:
New Hope:
2.3% (5)
Tennessee:
7.4% (136,997)
Number of families with income $50k - 60k:
New Hope:
18.6% (44)
State:
7.1% (131,374)
Number of families with income $60k - 75k:
New Hope:
16.5% (40)
State:
10.8% (198,685)
Number of families with income $75k - 100k:
New Hope:
11.8% (28)
State:
15.1% (279,195)
Number of families with income $100k - 125k:
New Hope:
7.8% (19)
Tennessee:
11.7% (216,356)
Number of families with income $125k - 150k:
New Hope:
5.6% (13)
Tennessee:
7.8% (144,000)
Number of families with income $150k - 200k:
New Hope:
9.3% (22)
State:
9.3% (172,160)
Number of families with income > $200k:
New Hope:
4.5% (11)
State:
10.0% (183,756)
Median per capita income in New Hope in 2022:
New Hope:
$27,485
Tennessee:
$36,704
Change in median per capita income between 2000 and 2022:
New Hope, Tennessee:
+78.2%
State:
+89.3%
Income statistics for White residents
Median household income in New Hope, TN in 2022:
New Hope:
$47,135
Tennessee:
$69,826
Change in median household income between 2000 and 2022:
New Hope, Tennessee:
+34.0%
State:
+82.9%
Number of households with income < $10k:
New Hope:
21.3% (80)
Tennessee:
4.6% (100,279)
Number of households with income $10k - 20k:
New Hope:
6.1% (23)
Tennessee:
7.6% (165,031)
Number of households with income $20k - 30k:
New Hope:
11.2% (42)
Tennessee:
7.4% (160,229)
Number of households with income $30k - 40k:
New Hope:
7.7% (29)
Tennessee:
8.1% (174,784)
Number of households with income $40k - 50k:
New Hope:
3.7% (14)
State:
7.8% (169,622)
Number of households with income $50k - 60k:
New Hope:
4.3% (16)
State:
7.6% (165,508)
Number of households with income $60k - 75k:
New Hope:
18.6% (70)
Tennessee:
10.3% (223,937)
Number of households with income $75k - 100k:
New Hope:
9.0% (34)
Tennessee:
13.5% (292,688)
Number of households with income $100k - 125k:
New Hope:
6.1% (23)
State:
10.1% (219,251)
Number of households with income $125k - 150k:
New Hope:
3.5% (13)
Tennessee:
6.6% (142,574)
Number of households with income $150k - 200k:
New Hope:
5.6% (21)
State:
7.7% (166,039)
Number of households with income > $200k:
New Hope:
2.9% (11)
State:
8.5% (184,546)
Aggregate household income in New Hope in 2022: $22,634,461
Median family income in New Hope in 2022:
New Hope:
$63,041
State:
$86,015
Number of families with income < $10k:
New Hope:
4.6% (11)
State:
3.1% (43,751)
Number of families with income $10k - 20k:
New Hope:
6.9% (16)
State:
3.5% (49,925)
Number of families with income $20k - 30k:
New Hope:
6.4% (15)
State:
5.0% (70,431)
Number of families with income $30k - 40k:
New Hope:
6.1% (14)
State:
6.6% (93,498)
Number of families with income $40k - 50k:
New Hope:
1.9% (4)
State:
6.8% (96,726)
Number of families with income $50k - 60k:
New Hope:
18.3% (43)
State:
7.2% (101,879)
Number of families with income $60k - 75k:
New Hope:
16.7% (39)
State:
10.7% (151,997)
Number of families with income $75k - 100k:
New Hope:
11.8% (27)
State:
15.4% (218,373)
Number of families with income $100k - 125k:
New Hope:
8.0% (19)
State:
12.6% (178,761)
Number of families with income $125k - 150k:
New Hope:
5.6% (13)
Tennessee:
8.2% (116,575)
Number of families with income $150k - 200k:
New Hope:
9.2% (21)
State:
9.9% (141,123)
Number of families with income > $200k:
New Hope:
4.6% (11)
Tennessee:
11.2% (159,431)
Median per capita income in New Hope in 2022:
New Hope:
$27,848
State:
$40,126
Change in median per capita income between 2000 and 2022:
New Hope, Tennessee:
+81.5%
State:
+92.6%
Income statistics for Multirace residents
Median household income in New Hope, TN in 2022:
New Hope:
$50,225
State:
$57,741
Aggregate household income in New Hope in 2022: $464,313
Median per capita income in New Hope in 2022:
New Hope:
$21,363
Tennessee:
$24,436
Discuss New Hope, Tennessee (TN) on our hugely popular Tennessee forum.