New Market, Kentucky (KY) income map, earnings map, and wages data
The median household income in New Market, KY in 2022 was $68,377, which was 13.2% greater than the median annual income of $59,341 across the entire state of Kentucky. Compared to the median income of $38,750 in 2000 this represents an increase of 43.3%. The per capita income in 2022 was $25,167, which means an increase of 47.0% compared to 2000 when it was $13,345.
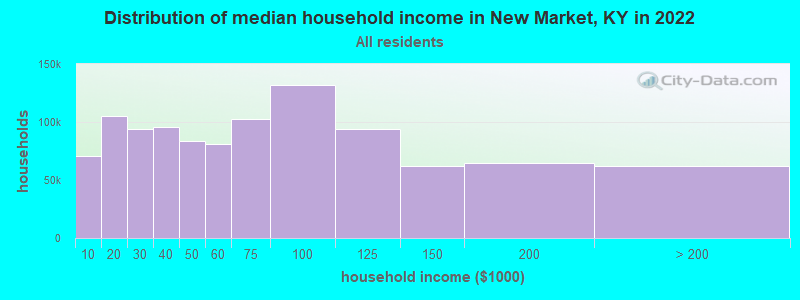
Income statistics for all residents
Median household income in New Market, KY in 2022:| New Market: | $68,377 |
| State: | $59,341 |
Change in median household income between 2000 and 2022:| New Market, Kentucky: | +76.5% |
| Kentucky: | +76.2% |
Number of households with income < $10k:| New Market: | 6.8% (70,855) |
| State: | 6.8% (123,697) |
Number of households with income $10k - 20k:| New Market: | 10.0% (105,247) |
| State: | 10.0% (182,645) |
Number of households with income $20k - 30k:| New Market: | 9.0% (94,168) |
| State: | 9.0% (164,092) |
Number of households with income $30k - 40k:| New Market: | 9.1% (95,332) |
| Kentucky: | 9.1% (165,607) |
Number of households with income $40k - 50k:| New Market: | 8.0% (83,485) |
| Kentucky: | 8.0% (146,315) |
Number of households with income $50k - 60k:| New Market: | 7.7% (80,917) |
| State: | 7.7% (140,671) |
Number of households with income $60k - 75k:| New Market: | 9.8% (102,849) |
| State: | 9.8% (180,002) |
Number of households with income $75k - 100k:| New Market: | 12.6% (132,193) |
| State: | 12.6% (230,239) |
Number of households with income $100k - 125k:| New Market: | 9.0% (94,395) |
| State: | 9.0% (164,398) |
Number of households with income $125k - 150k:| New Market: | 5.9% (62,079) |
| State: | 5.9% (108,602) |
Number of households with income $150k - 200k:| New Market: | 6.1% (64,312) |
| State: | 6.2% (112,813) |
Number of households with income > $200k:| New Market: | 5.9% (62,077) |
| Kentucky: | 6.0% (109,599) |
Aggregate household income in New Market in 2022: $317,983,874
Median family income in New Market in 2022:| New Market: | $85,701 |
| State: | $76,119 |
Median non-family income in New Market in 2022:| New Market: | $17,487 |
| State: | $33,993 |
Change in median non-family income between 2000 and 2022:| New Market, Kentucky: | +80.5% |
| State: | +79.2% |
Median per capita income in New Market in 2022:| New Market: | $25,167 |
| State: | $33,980 |
Change in median per capita income between 2000 and 2022:| New Market, Kentucky: | +88.6% |
| Kentucky: | +87.8% |
Income statistics for White residents
Median household income in New Market, KY in 2022:| New Market: | $68,450 |
| Kentucky: | $60,987 |
Change in median household income between 2000 and 2022:| New Market, Kentucky: | +76.6% |
| Kentucky: | +76.2% |
Number of households with income < $10k:| New Market: | 6.2% (54,667) |
| State: | 6.2% (96,690) |
Number of households with income $10k - 20k:| New Market: | 9.8% (85,854) |
| Kentucky: | 9.7% (151,125) |
Number of households with income $20k - 30k:| New Market: | 9.0% (78,798) |
| Kentucky: | 8.9% (139,532) |
Number of households with income $30k - 40k:| New Market: | 9.1% (80,449) |
| State: | 9.1% (142,284) |
Number of households with income $40k - 50k:| New Market: | 7.7% (67,792) |
| State: | 7.7% (121,151) |
Number of households with income $50k - 60k:| New Market: | 7.7% (67,808) |
| State: | 7.7% (119,790) |
Number of households with income $60k - 75k:| New Market: | 9.8% (86,333) |
| State: | 9.9% (154,174) |
Number of households with income $75k - 100k:| New Market: | 12.8% (112,492) |
| Kentucky: | 12.8% (199,740) |
Number of households with income $100k - 125k:| New Market: | 9.4% (82,246) |
| State: | 9.4% (146,284) |
Number of households with income $125k - 150k:| New Market: | 6.0% (52,702) |
| Kentucky: | 6.0% (94,180) |
Number of households with income $150k - 200k:| New Market: | 6.4% (56,105) |
| State: | 6.4% (100,702) |
Number of households with income > $200k:| New Market: | 6.2% (54,298) |
| Kentucky: | 6.3% (98,502) |
Aggregate household income in New Market in 2022: $276,946,182
Median family income in New Market in 2022:| New Market: | $86,907 |
| Kentucky: | $78,353 |
Number of families with income < $10k:| New Market: | 2.1% (3) |
| Kentucky: | 3.7% (37,075) |
Number of families with income $10k - 20k:| New Market: | 4.4% (6) |
| State: | 4.9% (49,864) |
Number of families with income $20k - 30k:| New Market: | 10.6% (15) |
| State: | 6.4% (64,043) |
Number of families with income $30k - 40k:| New Market: | 10.7% (15) |
| State: | 8.0% (81,080) |
Number of families with income $40k - 50k:| New Market: | 19.0% (26) |
| State: | 6.9% (69,099) |
Number of families with income $50k - 60k:| New Market: | 8.7% (12) |
| State: | 7.2% (72,955) |
Number of families with income $60k - 75k:| New Market: | 13.8% (19) |
| State: | 10.4% (104,587) |
Number of families with income $75k - 100k:| New Market: | 17.7% (25) |
| State: | 15.0% (151,545) |
Number of families with income $100k - 125k:| New Market: | 12.9% (18) |
| State: | 11.9% (120,340) |
Median non-family income in New Market in 2022:| New Market: | $17,406 |
| State: | $34,415 |
Change in median non-family income between 2000 and 2022:| New Market, Kentucky: | +79.7% |
| Kentucky: | +78.3% |
Median per capita income in New Market in 2022:| New Market: | $25,474 |
| Kentucky: | $35,352 |
Change in median per capita income between 2000 and 2022:| New Market, Kentucky: | +90.9% |
| State: | +90.2% |