The median household income in New Waverly, TX in 2022 was $50,005, which was 44.6% less than the median annual income of $72,284 across the entire state of Texas. Compared to the median income of $29,583 in 2000 this represents an increase of 40.8%. The per capita income in 2022 was $28,208, which means an increase of 48.7% compared to 2000 when it was $14,475.
Whole page based on the data from 2000 / 2022 when the population of New Waverly, Texas was 950 / 1,126
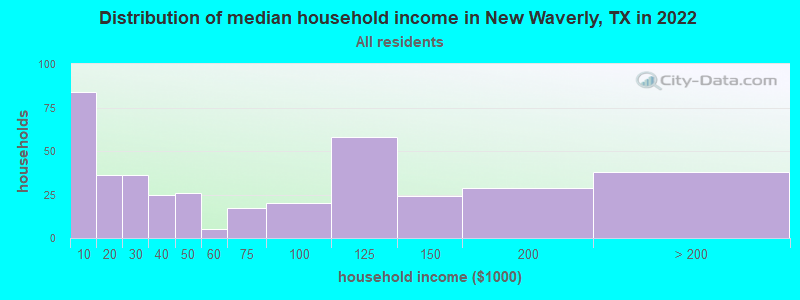
Income statistics for all residents
Median household income in New Waverly, TX in 2022:
New Waverly:
$50,006
Texas:
$72,284
Change in median household income between 2000 and 2022:
New Waverly, Texas:
+69.0%
State:
+81.0%
Number of households with income < $10k:
New Waverly:
21.1% (84)
State:
5.5% (611,011)
Number of households with income $10k - 20k:
New Waverly:
9.0% (36)
Texas:
6.7% (743,157)
Number of households with income $20k - 30k:
New Waverly:
9.0% (36)
State:
7.2% (803,381)
Number of households with income $30k - 40k:
New Waverly:
6.3% (25)
Texas:
7.8% (866,080)
Number of households with income $40k - 50k:
New Waverly:
6.5% (26)
State:
7.3% (810,440)
Number of households with income $50k - 60k:
New Waverly:
1.3% (5)
State:
7.2% (799,783)
Number of households with income $60k - 75k:
New Waverly:
4.3% (17)
State:
9.9% (1,095,384)
Number of households with income $75k - 100k:
New Waverly:
5.0% (20)
State:
12.8% (1,419,057)
Number of households with income $100k - 125k:
New Waverly:
14.6% (58)
Texas:
9.5% (1,054,577)
Number of households with income $125k - 150k:
New Waverly:
6.0% (24)
State:
6.7% (741,518)
Number of households with income $150k - 200k:
New Waverly:
7.3% (29)
State:
8.7% (961,776)
Number of households with income > $200k:
New Waverly:
9.5% (38)
State:
10.7% (1,181,544)
Aggregate household income in New Waverly in 2022: $30,745,331
Median family income in New Waverly in 2022:
New Waverly:
$88,347
State:
$86,267
Number of families with income < $10k:
New Waverly:
11.4% (28)
State:
4.0% (297,884)
Number of families with income $10k - 20k:
New Waverly:
6.7% (16)
State:
4.3% (324,514)
Number of families with income $20k - 30k:
New Waverly:
2.1% (5)
Texas:
5.8% (430,949)
Number of families with income $30k - 40k:
New Waverly:
6.2% (15)
State:
6.6% (493,535)
Number of families with income $40k - 50k:
New Waverly:
9.3% (23)
Texas:
6.7% (499,663)
Number of families with income $50k - 60k:
New Waverly:
2.3% (6)
State:
6.6% (492,203)
Number of families with income $60k - 75k:
New Waverly:
7.9% (19)
Texas:
9.5% (710,229)
Number of families with income $75k - 100k:
New Waverly:
7.5% (18)
State:
13.6% (1,015,480)
Number of families with income $100k - 125k:
New Waverly:
16.4% (40)
Texas:
10.7% (797,961)
Number of families with income $125k - 150k:
New Waverly:
11.2% (27)
Texas:
8.1% (602,985)
Number of families with income $150k - 200k:
New Waverly:
9.8% (24)
State:
10.7% (804,459)
Number of families with income > $200k:
New Waverly:
9.4% (23)
Texas:
13.5% (1,013,514)
Median income for families with 0 earners:
New Waverly:
$0
State:
$41,529
Median income for families with 1 earner:
New Waverly:
$0
State:
$59,030
Median income for families with 2 earners:
New Waverly:
$108,964
Texas:
$111,348
Median income for families with 3+ earners:
New Waverly:
$0
State:
$132,976
Median non-family income in New Waverly in 2022:
New Waverly:
$18,477
Texas:
$45,999
Change in median non-family income between 2000 and 2022:
New Waverly, Texas:
+38.0%
Texas:
+79.5%
Median per capita income in New Waverly in 2022:
New Waverly:
$28,208
Texas:
$38,123
Change in median per capita income between 2000 and 2022:
New Waverly, Texas:
+94.9%
Texas:
+94.3%
Income statistics for White residents
Median household income in New Waverly, TX in 2022:
New Waverly:
$49,682
State:
$82,032
Change in median household income between 2000 and 2022:
New Waverly, Texas:
+52.9%
State:
+91.0%
Number of households with income < $10k:
New Waverly:
17.0% (53)
State:
4.7% (273,716)
Number of households with income $10k - 20k:
New Waverly:
18.0% (56)
State:
5.5% (322,702)
Number of households with income $20k - 30k:
New Waverly:
5.1% (16)
State:
6.2% (363,947)
Number of households with income $30k - 40k:
New Waverly:
5.5% (17)
Texas:
6.8% (399,275)
Number of households with income $40k - 50k:
New Waverly:
11.6% (36)
State:
6.5% (383,417)
Number of households with income $50k - 60k:
New Waverly:
1.9% (6)
State:
6.6% (388,535)
Number of households with income $60k - 75k:
New Waverly:
5.5% (17)
State:
9.7% (566,295)
Number of households with income $75k - 100k:
New Waverly:
6.8% (21)
State:
13.0% (760,276)
Number of households with income $100k - 125k:
New Waverly:
14.8% (46)
State:
10.2% (597,596)
Number of households with income $125k - 150k:
New Waverly:
7.7% (24)
State:
7.4% (436,830)
Number of households with income $150k - 200k:
New Waverly:
5.1% (16)
State:
9.9% (583,067)
Number of households with income > $200k:
New Waverly:
1.0% (3)
State:
13.5% (792,647)
Aggregate household income in New Waverly in 2022: $22,756,338
Median family income in New Waverly in 2022:
New Waverly:
$87,711
State:
$101,788
Number of families with income < $10k:
New Waverly:
5.7% (10)
State:
2.8% (108,142)
Number of families with income $10k - 20k:
New Waverly:
6.0% (10)
State:
2.9% (113,421)
Number of families with income $20k - 30k:
New Waverly:
2.4% (4)
State:
4.1% (157,688)
Number of families with income $30k - 40k:
New Waverly:
8.4% (14)
Texas:
5.2% (198,847)
Number of families with income $40k - 50k:
New Waverly:
14.5% (24)
State:
5.6% (216,490)
Number of families with income $50k - 60k:
New Waverly:
1.4% (2)
State:
5.7% (220,689)
Number of families with income $60k - 75k:
New Waverly:
6.2% (10)
State:
9.0% (346,106)
Number of families with income $75k - 100k:
New Waverly:
11.0% (18)
Texas:
13.7% (527,363)
Number of families with income $100k - 125k:
New Waverly:
19.2% (32)
State:
11.6% (448,411)
Number of families with income $125k - 150k:
New Waverly:
11.7% (20)
State:
9.2% (355,798)
Number of families with income $150k - 200k:
New Waverly:
12.4% (21)
State:
12.5% (480,185)
Number of families with income > $200k:
New Waverly:
1.1% (2)
State:
17.6% (677,490)
Median per capita income in New Waverly in 2022:
New Waverly:
$25,209
State:
$47,740
Change in median per capita income between 2000 and 2022:
New Waverly, Texas:
+46.9%
State:
+114.3%
Income statistics for Black or African American residents
Number of households with income < $10k:
New Waverly:
48.0% (24)
State:
8.9% (126,378)
Number of households with income $10k - 20k:
New Waverly:
0.0% (0)
State:
9.9% (140,369)
Number of households with income $20k - 30k:
New Waverly:
28.0% (14)
Texas:
8.5% (120,639)
Number of households with income $30k - 40k:
New Waverly:
8.0% (4)
Texas:
9.7% (137,517)
Number of households with income $40k - 50k:
New Waverly:
8.0% (4)
State:
8.0% (112,973)
Number of households with income $50k - 60k:
New Waverly:
0.0% (0)
Texas:
8.3% (117,156)
Number of households with income $60k - 75k:
New Waverly:
0.0% (0)
State:
10.4% (147,462)
Number of households with income $75k - 100k:
New Waverly:
0.0% (0)
State:
11.5% (162,718)
Number of households with income $100k - 125k:
New Waverly:
6.0% (3)
State:
8.2% (115,829)
Number of households with income $125k - 150k:
New Waverly:
0.0% (0)
State:
4.9% (69,556)
Number of households with income $150k - 200k:
New Waverly:
2.0% (1)
Texas:
6.4% (90,701)
Number of households with income > $200k:
New Waverly:
0.0% (0)
State:
5.5% (77,988)
Aggregate household income in New Waverly in 2022: $1,258,991
Median family income in New Waverly in 2022:
New Waverly:
$3,205
State:
$69,134
Number of families with income < $10k:
New Waverly:
76.6% (13)
State:
6.8% (55,625)
Number of families with income $50k - 60k:
New Waverly:
17.1% (3)
State:
7.3% (59,511)
Number of families with income $150k - 200k:
New Waverly:
6.3% (1)
Texas:
9.4% (76,146)
Median non-family income in New Waverly in 2022:
New Waverly:
$29,220
State:
$40,133
Median per capita income in New Waverly in 2022:
New Waverly:
$14,845
State:
$30,490
Change in median per capita income between 2000 and 2022:
New Waverly, Texas:
+41.0%
Texas:
+113.9%
Income statistics for Asian residents
Number of households with income < $10k:
New Waverly:
0.0% (0)
State:
5.2% (29,885)
Number of households with income $10k - 20k:
New Waverly:
0.0% (0)
Texas:
4.7% (27,044)
Number of households with income $20k - 30k:
New Waverly:
0.0% (0)
State:
4.1% (23,363)
Number of households with income $30k - 40k:
New Waverly:
0.0% (0)
State:
4.1% (23,309)
Number of households with income $40k - 50k:
New Waverly:
0.0% (0)
Texas:
5.2% (29,826)
Number of households with income $50k - 60k:
New Waverly:
0.0% (0)
State:
4.7% (26,512)
Number of households with income $60k - 75k:
New Waverly:
0.0% (0)
Texas:
6.5% (36,905)
Number of households with income $75k - 100k:
New Waverly:
0.0% (0)
State:
11.3% (64,350)
Number of households with income $100k - 125k:
New Waverly:
0.0% (0)
State:
11.4% (64,714)
Number of households with income $125k - 150k:
New Waverly:
0.0% (0)
State:
9.3% (52,719)
Number of households with income $150k - 200k:
New Waverly:
0.0% (0)
State:
12.5% (70,953)
Number of households with income > $200k:
New Waverly:
100.0% (23)
State:
21.1% (120,260)
Median per capita income in New Waverly in 2022:
New Waverly:
$98,584
State:
$48,626
Income statistics for Hispanic or Latino residents
Median household income in New Waverly, TX in 2022:
New Waverly:
$50,002
Texas:
$60,504
Aggregate household income in New Waverly in 2022: $735,921
Median family income in New Waverly in 2022:
New Waverly:
$97,409
Texas:
$65,080
Number of families with income $20k - 30k:
New Waverly:
16.0% (2)
State:
8.6% (238,528)
Number of families with income $40k - 50k:
New Waverly:
84.0% (10)
State:
8.6% (240,188)
Median per capita income in New Waverly in 2022:
New Waverly:
$6,883
Texas:
$24,862
Change in median per capita income between 2000 and 2022:
New Waverly, Texas:
+8.2%
Texas:
+130.8%
Income statistics for Multirace residents
Aggregate household income in New Waverly in 2022: $10,874,290
Median per capita income in New Waverly in 2022:
New Waverly:
$30,852
Texas:
$26,785
Change in median per capita income between 2000 and 2022:
New Waverly, Texas:
+83.1%
State:
+110.9%
Income statistics for other residents
Median per capita income in New Waverly in 2022:
New Waverly:
$22,970
Texas:
$23,899
Discuss New Waverly, Texas (TX) on our hugely popular Texas forum.