Newgulf, Texas (TX) income map, earnings map, and wages data
The median household income in Newgulf, TX in 2022 was $64,486, which was 12.1% less than the median annual income of $72,284 across the entire state of Texas. Compared to the median income of $34,979 in 2000 this represents an increase of 45.8%. The per capita income in 2022 was $30,079, which means an increase of 48.5% compared to 2000 when it was $15,488.
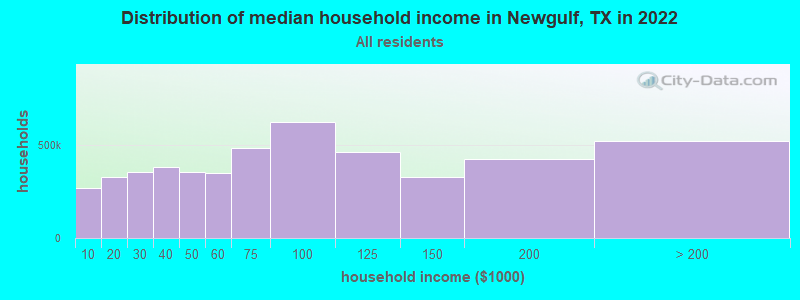
Income statistics for all residents
Median household income in Newgulf, TX in 2022:| Newgulf: | $64,487 |
| Texas: | $72,284 |
Change in median household income between 2000 and 2022:| Newgulf, Texas: | +84.4% |
| State: | +81.0% |
Number of households with income < $10k:| Newgulf: | 5.5% (267,499) |
| Texas: | 5.5% (611,011) |
Number of households with income $10k - 20k:| Newgulf: | 6.7% (325,521) |
| State: | 6.7% (743,157) |
Number of households with income $20k - 30k:| Newgulf: | 7.2% (351,911) |
| State: | 7.2% (803,381) |
Number of households with income $30k - 40k:| Newgulf: | 7.8% (379,333) |
| Texas: | 7.8% (866,080) |
Number of households with income $40k - 50k:| Newgulf: | 7.3% (354,978) |
| State: | 7.3% (810,440) |
Number of households with income $50k - 60k:| Newgulf: | 7.2% (350,263) |
| State: | 7.2% (799,783) |
Number of households with income $60k - 75k:| Newgulf: | 9.9% (479,744) |
| Texas: | 9.9% (1,095,384) |
Number of households with income $75k - 100k:| Newgulf: | 12.8% (621,672) |
| State: | 12.8% (1,419,057) |
Number of households with income $100k - 125k:| Newgulf: | 9.5% (462,045) |
| Texas: | 9.5% (1,054,577) |
Number of households with income $125k - 150k:| Newgulf: | 6.7% (324,965) |
| State: | 6.7% (741,518) |
Number of households with income $150k - 200k:| Newgulf: | 8.7% (421,255) |
| State: | 8.7% (961,776) |
Number of households with income > $200k:| Newgulf: | 10.7% (517,300) |
| State: | 10.7% (1,181,544) |
Aggregate household income in Newgulf in 2022: $14,887,912,259
Median family income in Newgulf in 2022:| Newgulf: | $77,230 |
| State: | $86,267 |
Median non-family income in Newgulf in 2022:| Newgulf: | $34,950 |
| State: | $45,999 |
Change in median non-family income between 2000 and 2022:| Newgulf, Texas: | +85.2% |
| State: | +79.5% |
Median per capita income in Newgulf in 2022:| Newgulf: | $30,080 |
| State: | $38,123 |
Change in median per capita income between 2000 and 2022:| Newgulf, Texas: | +94.2% |
| Texas: | +94.3% |
Income statistics for White residents
Median household income in Newgulf, TX in 2022:| Newgulf: | $72,694 |
| Texas: | $82,032 |
Change in median household income between 2000 and 2022:| Newgulf, Texas: | +90.4% |
| Texas: | +91.0% |
Number of households with income < $10k:| Newgulf: | 4.7% (121,314) |
| Texas: | 4.7% (273,716) |
Number of households with income $10k - 20k:| Newgulf: | 5.5% (143,287) |
| Texas: | 5.5% (322,702) |
Number of households with income $20k - 30k:| Newgulf: | 6.2% (161,689) |
| State: | 6.2% (363,947) |
Number of households with income $30k - 40k:| Newgulf: | 6.8% (177,231) |
| Texas: | 6.8% (399,275) |
Number of households with income $40k - 50k:| Newgulf: | 6.5% (170,132) |
| Texas: | 6.5% (383,417) |
Number of households with income $50k - 60k:| Newgulf: | 6.6% (172,370) |
| State: | 6.6% (388,535) |
Number of households with income $60k - 75k:| Newgulf: | 9.6% (250,900) |
| Texas: | 9.7% (566,295) |
Number of households with income $75k - 100k:| Newgulf: | 13.0% (337,168) |
| State: | 13.0% (760,276) |
Number of households with income $100k - 125k:| Newgulf: | 10.2% (265,027) |
| State: | 10.2% (597,596) |
Number of households with income $125k - 150k:| Newgulf: | 7.4% (193,675) |
| State: | 7.4% (436,830) |
Number of households with income $150k - 200k:| Newgulf: | 9.9% (258,306) |
| State: | 9.9% (583,067) |
Number of households with income > $200k:| Newgulf: | 13.5% (350,237) |
| State: | 13.5% (792,647) |
Aggregate household income in Newgulf in 2022: $7,161,484,840
Median family income in Newgulf in 2022:| Newgulf: | $91,141 |
| Texas: | $101,788 |
Number of families with income < $10k:| Newgulf: | 5.0% (32) |
| Texas: | 2.8% (108,142) |
Number of families with income $10k - 20k:| Newgulf: | 3.6% (23) |
| Texas: | 2.9% (113,421) |
Number of families with income $20k - 30k:| Newgulf: | 6.1% (39) |
| Texas: | 4.1% (157,688) |
Number of families with income $30k - 40k:| Newgulf: | 5.1% (33) |
| State: | 5.2% (198,847) |
Number of families with income $40k - 50k:| Newgulf: | 11.3% (72) |
| Texas: | 5.6% (216,490) |
Number of families with income $50k - 60k:| Newgulf: | 10.3% (65) |
| State: | 5.7% (220,689) |
Number of families with income $60k - 75k:| Newgulf: | 12.7% (81) |
| State: | 9.0% (346,106) |
Number of families with income $75k - 100k:| Newgulf: | 7.6% (48) |
| State: | 13.7% (527,363) |
Number of families with income $100k - 125k:| Newgulf: | 6.0% (38) |
| State: | 11.6% (448,411) |
Number of families with income $125k - 150k:| Newgulf: | 10.1% (64) |
| State: | 9.2% (355,798) |
Number of families with income $150k - 200k:| Newgulf: | 4.7% (30) |
| State: | 12.5% (480,185) |
Number of families with income > $200k:| Newgulf: | 17.4% (110) |
| State: | 17.6% (677,490) |
Median non-family income in Newgulf in 2022:| Newgulf: | $36,469 |
| Texas: | $50,587 |
Change in median non-family income between 2000 and 2022:| Newgulf, Texas: | +85.8% |
| State: | +87.7% |
Median per capita income in Newgulf in 2022:| Newgulf: | $35,092 |
| Texas: | $47,740 |
Change in median per capita income between 2000 and 2022:| Newgulf, Texas: | +112.1% |
| State: | +114.3% |
Income statistics for Black or African American residents
Median household income in Newgulf, TX in 2022:| Newgulf: | $79,450 |
| Texas: | $55,759 |
Change in median household income between 2000 and 2022:| Newgulf, Texas: | +113.5% |
| State: | +90.3% |
Number of households with income < $10k:| Newgulf: | 8.9% (79,932) |
| State: | 8.9% (126,378) |
Number of households with income $10k - 20k:| Newgulf: | 9.9% (89,363) |
| Texas: | 9.9% (140,369) |
Number of households with income $20k - 30k:| Newgulf: | 8.5% (76,883) |
| Texas: | 8.5% (120,639) |
Number of households with income $30k - 40k:| Newgulf: | 9.7% (86,925) |
| State: | 9.7% (137,517) |
Number of households with income $40k - 50k:| Newgulf: | 7.9% (71,410) |
| State: | 8.0% (112,973) |
Number of households with income $50k - 60k:| Newgulf: | 8.2% (73,994) |
| Texas: | 8.3% (117,156) |
Number of households with income $60k - 75k:| Newgulf: | 10.4% (93,407) |
| State: | 10.4% (147,462) |
Number of households with income $75k - 100k:| Newgulf: | 11.5% (103,137) |
| State: | 11.5% (162,718) |
Number of households with income $100k - 125k:| Newgulf: | 8.1% (73,228) |
| State: | 8.2% (115,829) |
Number of households with income $125k - 150k:| Newgulf: | 4.9% (44,375) |
| Texas: | 4.9% (69,556) |
Number of households with income $150k - 200k:| Newgulf: | 6.4% (57,473) |
| State: | 6.4% (90,701) |
Number of households with income > $200k:| Newgulf: | 5.5% (49,376) |
| Texas: | 5.5% (77,988) |
Aggregate household income in Newgulf in 2022: $154,922,440
Median family income in Newgulf in 2022:| Newgulf: | $81,949 |
| State: | $69,134 |
Number of families with income $10k - 20k:| Newgulf: | 5.0% (3) |
| State: | 6.8% (55,300) |
Number of families with income $20k - 30k:| Newgulf: | 6.6% (4) |
| State: | 7.1% (57,877) |
Number of families with income $30k - 40k:| Newgulf: | 25.8% (17) |
| Texas: | 8.5% (68,776) |
Number of families with income $40k - 50k:| Newgulf: | 5.2% (3) |
| State: | 7.1% (57,907) |
Number of families with income $60k - 75k:| Newgulf: | 14.9% (10) |
| State: | 10.1% (81,994) |
Number of families with income $75k - 100k:| Newgulf: | 42.5% (28) |
| Texas: | 12.7% (103,723) |
Median non-family income in Newgulf in 2022:| Newgulf: | $180,430 |
| Texas: | $40,133 |
Change in median non-family income between 2000 and 2022:| Newgulf, Texas: | +133.0% |
| State: | +102.2% |
Median per capita income in Newgulf in 2022:| Newgulf: | $50,594 |
| State: | $30,490 |
Change in median per capita income between 2000 and 2022:| Newgulf, Texas: | +116.3% |
| State: | +113.9% |
Income statistics for Hispanic or Latino residents
Median household income in Newgulf, TX in 2022:| Newgulf: | $52,115 |
| State: | $60,504 |
Change in median household income between 2000 and 2022:| Newgulf, Texas: | +112.9% |
| Texas: | +102.5% |
Number of households with income < $10k:| Newgulf: | 5.8% (87,757) |
| Texas: | 5.8% (213,953) |
Number of households with income $10k - 20k:| Newgulf: | 8.0% (122,050) |
| State: | 8.0% (297,456) |
Number of households with income $20k - 30k:| Newgulf: | 9.2% (139,450) |
| Texas: | 9.2% (340,166) |
Number of households with income $30k - 40k:| Newgulf: | 9.5% (145,391) |
| State: | 9.5% (354,336) |
Number of households with income $40k - 50k:| Newgulf: | 8.8% (134,089) |
| State: | 8.8% (327,013) |
Number of households with income $50k - 60k:| Newgulf: | 8.3% (126,554) |
| Texas: | 8.3% (308,818) |
Number of households with income $60k - 75k:| Newgulf: | 10.9% (166,160) |
| State: | 10.9% (405,109) |
Number of households with income $75k - 100k:| Newgulf: | 13.8% (209,948) |
| State: | 13.8% (511,639) |
Number of households with income $100k - 125k:| Newgulf: | 8.6% (131,207) |
| State: | 8.6% (319,728) |
Number of households with income $125k - 150k:| Newgulf: | 5.7% (86,635) |
| State: | 5.7% (210,932) |
Number of households with income $150k - 200k:| Newgulf: | 6.4% (96,755) |
| State: | 6.4% (236,055) |
Number of households with income > $200k:| Newgulf: | 5.1% (77,681) |
| State: | 5.1% (189,259) |
Aggregate household income in Newgulf in 2022: $936,000,132
Median family income in Newgulf in 2022:| Newgulf: | $53,799 |
| State: | $65,080 |
Number of families with income < $10k:| Newgulf: | 8.9% (38) |
| State: | 5.3% (147,493) |
Number of families with income $10k - 20k:| Newgulf: | 6.1% (26) |
| State: | 6.3% (174,531) |
Number of families with income $20k - 30k:| Newgulf: | 11.8% (50) |
| State: | 8.6% (238,528) |
Number of families with income $30k - 40k:| Newgulf: | 10.4% (44) |
| State: | 9.1% (251,999) |
Number of families with income $40k - 50k:| Newgulf: | 11.2% (48) |
| Texas: | 8.6% (240,188) |
Number of families with income $50k - 60k:| Newgulf: | 13.1% (56) |
| State: | 8.0% (223,566) |
Number of families with income $60k - 75k:| Newgulf: | 15.3% (65) |
| Texas: | 10.9% (302,688) |
Number of families with income $75k - 100k:| Newgulf: | 7.4% (32) |
| State: | 14.3% (398,554) |
Number of families with income $100k - 125k:| Newgulf: | 4.3% (18) |
| Texas: | 9.5% (264,007) |
Number of families with income $125k - 150k:| Newgulf: | 6.0% (25) |
| State: | 6.2% (171,274) |
Number of families with income $150k - 200k:| Newgulf: | 2.2% (9) |
| State: | 7.3% (202,259) |
Number of families with income > $200k:| Newgulf: | 3.4% (15) |
| State: | 5.9% (165,129) |
Median non-family income in Newgulf in 2022:| Newgulf: | $20,088 |
| State: | $39,934 |
Change in median non-family income between 2000 and 2022:| Newgulf, Texas: | +120.8% |
| State: | +109.1% |
Median per capita income in Newgulf in 2022:| Newgulf: | $21,397 |
| State: | $24,862 |
Change in median per capita income between 2000 and 2022:| Newgulf, Texas: | +128.5% |
| Texas: | +130.8% |
Income statistics for Multirace residents
Median household income in Newgulf, TX in 2022:| Newgulf: | $51,604 |
| State: | $62,748 |
Change in median household income between 2000 and 2022:| Newgulf, Texas: | +97.9% |
| State: | +92.3% |
Number of households with income < $10k:| Newgulf: | 5.5% (48,819) |
| State: | 5.5% (122,324) |
Number of households with income $10k - 20k:| Newgulf: | 8.2% (72,729) |
| State: | 8.2% (182,232) |
Number of households with income $20k - 30k:| Newgulf: | 8.5% (75,533) |
| State: | 8.5% (189,456) |
Number of households with income $30k - 40k:| Newgulf: | 8.9% (78,800) |
| State: | 8.9% (197,499) |
Number of households with income $40k - 50k:| Newgulf: | 8.7% (76,541) |
| Texas: | 8.7% (191,735) |
Number of households with income $50k - 60k:| Newgulf: | 8.0% (70,794) |
| State: | 8.0% (177,535) |
Number of households with income $60k - 75k:| Newgulf: | 10.5% (92,791) |
| State: | 10.5% (232,479) |
Number of households with income $75k - 100k:| Newgulf: | 13.1% (115,890) |
| State: | 13.1% (290,448) |
Number of households with income $100k - 125k:| Newgulf: | 8.7% (76,481) |
| State: | 8.6% (191,595) |
Number of households with income $125k - 150k:| Newgulf: | 6.0% (53,271) |
| State: | 6.0% (133,361) |
Number of households with income $150k - 200k:| Newgulf: | 7.2% (63,449) |
| Texas: | 7.2% (159,195) |
Number of households with income > $200k:| Newgulf: | 6.7% (59,075) |
| State: | 6.7% (148,064) |
Aggregate household income in Newgulf in 2022: $52,411,053
Median family income in Newgulf in 2022:| Newgulf: | $51,358 |
| State: | $69,780 |
Number of families with income $10k - 20k:| Newgulf: | 13.2% (35) |
| State: | 5.9% (95,279) |
Number of families with income $20k - 30k:| Newgulf: | 36.3% (97) |
| State: | 7.8% (126,627) |
Number of families with income $30k - 40k:| Newgulf: | 20.6% (55) |
| State: | 8.5% (137,626) |
Number of families with income $50k - 60k:| Newgulf: | 30.0% (80) |
| Texas: | 7.9% (127,739) |
Median per capita income in Newgulf in 2022:| Newgulf: | $27,006 |
| Texas: | $26,785 |
Change in median per capita income between 2000 and 2022:| Newgulf, Texas: | +108.4% |
| State: | +110.9% |
Income statistics for other residents
Number of households with income < $10k:| Newgulf: | 5.9% (54) |
| Texas: | 5.9% (54,162) |
Number of households with income $10k - 20k:| Newgulf: | 6.8% (62) |
| State: | 6.8% (62,891) |
Number of households with income $20k - 30k:| Newgulf: | 10.6% (97) |
| Texas: | 10.6% (97,294) |
Number of households with income $30k - 40k:| Newgulf: | 10.8% (99) |
| State: | 10.8% (99,670) |
Number of households with income $40k - 50k:| Newgulf: | 9.3% (85) |
| State: | 9.3% (85,548) |
Number of households with income $50k - 60k:| Newgulf: | 9.0% (82) |
| State: | 9.0% (82,757) |
Number of households with income $60k - 75k:| Newgulf: | 11.0% (100) |
| Texas: | 10.9% (100,326) |
Number of households with income $75k - 100k:| Newgulf: | 14.0% (128) |
| State: | 14.0% (128,767) |
Number of households with income $100k - 125k:| Newgulf: | 8.2% (75) |
| State: | 8.2% (75,218) |
Number of households with income $125k - 150k:| Newgulf: | 4.8% (44) |
| Texas: | 4.8% (44,223) |
Number of households with income $150k - 200k:| Newgulf: | 5.6% (51) |
| State: | 5.6% (51,376) |
Number of households with income > $200k:| Newgulf: | 3.9% (36) |
| State: | 4.0% (36,393) |
Aggregate household income in Newgulf in 2022: $67,194,623
Median family income in Newgulf in 2022:| Newgulf: | $54,027 |
| State: | $60,064 |
Number of families with income $10k - 20k:| Newgulf: | 17.4% (14) |
| State: | 6.0% (41,763) |
Number of families with income $20k - 30k:| Newgulf: | 17.5% (14) |
| State: | 9.9% (68,761) |
Number of families with income $30k - 40k:| Newgulf: | 34.2% (28) |
| State: | 9.7% (67,685) |
Number of families with income $40k - 50k:| Newgulf: | 12.8% (11) |
| State: | 9.0% (62,441) |
Number of families with income $60k - 75k:| Newgulf: | 18.0% (15) |
| State: | 11.2% (77,588) |
Median non-family income in Newgulf in 2022:| Newgulf: | $20,216 |
| State: | $38,690 |
Change in median non-family income between 2000 and 2022:| Newgulf, Texas: | +123.9% |
| Texas: | +90.2% |
Median per capita income in Newgulf in 2022:| Newgulf: | $18,697 |
| State: | $23,899 |
Change in median per capita income between 2000 and 2022:| Newgulf, Texas: | +141.8% |
| State: | +135.2% |