Niagara, New York (NY) income map, earnings map, and wages data
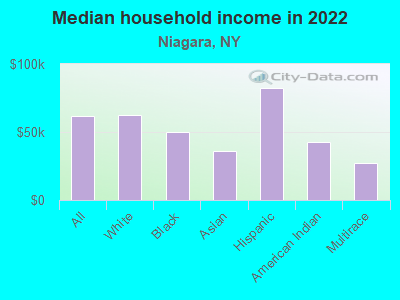
The median household income in Niagara, NY in 2022 was $62,095, which was 28.1% less than the median annual income of $79,557 across the entire state of New York. Compared to the median income of $37,327 in 2000 this represents an increase of 39.9%. The per capita income in 2022 was $34,308, which means an increase of 49.0% compared to 2000 when it was $17,500.
Income statistics for all residents
Median household income in Niagara, NY in 2022:| Niagara: | $62,095 |
| New York: | $79,557 |
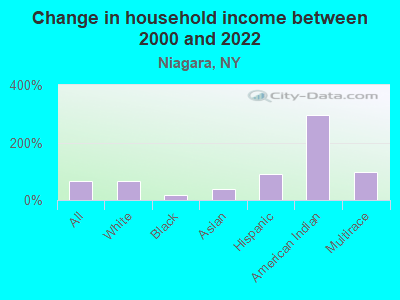
Change in median household income between 2000 and 2022:| Niagara, New York: | +66.4% |
| New York: | +83.3% |
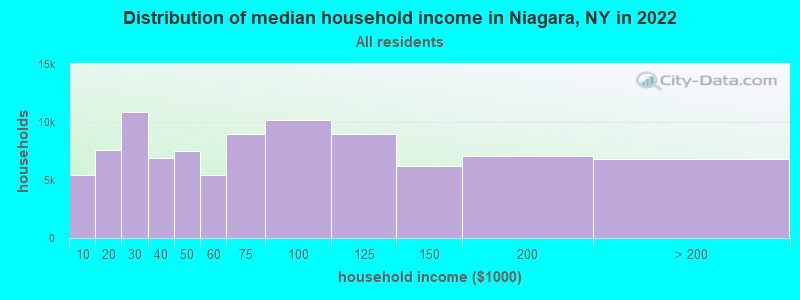
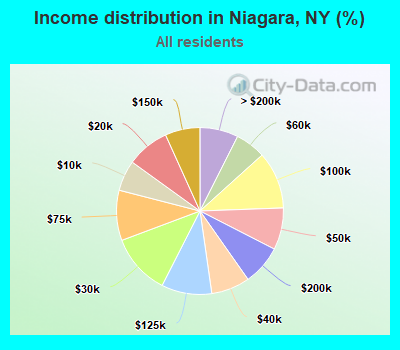
Number of households with income < $10k:| Niagara: | 5.9% (5,467) |
| New York: | 6.8% (527,598) |
Number of households with income $10k - 20k:| Niagara: | 8.3% (7,625) |
| New York: | 7.4% (574,940) |
Number of households with income $20k - 30k:| Niagara: | 11.8% (10,854) |
| State: | 6.7% (517,718) |
Number of households with income $30k - 40k:| Niagara: | 7.5% (6,872) |
| State: | 6.5% (506,674) |
Number of households with income $40k - 50k:| Niagara: | 8.1% (7,470) |
| State: | 6.1% (470,439) |
Number of households with income $50k - 60k:| Niagara: | 5.9% (5,423) |
| State: | 5.8% (454,042) |
Number of households with income $60k - 75k:| Niagara: | 9.7% (8,944) |
| State: | 8.5% (657,508) |
Number of households with income $75k - 100k:| Niagara: | 11.1% (10,205) |
| State: | 11.6% (899,824) |
Number of households with income $100k - 125k:| Niagara: | 9.8% (8,981) |
| State: | 9.3% (723,825) |
Number of households with income $125k - 150k:| Niagara: | 6.8% (6,216) |
| State: | 7.1% (552,420) |
Number of households with income $150k - 200k:| Niagara: | 7.7% (7,101) |
| New York: | 9.4% (727,051) |
Number of households with income > $200k:| Niagara: | 7.4% (6,850) |
| State: | 15.0% (1,162,269) |
Aggregate household income in Niagara in 2022: $582,397,470
Median family income in Niagara in 2022:| Niagara: | $76,655 |
| State: | $99,066 |
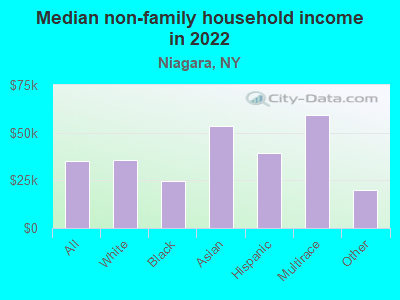
Median non-family income in Niagara in 2022:| Niagara: | $35,329 |
| State: | $50,181 |
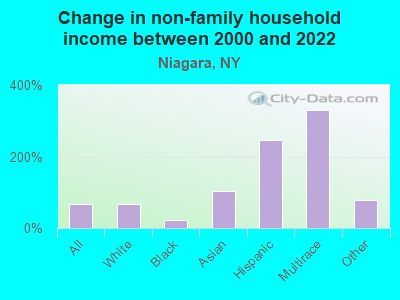
Change in median non-family income between 2000 and 2022:| Niagara, New York: | +68.2% |
| State: | +85.4% |
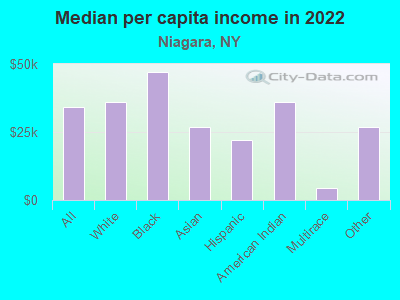
Median per capita income in Niagara in 2022:| Niagara: | $34,309 |
| New York: | $47,421 |
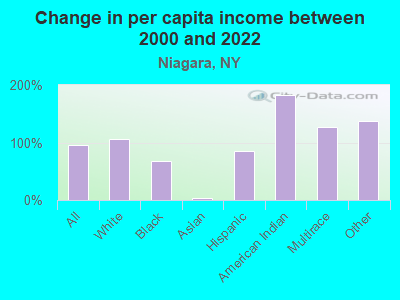
Change in median per capita income between 2000 and 2022:| Niagara, New York: | +96.1% |
| State: | +102.7% |
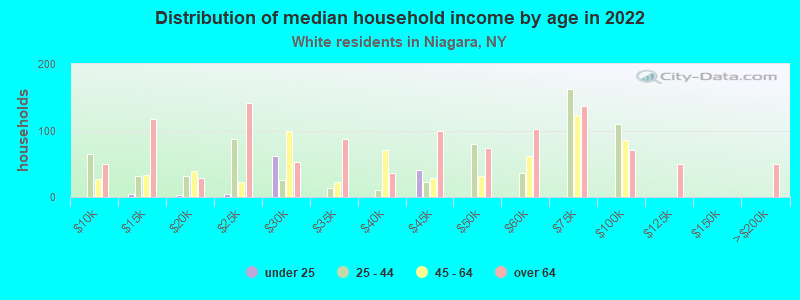
Income statistics for White residents
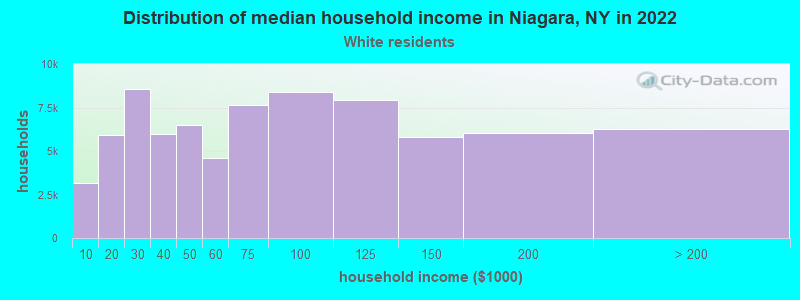
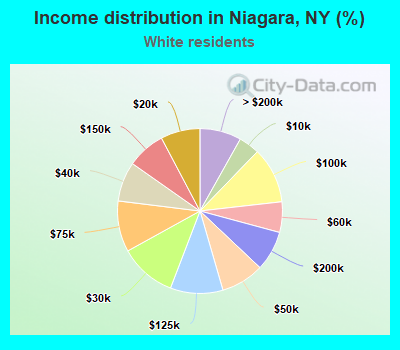
Median household income in Niagara, NY in 2022:| Niagara: | $62,154 |
| State: | $89,408 |
Change in median household income between 2000 and 2022:| Niagara, New York: | +65.9% |
| State: | +85.5% |
Number of households with income < $10k:| Niagara: | 4.1% (3,137) |
| State: | 4.8% (225,550) |
Number of households with income $10k - 20k:| Niagara: | 7.7% (5,918) |
| State: | 6.1% (289,425) |
Number of households with income $20k - 30k:| Niagara: | 11.1% (8,535) |
| New York: | 5.9% (280,254) |
Number of households with income $30k - 40k:| Niagara: | 7.8% (5,968) |
| State: | 6.1% (288,263) |
Number of households with income $40k - 50k:| Niagara: | 8.5% (6,488) |
| State: | 5.9% (278,079) |
Number of households with income $50k - 60k:| Niagara: | 6.0% (4,587) |
| State: | 5.7% (267,554) |
Number of households with income $60k - 75k:| Niagara: | 10.0% (7,659) |
| State: | 8.4% (398,344) |
Number of households with income $75k - 100k:| Niagara: | 11.0% (8,419) |
| State: | 11.8% (554,841) |
Number of households with income $100k - 125k:| Niagara: | 10.3% (7,914) |
| State: | 10.0% (469,794) |
Number of households with income $125k - 150k:| Niagara: | 7.5% (5,776) |
| State: | 7.6% (360,467) |
Number of households with income $150k - 200k:| Niagara: | 7.8% (6,017) |
| New York: | 10.1% (477,078) |
Number of households with income > $200k:| Niagara: | 8.1% (6,241) |
| New York: | 17.6% (829,233) |
Aggregate household income in Niagara in 2022: $488,923,514
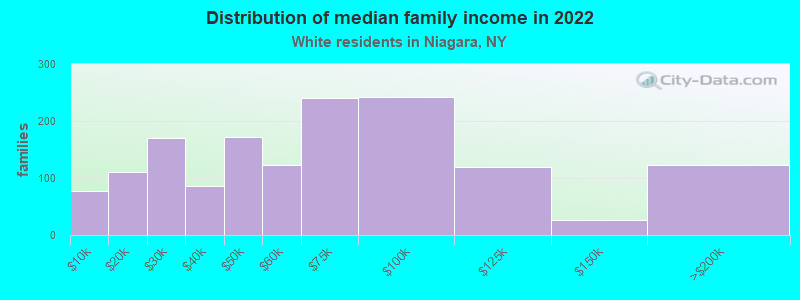
Median family income in Niagara in 2022:| Niagara: | $79,107 |
| New York: | $115,170 |
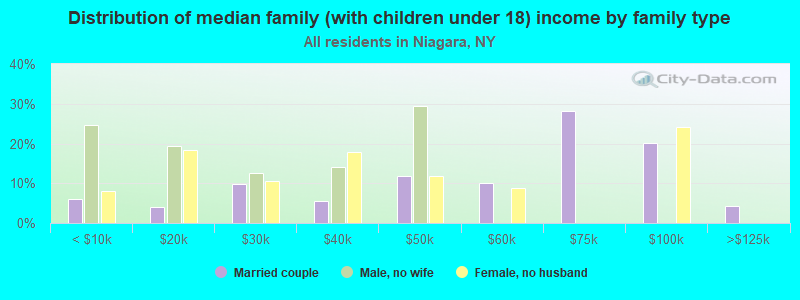
Number of families with income < $10k:| Niagara: | 5.2% (77) |
| State: | 2.5% (68,851) |
Number of families with income $10k - 20k:| Niagara: | 7.5% (111) |
| New York: | 3.0% (83,127) |
Number of families with income $20k - 30k:| Niagara: | 11.5% (171) |
| State: | 3.5% (97,578) |
Number of families with income $30k - 40k:| Niagara: | 5.8% (86) |
| State: | 4.1% (114,108) |
Number of families with income $40k - 50k:| Niagara: | 11.6% (172) |
| New York: | 4.7% (130,902) |
Number of families with income $50k - 60k:| Niagara: | 8.2% (122) |
| State: | 4.9% (135,118) |
Number of families with income $60k - 75k:| Niagara: | 16.1% (240) |
| State: | 7.8% (216,254) |
Number of families with income $75k - 100k:| Niagara: | 16.3% (242) |
| New York: | 12.4% (342,382) |
Number of families with income $100k - 125k:| Niagara: | 8.0% (119) |
| State: | 11.4% (314,917) |
Number of families with income $125k - 150k:| Niagara: | 1.8% (27) |
| State: | 9.4% (260,489) |
Number of families with income $150k - 200k:| Niagara: | 8.2% (122) |
| New York: | 13.2% (365,586) |
Median non-family income in Niagara in 2022:| Niagara: | $35,783 |
| State: | $54,783 |
Change in median non-family income between 2000 and 2022:| Niagara, New York: | +68.4% |
| New York: | +87.9% |
Median per capita income in Niagara in 2022:| Niagara: | $35,989 |
| State: | $57,640 |
Change in median per capita income between 2000 and 2022:| Niagara, New York: | +106.1% |
| State: | +111.6% |
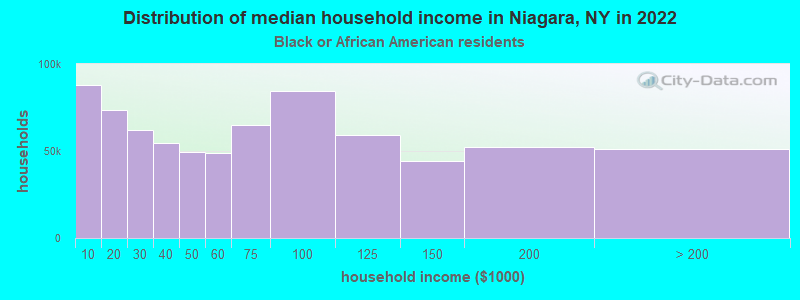
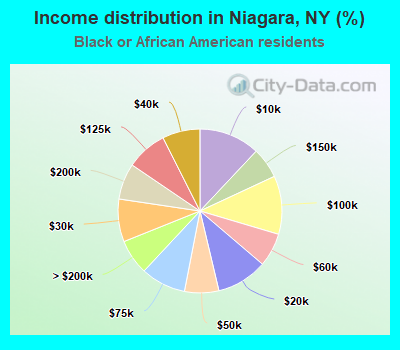
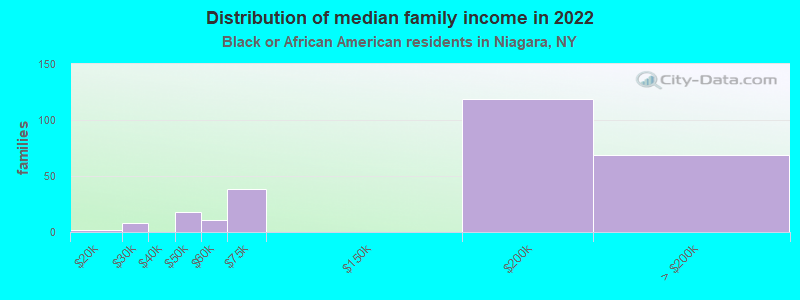
Income statistics for Black or African American residents
Median household income in Niagara, NY in 2022:| Niagara: | $50,146 |
| State: | $57,898 |
Change in median household income between 2000 and 2022:| Niagara, New York: | +16.7% |
| State: | +84.6% |
Number of households with income < $10k:| Niagara: | 12.0% (88,107) |
| State: | 12.0% (128,500) |
Number of households with income $10k - 20k:| Niagara: | 10.0% (73,663) |
| State: | 10.0% (107,541) |
Number of households with income $20k - 30k:| Niagara: | 8.4% (61,823) |
| New York: | 8.4% (90,192) |
Number of households with income $30k - 40k:| Niagara: | 7.4% (54,487) |
| State: | 7.4% (79,579) |
Number of households with income $40k - 50k:| Niagara: | 6.8% (49,682) |
| New York: | 6.8% (72,491) |
Number of households with income $50k - 60k:| Niagara: | 6.6% (48,727) |
| State: | 6.7% (71,309) |
Number of households with income $60k - 75k:| Niagara: | 8.9% (65,144) |
| State: | 8.9% (95,050) |
Number of households with income $75k - 100k:| Niagara: | 11.5% (84,523) |
| New York: | 11.5% (123,569) |
Number of households with income $100k - 125k:| Niagara: | 8.1% (59,171) |
| State: | 8.1% (86,632) |
Number of households with income $125k - 150k:| Niagara: | 6.1% (44,393) |
| New York: | 6.0% (64,788) |
Number of households with income $150k - 200k:| Niagara: | 7.1% (52,383) |
| State: | 7.2% (76,644) |
Number of households with income > $200k:| Niagara: | 7.0% (51,154) |
| State: | 7.0% (75,062) |
Aggregate household income in Niagara in 2022: $16,827,704
Median family income in Niagara in 2022:| Niagara: | $79,636 |
| State: | $72,528 |
Number of families with income $10k - 20k:| Niagara: | 0.6% (2) |
| State: | 6.6% (41,506) |
Number of families with income $20k - 30k:| Niagara: | 3.2% (8) |
| New York: | 7.0% (44,139) |
Number of families with income $40k - 50k:| Niagara: | 6.9% (18) |
| State: | 6.6% (41,419) |
Number of families with income $50k - 60k:| Niagara: | 4.3% (11) |
| State: | 6.3% (39,748) |
Number of families with income $60k - 75k:| Niagara: | 14.3% (38) |
| State: | 9.2% (57,626) |
Number of families with income $150k - 200k:| Niagara: | 44.7% (119) |
| State: | 9.4% (59,260) |
Number of families with income > $200k:| Niagara: | 26.0% (69) |
| State: | 9.3% (58,575) |
Median non-family income in Niagara in 2022:| Niagara: | $24,623 |
| State: | $37,265 |
Change in median non-family income between 2000 and 2022:| Niagara, New York: | +22.2% |
| New York: | +81.7% |
Median per capita income in Niagara in 2022:| Niagara: | $47,080 |
| State: | $31,947 |
Change in median per capita income between 2000 and 2022:| Niagara, New York: | +67.8% |
| New York: | +106.1% |
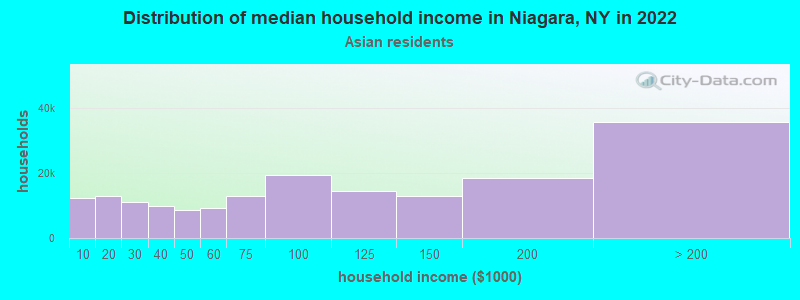
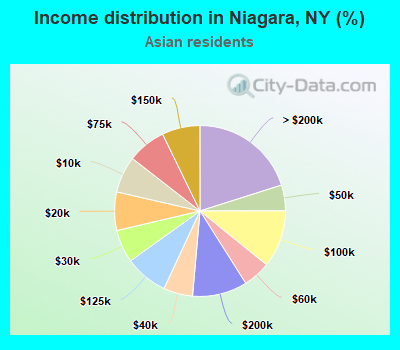
Income statistics for Asian residents
Median household income in Niagara, NY in 2022:| Niagara: | $35,999 |
| State: | $89,947 |
Change in median household income between 2000 and 2022:| Niagara, New York: | +37.1% |
| New York: | +98.1% |
Number of households with income < $10k:| Niagara: | 6.9% (12,295) |
| State: | 6.9% (42,537) |
Number of households with income $10k - 20k:| Niagara: | 7.3% (12,936) |
| New York: | 7.3% (44,745) |
Number of households with income $20k - 30k:| Niagara: | 6.2% (11,077) |
| New York: | 6.2% (38,249) |
Number of households with income $30k - 40k:| Niagara: | 5.5% (9,826) |
| State: | 5.5% (33,993) |
Number of households with income $40k - 50k:| Niagara: | 4.9% (8,625) |
| New York: | 4.8% (29,795) |
Number of households with income $50k - 60k:| Niagara: | 5.2% (9,225) |
| New York: | 5.2% (32,100) |
Number of households with income $60k - 75k:| Niagara: | 7.3% (12,889) |
| New York: | 7.3% (44,615) |
Number of households with income $75k - 100k:| Niagara: | 10.9% (19,273) |
| State: | 10.8% (66,687) |
Number of households with income $100k - 125k:| Niagara: | 8.2% (14,480) |
| State: | 8.2% (50,233) |
Number of households with income $125k - 150k:| Niagara: | 7.2% (12,795) |
| State: | 7.2% (44,299) |
Number of households with income $150k - 200k:| Niagara: | 10.4% (18,408) |
| New York: | 10.4% (63,837) |
Number of households with income > $200k:| Niagara: | 20.1% (35,724) |
| State: | 20.1% (123,891) |
Aggregate household income in Niagara in 2022: $625,107
Median non-family income in Niagara in 2022:| Niagara: | $53,627 |
| New York: | $63,573 |
Change in median non-family income between 2000 and 2022:| Niagara, New York: | +104.3% |
| New York: | +101.1% |
Median per capita income in Niagara in 2022:| Niagara: | $26,735 |
| New York: | $46,726 |
Change in median per capita income between 2000 and 2022:| Niagara, New York: | +2.8% |
| New York: | +126.6% |
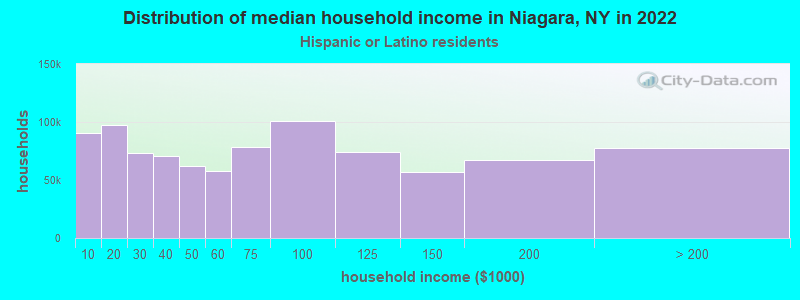
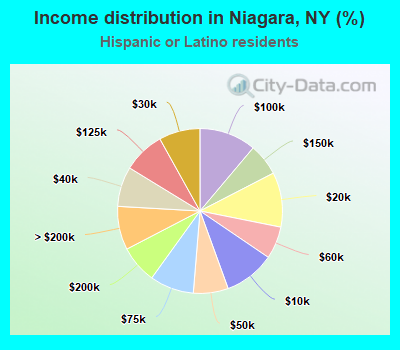
Income statistics for Hispanic or Latino residents
Median household income in Niagara, NY in 2022:| Niagara: | $82,512 |
| State: | $60,468 |
Change in median household income between 2000 and 2022:| Niagara, New York: | +90.4% |
| State: | +98.3% |
Number of households with income < $10k:| Niagara: | 10.0% (90,293) |
| State: | 9.9% (127,185) |
Number of households with income $10k - 20k:| Niagara: | 10.7% (97,197) |
| State: | 10.7% (136,699) |
Number of households with income $20k - 30k:| Niagara: | 8.1% (73,190) |
| State: | 8.1% (102,991) |
Number of households with income $30k - 40k:| Niagara: | 7.8% (70,892) |
| New York: | 7.8% (100,149) |
Number of households with income $40k - 50k:| Niagara: | 6.8% (62,025) |
| State: | 6.9% (87,760) |
Number of households with income $50k - 60k:| Niagara: | 6.3% (57,437) |
| State: | 6.3% (80,968) |
Number of households with income $60k - 75k:| Niagara: | 8.6% (78,287) |
| State: | 8.7% (110,631) |
Number of households with income $75k - 100k:| Niagara: | 11.2% (101,052) |
| State: | 11.2% (142,787) |
Number of households with income $100k - 125k:| Niagara: | 8.2% (74,049) |
| State: | 8.2% (104,850) |
Number of households with income $125k - 150k:| Niagara: | 6.3% (56,815) |
| State: | 6.3% (80,274) |
Number of households with income $150k - 200k:| Niagara: | 7.4% (67,165) |
| State: | 7.4% (95,117) |
Number of households with income > $200k:| Niagara: | 8.6% (77,460) |
| State: | 8.6% (109,514) |
Aggregate household income in Niagara in 2022: $5,417,731
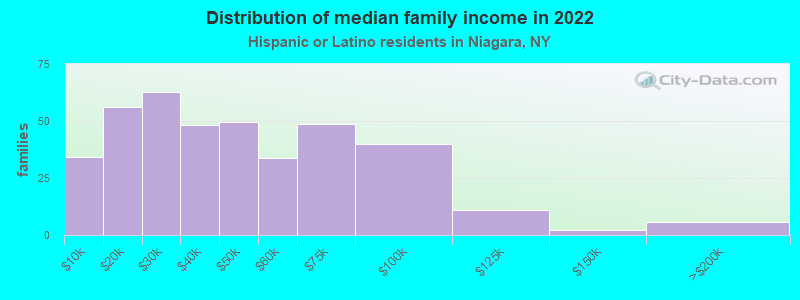
Median family income in Niagara in 2022:| Niagara: | $94,987 |
| State: | $68,770 |
Number of families with income < $10k:| Niagara: | 8.7% (34) |
| State: | 6.9% (58,565) |
Number of families with income $10k - 20k:| Niagara: | 14.3% (56) |
| State: | 7.0% (59,058) |
Number of families with income $20k - 30k:| Niagara: | 16.0% (63) |
| State: | 8.0% (68,048) |
Number of families with income $30k - 40k:| Niagara: | 12.3% (48) |
| New York: | 8.4% (70,668) |
Number of families with income $40k - 50k:| Niagara: | 12.6% (50) |
| State: | 7.4% (62,941) |
Number of families with income $50k - 60k:| Niagara: | 8.7% (34) |
| State: | 6.6% (55,592) |
Number of families with income $60k - 75k:| Niagara: | 12.4% (49) |
| State: | 9.3% (78,564) |
Number of families with income $75k - 100k:| Niagara: | 10.2% (40) |
| New York: | 12.6% (106,685) |
Number of families with income $100k - 125k:| Niagara: | 2.9% (11) |
| State: | 9.4% (79,139) |
Number of families with income $125k - 150k:| Niagara: | 0.6% (2) |
| State: | 6.9% (58,255) |
Number of families with income $150k - 200k:| Niagara: | 1.4% (5) |
| State: | 8.3% (69,877) |
Median non-family income in Niagara in 2022:| Niagara: | $39,092 |
| State: | $34,000 |
Median per capita income in Niagara in 2022:| Niagara: | $22,036 |
| State: | $29,761 |
Change in median per capita income between 2000 and 2022:| Niagara, New York: | +86.3% |
| State: | +132.7% |
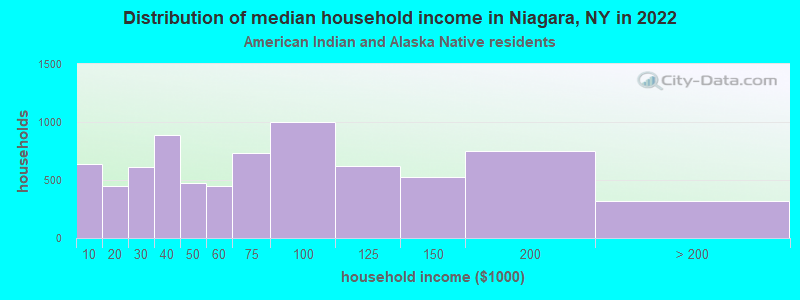
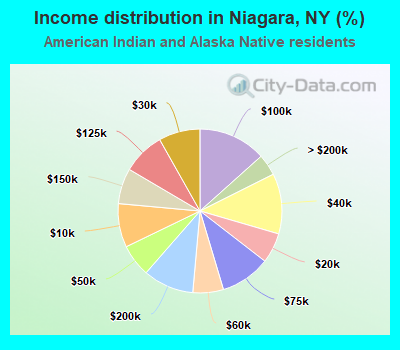
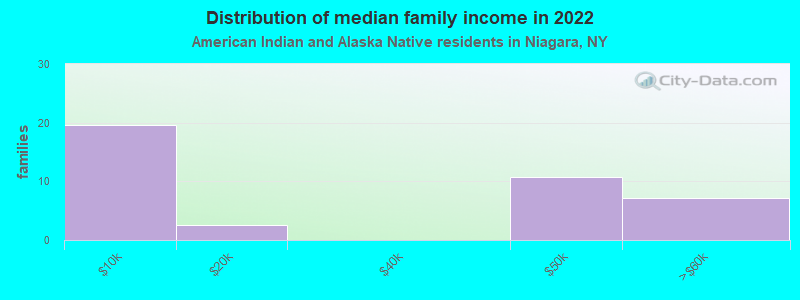
Income statistics for American Indian and Alaska Native residents
Median household income in Niagara, NY in 2022:| Niagara: | $42,412 |
| State: | $63,208 |
Number of households with income < $10k:| Niagara: | 8.6% (642) |
| State: | 8.6% (3,559) |
Number of households with income $10k - 20k:| Niagara: | 6.0% (445) |
| New York: | 5.9% (2,455) |
Number of households with income $20k - 30k:| Niagara: | 8.2% (609) |
| New York: | 8.2% (3,393) |
Number of households with income $30k - 40k:| Niagara: | 11.9% (887) |
| State: | 11.9% (4,918) |
Number of households with income $40k - 50k:| Niagara: | 6.4% (477) |
| New York: | 6.5% (2,682) |
Number of households with income $50k - 60k:| Niagara: | 6.0% (449) |
| State: | 6.1% (2,516) |
Number of households with income $60k - 75k:| Niagara: | 9.9% (737) |
| State: | 10.0% (4,125) |
Number of households with income $75k - 100k:| Niagara: | 13.4% (997) |
| State: | 13.3% (5,517) |
Number of households with income $100k - 125k:| Niagara: | 8.4% (622) |
| State: | 8.4% (3,463) |
Number of households with income $125k - 150k:| Niagara: | 7.0% (523) |
| New York: | 7.0% (2,887) |
Number of households with income $150k - 200k:| Niagara: | 10.0% (746) |
| State: | 9.9% (4,106) |
Number of households with income > $200k:| Niagara: | 4.2% (315) |
| State: | 4.2% (1,744) |
Aggregate household income in Niagara in 2022: $3,158,376
Median family income in Niagara in 2022:| Niagara: | $39,232 |
| State: | $69,721 |
Number of families with income < $10k:| Niagara: | 48.9% (20) |
| State: | 8.3% (2,415) |
Number of families with income $10k - 20k:| Niagara: | 6.3% (3) |
| New York: | 2.6% (761) |
Number of families with income $40k - 50k:| Niagara: | 27.0% (11) |
| State: | 8.7% (2,524) |
Number of families with income $50k - 60k:| Niagara: | 17.8% (7) |
| State: | 3.4% (985) |
Median per capita income in Niagara in 2022:| Niagara: | $36,166 |
| New York: | $25,837 |
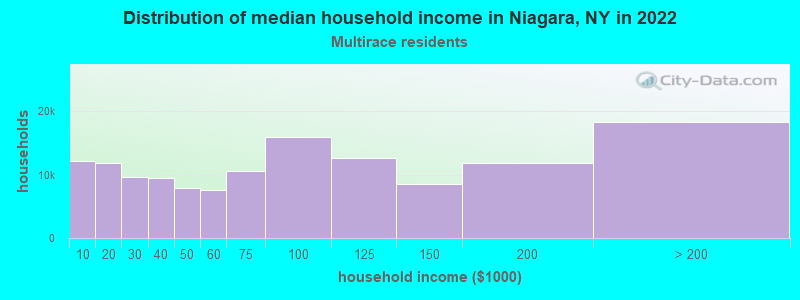
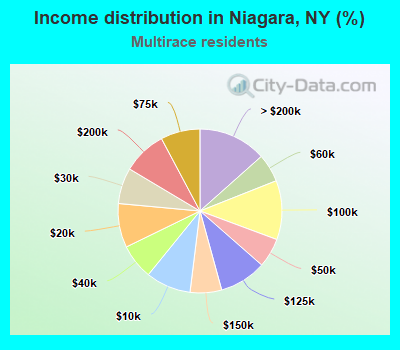
Income statistics for Multirace residents
Median household income in Niagara, NY in 2022:| Niagara: | $27,003 |
| State: | $73,557 |
Change in median household income between 2000 and 2022:| Niagara, New York: | +96.4% |
| New York: | +123.9% |
Number of households with income < $10k:| Niagara: | 8.9% (12,137) |
| State: | 8.9% (57,924) |
Number of households with income $10k - 20k:| Niagara: | 8.7% (11,837) |
| State: | 8.7% (56,590) |
Number of households with income $20k - 30k:| Niagara: | 7.1% (9,676) |
| New York: | 7.1% (46,287) |
Number of households with income $30k - 40k:| Niagara: | 6.9% (9,425) |
| State: | 6.9% (45,132) |
Number of households with income $40k - 50k:| Niagara: | 5.8% (7,909) |
| New York: | 5.8% (37,946) |
Number of households with income $50k - 60k:| Niagara: | 5.6% (7,598) |
| State: | 5.6% (36,410) |
Number of households with income $60k - 75k:| Niagara: | 7.8% (10,599) |
| State: | 7.8% (50,819) |
Number of households with income $75k - 100k:| Niagara: | 11.7% (15,882) |
| State: | 11.7% (76,024) |
Number of households with income $100k - 125k:| Niagara: | 9.3% (12,639) |
| State: | 9.3% (60,635) |
Number of households with income $125k - 150k:| Niagara: | 6.2% (8,468) |
| State: | 6.2% (40,533) |
Number of households with income $150k - 200k:| Niagara: | 8.6% (11,780) |
| State: | 8.6% (56,409) |
Number of households with income > $200k:| Niagara: | 13.4% (18,288) |
| New York: | 13.4% (87,442) |
Aggregate household income in Niagara in 2022: $1,554,565
Median non-family income in Niagara in 2022:| Niagara: | $59,259 |
| New York: | $46,403 |
Median per capita income in Niagara in 2022:| Niagara: | $4,579 |
| State: | $36,931 |
Change in median per capita income between 2000 and 2022:| Niagara, New York: | +127.1% |
| State: | +158.8% |
Income statistics for other residents
Number of households with income < $10k:| Niagara: | 10.0% (7) |
| New York: | 10.3% (69,252) |
Number of households with income $10k - 20k:| Niagara: | 11.4% (8) |
| New York: | 11.0% (73,890) |
Number of households with income $20k - 30k:| Niagara: | 8.6% (6) |
| New York: | 8.8% (59,096) |
Number of households with income $30k - 40k:| Niagara: | 7.1% (5) |
| State: | 8.1% (54,418) |
Number of households with income $40k - 50k:| Niagara: | 7.1% (5) |
| New York: | 7.3% (49,042) |
Number of households with income $50k - 60k:| Niagara: | 5.7% (4) |
| New York: | 6.5% (43,945) |
Number of households with income $60k - 75k:| Niagara: | 8.6% (6) |
| State: | 9.5% (64,087) |
Number of households with income $75k - 100k:| Niagara: | 11.4% (8) |
| State: | 10.9% (73,094) |
Number of households with income $100k - 125k:| Niagara: | 8.6% (6) |
| State: | 7.9% (53,055) |
Number of households with income $125k - 150k:| Niagara: | 5.7% (4) |
| New York: | 5.9% (39,446) |
Number of households with income $150k - 200k:| Niagara: | 8.6% (6) |
| State: | 7.2% (48,653) |
Number of households with income > $200k:| Niagara: | 7.1% (5) |
| State: | 6.6% (44,703) |
Aggregate household income in Niagara in 2022: $3,880,580
Median family income in Niagara in 2022:| Niagara: | $53,803 |
| State: | $63,465 |
Number of families with income $40k - 50k:| Niagara: | 100.0% (15) |
| State: | 7.8% (36,771) |
Median non-family income in Niagara in 2022:| Niagara: | $19,944 |
| State: | $26,983 |
Change in median non-family income between 2000 and 2022:| Niagara, New York: | +77.3% |
| State: | +66.4% |
Median per capita income in Niagara in 2022:| Niagara: | $26,782 |
| State: | $26,975 |
Change in median per capita income between 2000 and 2022:| Niagara, New York: | +137.7% |
| State: | +144.6% |