The median household income in Niantic, CT in 2022 was $80,768, which was 9.5% less than the median annual income of $88,429 across the entire state of Connecticut. Compared to the median income of $54,872 in 2000 this represents an increase of 32.1%. The per capita income in 2022 was $48,763, which means an increase of 44.0% compared to 2000 when it was $27,306.
Whole page based on the data from 2000 / 2022 when the population of Niantic, Connecticut was 3,085 / 3,511
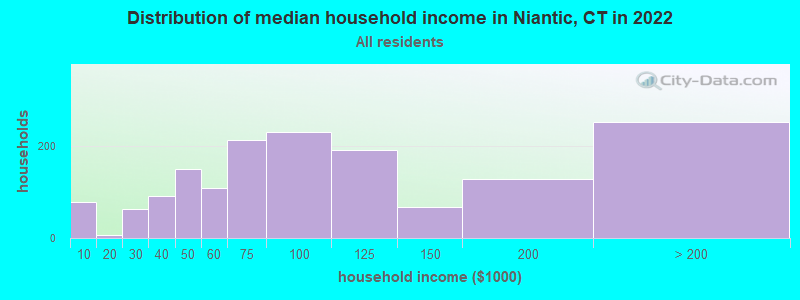
Income statistics for all residents
Median household income in Niantic, CT in 2022:
Niantic:
$80,769
Connecticut:
$88,429
Change in median household income between 2000 and 2022:
Niantic, Connecticut:
+47.2%
State:
+64.0%
Number of households with income < $10k:
Niantic:
4.9% (77)
State:
5.1% (72,746)
Number of households with income $10k - 20k:
Niantic:
0.4% (7)
State:
5.7% (81,643)
Number of households with income $20k - 30k:
Niantic:
4.0% (62)
State:
6.5% (92,844)
Number of households with income $30k - 40k:
Niantic:
5.7% (90)
State:
5.9% (83,934)
Number of households with income $40k - 50k:
Niantic:
9.5% (149)
State:
5.8% (83,025)
Number of households with income $50k - 60k:
Niantic:
6.9% (109)
State:
5.7% (81,788)
Number of households with income $60k - 75k:
Niantic:
13.4% (211)
Connecticut:
8.1% (115,651)
Number of households with income $75k - 100k:
Niantic:
14.6% (229)
State:
12.6% (180,173)
Number of households with income $100k - 125k:
Niantic:
12.2% (191)
State:
9.9% (141,231)
Number of households with income $125k - 150k:
Niantic:
4.2% (66)
State:
7.9% (112,826)
Number of households with income $150k - 200k:
Niantic:
8.1% (127)
State:
10.8% (154,641)
Number of households with income > $200k:
Niantic:
16.0% (251)
State:
16.3% (233,133)
Aggregate household income in Niantic in 2022: $170,284,276
Median family income in Niantic in 2022:
Niantic:
$108,501
Connecticut:
$115,183
Number of families with income < $10k:
Niantic:
1.7% (15)
State:
2.6% (23,251)
Number of families with income $10k - 20k:
Niantic:
0.6% (6)
State:
2.8% (25,184)
Number of families with income $30k - 40k:
Niantic:
2.9% (26)
State:
4.2% (38,052)
Number of families with income $40k - 50k:
Niantic:
14.0% (124)
Connecticut:
4.8% (43,104)
Number of families with income $50k - 60k:
Niantic:
5.8% (51)
Connecticut:
4.8% (43,284)
Number of families with income $60k - 75k:
Niantic:
6.5% (57)
State:
7.4% (66,521)
Number of families with income $75k - 100k:
Niantic:
13.8% (122)
State:
12.9% (116,232)
Number of families with income $100k - 125k:
Niantic:
15.2% (134)
Connecticut:
10.6% (95,504)
Number of families with income $125k - 150k:
Niantic:
3.1% (28)
Connecticut:
9.5% (86,149)
Number of families with income $150k - 200k:
Niantic:
10.0% (88)
Connecticut:
14.0% (125,908)
Number of families with income > $200k:
Niantic:
26.3% (232)
State:
22.4% (202,515)
Median non-family income in Niantic in 2022:
Niantic:
$66,112
State:
$50,964
Change in median non-family income between 2000 and 2022:
Niantic, Connecticut:
+104.2%
Connecticut:
+65.1%
Median per capita income in Niantic in 2022:
Niantic:
$48,764
State:
$51,581
Change in median per capita income between 2000 and 2022:
Niantic, Connecticut:
+78.6%
Connecticut:
+79.3%
Income statistics for White residents
Median household income in Niantic, CT in 2022:
Niantic:
$80,360
State:
$96,890
Change in median household income between 2000 and 2022:
Niantic, Connecticut:
+46.9%
Connecticut:
+68.5%
Number of households with income < $10k:
Niantic:
5.1% (75)
Connecticut:
4.2% (42,265)
Number of households with income $10k - 20k:
Niantic:
0.5% (7)
State:
4.8% (48,323)
Number of households with income $20k - 30k:
Niantic:
3.9% (57)
Connecticut:
5.7% (57,716)
Number of households with income $30k - 40k:
Niantic:
5.8% (86)
State:
5.3% (53,827)
Number of households with income $40k - 50k:
Niantic:
9.9% (146)
State:
5.3% (53,301)
Number of households with income $50k - 60k:
Niantic:
7.1% (105)
State:
5.5% (55,690)
Number of households with income $60k - 75k:
Niantic:
13.5% (200)
Connecticut:
8.0% (80,329)
Number of households with income $75k - 100k:
Niantic:
14.1% (209)
State:
12.7% (128,070)
Number of households with income $100k - 125k:
Niantic:
12.0% (178)
State:
10.0% (101,210)
Number of households with income $125k - 150k:
Niantic:
3.5% (52)
Connecticut:
8.0% (81,250)
Number of households with income $150k - 200k:
Niantic:
8.3% (122)
State:
11.8% (119,527)
Number of households with income > $200k:
Niantic:
16.3% (241)
Connecticut:
18.6% (187,875)
Aggregate household income in Niantic in 2022: $159,070,653
Median family income in Niantic in 2022:
Niantic:
$110,097
State:
$128,955
Number of families with income < $10k:
Niantic:
1.8% (15)
State:
1.9% (11,537)
Number of families with income $10k - 20k:
Niantic:
0.8% (6)
State:
1.8% (11,289)
Number of families with income $30k - 40k:
Niantic:
2.7% (22)
State:
2.9% (18,160)
Number of families with income $40k - 50k:
Niantic:
14.7% (121)
State:
3.9% (24,550)
Number of families with income $50k - 60k:
Niantic:
5.8% (48)
Connecticut:
4.3% (26,723)
Number of families with income $60k - 75k:
Niantic:
6.7% (55)
Connecticut:
7.1% (44,075)
Number of families with income $75k - 100k:
Niantic:
12.8% (105)
State:
12.5% (77,679)
Number of families with income $100k - 125k:
Niantic:
15.4% (127)
Connecticut:
11.1% (69,086)
Number of families with income $125k - 150k:
Niantic:
2.0% (16)
Connecticut:
9.6% (59,616)
Number of families with income $150k - 200k:
Niantic:
10.4% (85)
State:
15.7% (97,890)
Number of families with income > $200k:
Niantic:
27.0% (222)
State:
26.3% (163,417)
Median non-family income in Niantic in 2022:
Niantic:
$64,508
State:
$54,067
Change in median non-family income between 2000 and 2022:
Niantic, Connecticut:
+99.4%
State:
+68.7%
Median per capita income in Niantic in 2022:
Niantic:
$50,960
Connecticut:
$59,916
Change in median per capita income between 2000 and 2022:
Niantic, Connecticut:
+83.9%
Connecticut:
+90.2%
Income statistics for Black or African American residents
Median per capita income in Niantic in 2022:
Niantic:
$15,357
State:
$36,289
Change in median per capita income between 2000 and 2022:
Niantic, Connecticut:
+104.8%
State:
+117.5%
Income statistics for Asian residents
Median per capita income in Niantic in 2022:
Niantic:
$68,340
Connecticut:
$55,295
Change in median per capita income between 2000 and 2022:
Niantic, Connecticut:
+103.6%
Connecticut:
+97.8%
Income statistics for Hispanic or Latino residents
Median per capita income in Niantic in 2022:
Niantic:
$38,072
State:
$28,507
Income statistics for Multirace residents
Number of households with income < $10k:
Niantic:
0.0% (0)
State:
6.0% (7,457)
Number of households with income $10k - 20k:
Niantic:
0.0% (0)
State:
8.1% (10,139)
Number of households with income $20k - 30k:
Niantic:
0.0% (0)
Connecticut:
7.0% (8,702)
Number of households with income $30k - 40k:
Niantic:
0.0% (0)
State:
6.9% (8,546)
Number of households with income $40k - 50k:
Niantic:
0.0% (0)
State:
7.0% (8,712)
Number of households with income $50k - 60k:
Niantic:
0.0% (0)
State:
5.9% (7,331)
Number of households with income $60k - 75k:
Niantic:
0.0% (0)
Connecticut:
8.5% (10,634)
Number of households with income $75k - 100k:
Niantic:
42.9% (12)
Connecticut:
14.1% (17,600)
Number of households with income $100k - 125k:
Niantic:
0.0% (0)
State:
9.9% (12,383)
Number of households with income $125k - 150k:
Niantic:
57.1% (16)
Connecticut:
7.2% (8,921)
Number of households with income $150k - 200k:
Niantic:
0.0% (0)
State:
8.8% (10,922)
Number of households with income > $200k:
Niantic:
0.0% (0)
Connecticut:
10.6% (13,247)
Aggregate household income in Niantic in 2022: $24,708,608
Median per capita income in Niantic in 2022:
Niantic:
$12,767
State:
$32,794
Change in median per capita income between 2000 and 2022:
Niantic, Connecticut:
+30.8%
State:
+117.2%
Discuss Niantic, Connecticut (CT) on our hugely popular Connecticut forum.