The median household income in Niverville, NY in 2022 was $94,435, which was 15.8% greater than the median annual income of $79,557 across the entire state of New York. Compared to the median income of $46,290 in 2000 this represents an increase of 51.0%. The per capita income in 2022 was $66,477, which means an increase of 65.2% compared to 2000 when it was $23,109.
Whole page based on the data from 2000 / 2022 when the population of Niverville, New York was 1,737 / 1,440
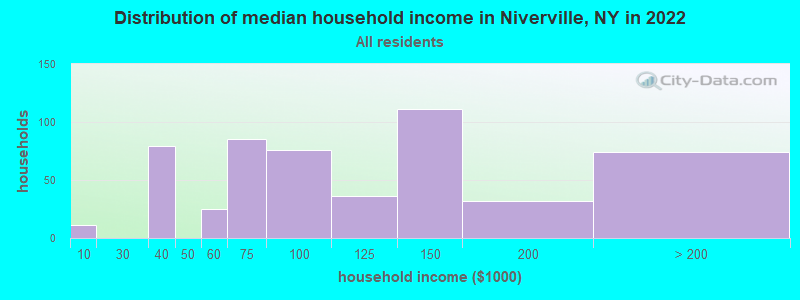
Income statistics for all residents
Median household income in Niverville, NY in 2022:
Niverville:
$94,436
New York:
$79,557
Change in median household income between 2000 and 2022:
Niverville, New York:
+104.0%
State:
+83.3%
Number of households with income < $10k:
Niverville:
2.1% (11)
New York:
6.8% (527,598)
Number of households with income $10k - 20k:
Niverville:
0.0% (0)
State:
7.4% (574,940)
Number of households with income $20k - 30k:
Niverville:
0.0% (0)
State:
6.7% (517,718)
Number of households with income $30k - 40k:
Niverville:
14.9% (79)
State:
6.5% (506,674)
Number of households with income $40k - 50k:
Niverville:
0.0% (0)
State:
6.1% (470,439)
Number of households with income $50k - 60k:
Niverville:
4.7% (25)
State:
5.8% (454,042)
Number of households with income $60k - 75k:
Niverville:
16.1% (85)
State:
8.5% (657,508)
Number of households with income $75k - 100k:
Niverville:
14.4% (76)
State:
11.6% (899,824)
Number of households with income $100k - 125k:
Niverville:
6.8% (36)
New York:
9.3% (723,825)
Number of households with income $125k - 150k:
Niverville:
21.0% (111)
New York:
7.1% (552,420)
Number of households with income $150k - 200k:
Niverville:
6.0% (32)
New York:
9.4% (727,051)
Number of households with income > $200k:
Niverville:
14.0% (74)
State:
15.0% (1,162,269)
Aggregate household income in Niverville in 2022: $94,927,838
Median family income in Niverville in 2022:
Niverville:
$123,325
State:
$99,066
Number of families with income < $10k:
Niverville:
2.7% (11)
New York:
4.2% (197,409)
Number of families with income $30k - 40k:
Niverville:
7.7% (32)
State:
5.5% (259,233)
Number of families with income $50k - 60k:
Niverville:
18.4% (75)
State:
5.4% (255,320)
Number of families with income $75k - 100k:
Niverville:
13.4% (55)
New York:
12.3% (583,110)
Number of families with income $100k - 125k:
Niverville:
6.3% (26)
New York:
10.6% (500,579)
Number of families with income $125k - 150k:
Niverville:
26.4% (109)
New York:
8.5% (400,594)
Number of families with income $150k - 200k:
Niverville:
7.6% (31)
State:
11.6% (551,650)
Number of families with income > $200k:
Niverville:
17.5% (72)
New York:
18.9% (895,998)
Median non-family income in Niverville in 2022:
Niverville:
$56,433
New York:
$50,181
Change in median non-family income between 2000 and 2022:
Niverville, New York:
+82.8%
State:
+85.4%
Median per capita income in Niverville in 2022:
Niverville:
$66,478
State:
$47,421
Income statistics for White residents
Median household income in Niverville, NY in 2022:
Niverville:
$98,498
State:
$89,408
Change in median household income between 2000 and 2022:
Niverville, New York:
+112.7%
State:
+85.5%
Number of households with income < $10k:
Niverville:
2.0% (10)
State:
4.8% (225,550)
Number of households with income $10k - 20k:
Niverville:
0.0% (0)
New York:
6.1% (289,425)
Number of households with income $20k - 30k:
Niverville:
0.0% (0)
State:
5.9% (280,254)
Number of households with income $30k - 40k:
Niverville:
12.9% (63)
State:
6.1% (288,263)
Number of households with income $40k - 50k:
Niverville:
0.0% (0)
State:
5.9% (278,079)
Number of households with income $50k - 60k:
Niverville:
4.7% (23)
State:
5.7% (267,554)
Number of households with income $60k - 75k:
Niverville:
16.6% (81)
State:
8.4% (398,344)
Number of households with income $75k - 100k:
Niverville:
14.7% (72)
State:
11.8% (554,841)
Number of households with income $100k - 125k:
Niverville:
7.0% (34)
New York:
10.0% (469,794)
Number of households with income $125k - 150k:
Niverville:
21.5% (105)
State:
7.6% (360,467)
Number of households with income $150k - 200k:
Niverville:
6.1% (30)
State:
10.1% (477,078)
Number of households with income > $200k:
Niverville:
14.5% (71)
State:
17.6% (829,233)
Aggregate household income in Niverville in 2022: $90,547,447
Median family income in Niverville in 2022:
Niverville:
$125,387
New York:
$115,170
Number of families with income < $10k:
Niverville:
2.5% (10)
State:
2.5% (68,851)
Number of families with income $30k - 40k:
Niverville:
4.7% (18)
New York:
4.1% (114,108)
Number of families with income $50k - 60k:
Niverville:
18.9% (72)
State:
4.9% (135,118)
Number of families with income $75k - 100k:
Niverville:
13.7% (52)
New York:
12.4% (342,382)
Number of families with income $100k - 125k:
Niverville:
6.5% (24)
State:
11.4% (314,917)
Number of families with income $125k - 150k:
Niverville:
27.5% (104)
State:
9.4% (260,489)
Number of families with income $150k - 200k:
Niverville:
7.8% (30)
New York:
13.2% (365,586)
Number of families with income > $200k:
Niverville:
18.3% (69)
State:
23.2% (642,319)
Median non-family income in Niverville in 2022:
Niverville:
$56,151
State:
$54,783
Change in median non-family income between 2000 and 2022:
Niverville, New York:
+81.9%
New York:
+87.9%
Median per capita income in Niverville in 2022:
Niverville:
$70,026
State:
$57,640
Discuss Niverville, New York (NY) on our hugely popular New York forum.