North Beach, Washington (WA) income map, earnings map, and wages data
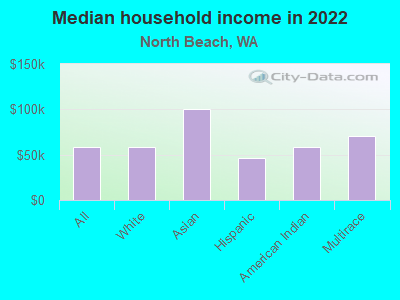
The median household income in North Beach, WA in 2022 was $58,410, which was 56.3% less than the median annual income of $91,306 across the entire state of Washington. Compared to the median income of $31,913 in 2000 this represents an increase of 45.4%. The per capita income in 2022 was $35,307, which means an increase of 48.7% compared to 2000 when it was $18,130.
Income statistics for all residents
Median household income in North Beach, WA in 2022:| North Beach: | $58,410 |
| State: | $91,306 |
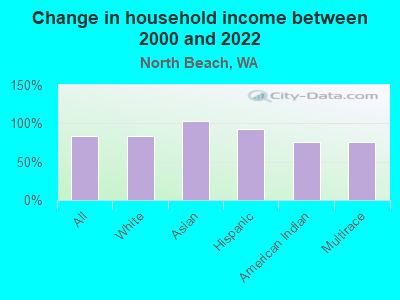
Change in median household income between 2000 and 2022:| North Beach, Washington: | +83.0% |
| State: | +99.5% |
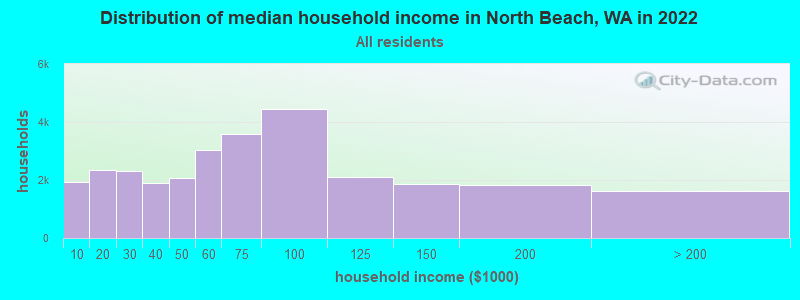
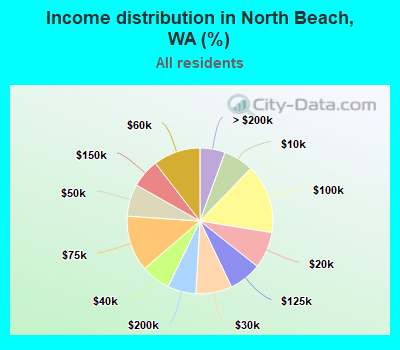
Number of households with income < $10k:| North Beach: | 6.7% (1,928) |
| State: | 4.5% (139,331) |
Number of households with income $10k - 20k:| North Beach: | 8.1% (2,353) |
| Washington: | 5.0% (154,508) |
Number of households with income $20k - 30k:| North Beach: | 8.0% (2,314) |
| State: | 5.4% (166,555) |
Number of households with income $30k - 40k:| North Beach: | 6.5% (1,886) |
| State: | 5.5% (170,324) |
Number of households with income $40k - 50k:| North Beach: | 7.1% (2,060) |
| State: | 6.0% (183,941) |
Number of households with income $50k - 60k:| North Beach: | 10.4% (3,024) |
| State: | 6.1% (187,395) |
Number of households with income $60k - 75k:| North Beach: | 12.3% (3,576) |
| Washington: | 8.7% (266,771) |
Number of households with income $75k - 100k:| North Beach: | 15.3% (4,435) |
| State: | 13.1% (404,672) |
Number of households with income $100k - 125k:| North Beach: | 7.2% (2,095) |
| State: | 11.0% (337,911) |
Number of households with income $125k - 150k:| North Beach: | 6.4% (1,845) |
| Washington: | 8.0% (244,934) |
Number of households with income $150k - 200k:| North Beach: | 6.3% (1,824) |
| State: | 10.5% (323,812) |
Number of households with income > $200k:| North Beach: | 5.6% (1,616) |
| State: | 16.2% (499,799) |
Aggregate household income in North Beach in 2022: $235,772,056
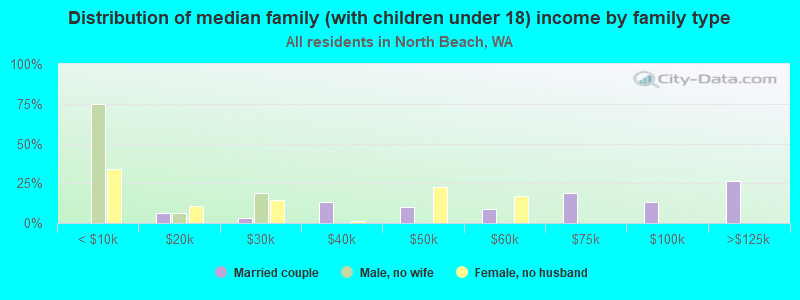
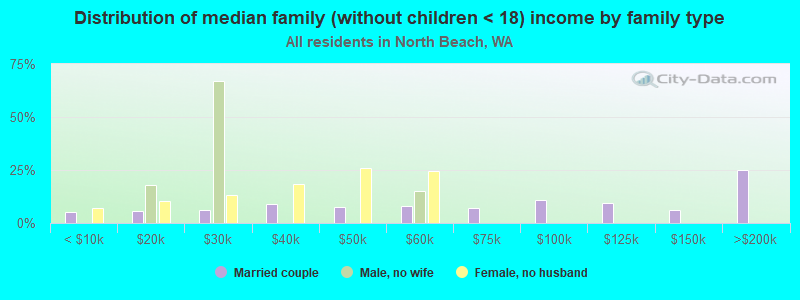
Median family income in North Beach in 2022:| North Beach: | $70,147 |
| State: | $109,192 |
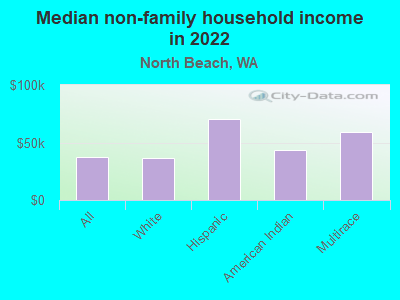
Median non-family income in North Beach in 2022:| North Beach: | $36,972 |
| State: | $57,299 |
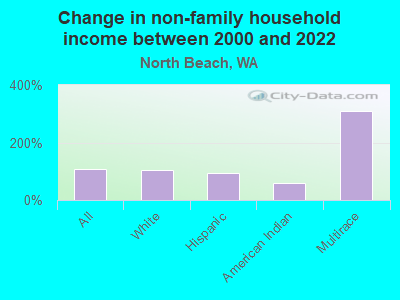
Change in median non-family income between 2000 and 2022:| North Beach, Washington: | +108.4% |
| State: | +94.9% |
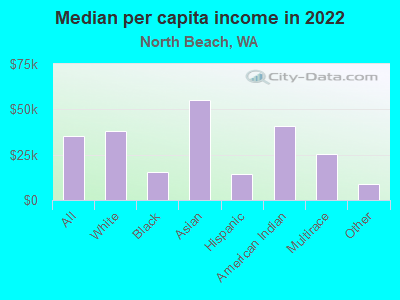
Median per capita income in North Beach in 2022:| North Beach: | $35,307 |
| State: | $50,764 |
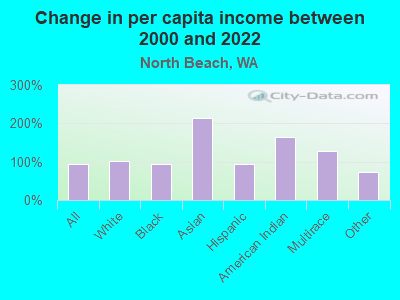
Change in median per capita income between 2000 and 2022:| North Beach, Washington: | +94.7% |
| State: | +121.0% |
Income statistics for White residents
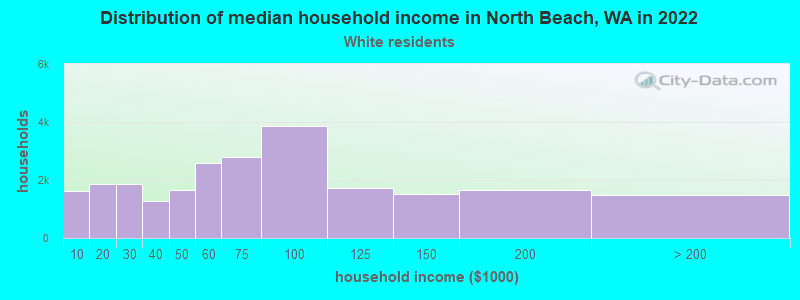
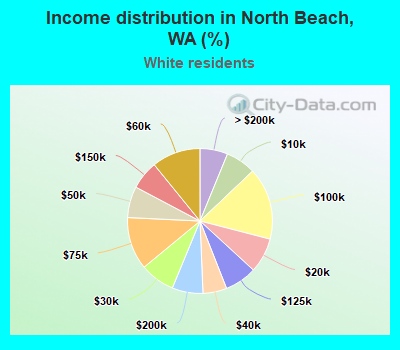
Median household income in North Beach, WA in 2022:| North Beach: | $58,662 |
| State: | $91,916 |
Change in median household income between 2000 and 2022:| North Beach, Washington: | +83.5% |
| State: | +95.4% |
Number of households with income < $10k:| North Beach: | 6.7% (1,607) |
| State: | 4.3% (95,850) |
Number of households with income $10k - 20k:| North Beach: | 7.8% (1,864) |
| State: | 4.8% (106,421) |
Number of households with income $20k - 30k:| North Beach: | 7.8% (1,858) |
| State: | 5.5% (122,860) |
Number of households with income $30k - 40k:| North Beach: | 5.3% (1,272) |
| State: | 5.4% (119,627) |
Number of households with income $40k - 50k:| North Beach: | 7.0% (1,667) |
| State: | 5.9% (132,276) |
Number of households with income $50k - 60k:| North Beach: | 10.9% (2,595) |
| Washington: | 6.1% (136,212) |
Number of households with income $60k - 75k:| North Beach: | 11.7% (2,809) |
| State: | 8.8% (196,086) |
Number of households with income $75k - 100k:| North Beach: | 16.1% (3,854) |
| State: | 13.4% (299,192) |
Number of households with income $100k - 125k:| North Beach: | 7.2% (1,720) |
| Washington: | 11.3% (252,209) |
Number of households with income $125k - 150k:| North Beach: | 6.4% (1,532) |
| Washington: | 7.9% (175,962) |
Number of households with income $150k - 200k:| North Beach: | 6.9% (1,649) |
| State: | 10.7% (239,156) |
Number of households with income > $200k:| North Beach: | 6.2% (1,482) |
| State: | 16.1% (359,917) |
Aggregate household income in North Beach in 2022: $202,615,268
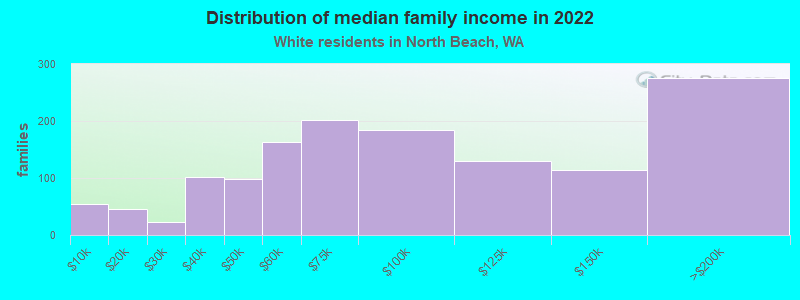
Median family income in North Beach in 2022:| North Beach: | $70,991 |
| State: | $112,511 |
Number of families with income < $10k:| North Beach: | 3.9% (54) |
| State: | 2.4% (33,676) |
Number of families with income $10k - 20k:| North Beach: | 3.2% (45) |
| State: | 2.0% (28,228) |
Number of families with income $20k - 30k:| North Beach: | 1.7% (23) |
| Washington: | 2.9% (39,288) |
Number of families with income $30k - 40k:| North Beach: | 7.3% (101) |
| State: | 3.6% (50,190) |
Number of families with income $40k - 50k:| North Beach: | 7.0% (98) |
| Washington: | 4.6% (63,009) |
Number of families with income $50k - 60k:| North Beach: | 11.8% (164) |
| State: | 5.0% (69,270) |
Number of families with income $60k - 75k:| North Beach: | 14.5% (202) |
| Washington: | 8.2% (112,369) |
Number of families with income $75k - 100k:| North Beach: | 13.2% (184) |
| State: | 14.1% (194,214) |
Number of families with income $100k - 125k:| North Beach: | 9.3% (129) |
| State: | 13.2% (182,184) |
Number of families with income $125k - 150k:| North Beach: | 8.2% (114) |
| State: | 9.5% (130,928) |
Number of families with income $150k - 200k:| North Beach: | 19.8% (275) |
| State: | 13.7% (188,621) |
Median non-family income in North Beach in 2022:| North Beach: | $36,830 |
| State: | $56,103 |
Change in median non-family income between 2000 and 2022:| North Beach, Washington: | +104.7% |
| State: | +87.7% |
Median per capita income in North Beach in 2022:| North Beach: | $38,033 |
| State: | $55,212 |
Change in median per capita income between 2000 and 2022:| North Beach, Washington: | +102.3% |
| State: | +123.8% |
Income statistics for Black or African American residents
Aggregate household income in North Beach in 2022: $725,169
Median per capita income in North Beach in 2022:| North Beach: | $15,601 |
| State: | $38,209 |
Change in median per capita income between 2000 and 2022:| North Beach, Washington: | +92.8% |
| State: | +115.3% |
Income statistics for Asian residents
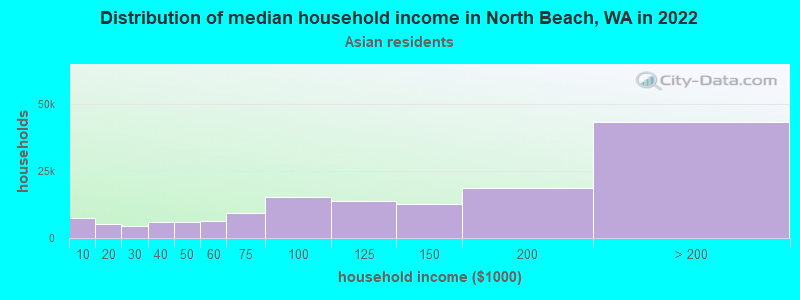
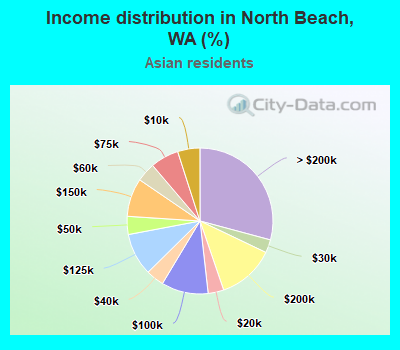
Median household income in North Beach, WA in 2022:| North Beach: | $100,402 |
| State: | $125,692 |
Change in median household income between 2000 and 2022:| North Beach, Washington: | +102.8% |
| State: | +164.5% |
Number of households with income < $10k:| North Beach: | 4.9% (7,334) |
| Washington: | 4.9% (14,099) |
Number of households with income $10k - 20k:| North Beach: | 3.5% (5,147) |
| State: | 3.5% (9,873) |
Number of households with income $20k - 30k:| North Beach: | 2.9% (4,342) |
| Washington: | 2.9% (8,352) |
Number of households with income $30k - 40k:| North Beach: | 4.0% (5,947) |
| State: | 4.0% (11,415) |
Number of households with income $40k - 50k:| North Beach: | 4.0% (5,952) |
| Washington: | 4.0% (11,421) |
Number of households with income $50k - 60k:| North Beach: | 4.2% (6,305) |
| State: | 4.2% (12,100) |
Number of households with income $60k - 75k:| North Beach: | 6.3% (9,325) |
| State: | 6.3% (17,903) |
Number of households with income $75k - 100k:| North Beach: | 10.4% (15,450) |
| State: | 10.4% (29,663) |
Number of households with income $100k - 125k:| North Beach: | 9.4% (13,980) |
| Washington: | 9.4% (26,839) |
Number of households with income $125k - 150k:| North Beach: | 8.5% (12,605) |
| State: | 8.5% (24,200) |
Number of households with income $150k - 200k:| North Beach: | 12.6% (18,777) |
| State: | 12.6% (35,976) |
Number of households with income > $200k:| North Beach: | 29.2% (43,328) |
| State: | 29.2% (83,109) |
Aggregate household income in North Beach in 2022: $2,734,708
Median per capita income in North Beach in 2022:| North Beach: | $55,310 |
| Washington: | $67,666 |
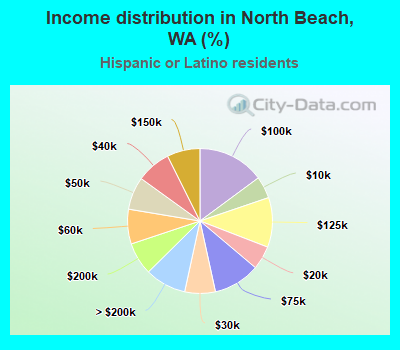
Income statistics for Hispanic or Latino residents
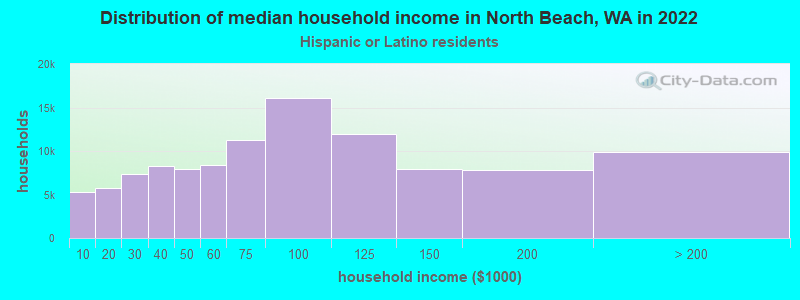
Median household income in North Beach, WA in 2022:| North Beach: | $46,648 |
| Washington: | $74,770 |
Change in median household income between 2000 and 2022:| North Beach, Washington: | +93.4% |
| State: | +128.3% |
Number of households with income < $10k:| North Beach: | 4.9% (5,286) |
| State: | 4.9% (14,456) |
Number of households with income $10k - 20k:| North Beach: | 5.3% (5,692) |
| State: | 5.3% (15,449) |
Number of households with income $20k - 30k:| North Beach: | 6.8% (7,363) |
| State: | 6.8% (20,016) |
Number of households with income $30k - 40k:| North Beach: | 7.7% (8,301) |
| State: | 7.7% (22,548) |
Number of households with income $40k - 50k:| North Beach: | 7.3% (7,915) |
| State: | 7.3% (21,450) |
Number of households with income $50k - 60k:| North Beach: | 7.7% (8,359) |
| State: | 7.7% (22,744) |
Number of households with income $60k - 75k:| North Beach: | 10.4% (11,271) |
| Washington: | 10.5% (30,737) |
Number of households with income $75k - 100k:| North Beach: | 14.9% (16,067) |
| State: | 14.9% (43,843) |
Number of households with income $100k - 125k:| North Beach: | 11.1% (11,984) |
| Washington: | 11.1% (32,554) |
Number of households with income $125k - 150k:| North Beach: | 7.4% (7,938) |
| State: | 7.4% (21,624) |
Number of households with income $150k - 200k:| North Beach: | 7.3% (7,851) |
| State: | 7.3% (21,360) |
Number of households with income > $200k:| North Beach: | 9.2% (9,940) |
| State: | 9.2% (27,055) |
Aggregate household income in North Beach in 2022: $4,378,015
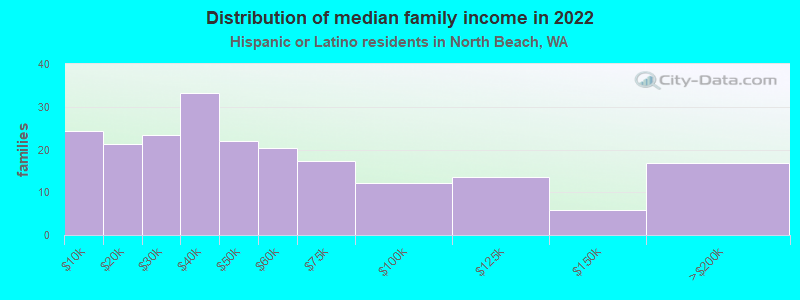
Median family income in North Beach in 2022:| North Beach: | $40,083 |
| State: | $76,866 |
Number of families with income < $10k:| North Beach: | 11.6% (24) |
| Washington: | 4.4% (9,443) |
Number of families with income $10k - 20k:| North Beach: | 10.2% (21) |
| State: | 3.5% (7,524) |
Number of families with income $20k - 30k:| North Beach: | 11.1% (23) |
| State: | 5.6% (12,052) |
Number of families with income $30k - 40k:| North Beach: | 15.8% (33) |
| Washington: | 8.3% (17,803) |
Number of families with income $40k - 50k:| North Beach: | 10.5% (22) |
| State: | 7.7% (16,361) |
Number of families with income $50k - 60k:| North Beach: | 9.7% (20) |
| Washington: | 7.9% (16,852) |
Number of families with income $60k - 75k:| North Beach: | 8.2% (17) |
| Washington: | 11.4% (24,342) |
Number of families with income $75k - 100k:| North Beach: | 5.8% (12) |
| State: | 14.4% (30,698) |
Number of families with income $100k - 125k:| North Beach: | 6.4% (14) |
| State: | 11.4% (24,331) |
Number of families with income $125k - 150k:| North Beach: | 2.7% (6) |
| State: | 7.5% (16,099) |
Number of families with income $150k - 200k:| North Beach: | 8.0% (17) |
| State: | 8.2% (17,551) |
Median non-family income in North Beach in 2022:| North Beach: | $70,060 |
| State: | $54,173 |
Change in median non-family income between 2000 and 2022:| North Beach, Washington: | +93.3% |
| Washington: | +105.8% |
Median per capita income in North Beach in 2022:| North Beach: | $14,411 |
| State: | $28,252 |
Change in median per capita income between 2000 and 2022:| North Beach, Washington: | +92.9% |
| State: | +150.2% |
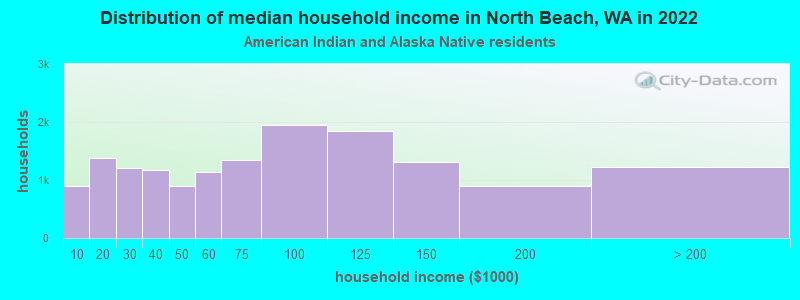
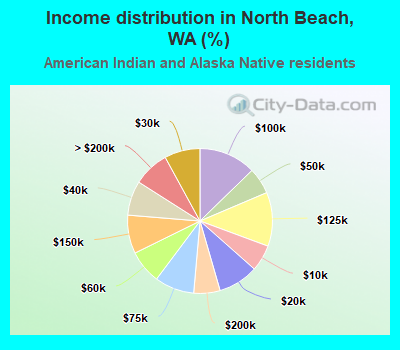
Income statistics for American Indian and Alaska Native residents
Median household income in North Beach, WA in 2022:| North Beach: | $58,107 |
| Washington: | $71,255 |
Change in median household income between 2000 and 2022:| North Beach, Washington: | +75.4% |
| State: | +118.1% |
Number of households with income < $10k:| North Beach: | 5.9% (900) |
| Washington: | 5.9% (1,768) |
Number of households with income $10k - 20k:| North Beach: | 9.0% (1,374) |
| Washington: | 8.9% (2,694) |
Number of households with income $20k - 30k:| North Beach: | 8.0% (1,215) |
| Washington: | 8.0% (2,412) |
Number of households with income $30k - 40k:| North Beach: | 7.7% (1,177) |
| State: | 7.7% (2,327) |
Number of households with income $40k - 50k:| North Beach: | 5.9% (900) |
| State: | 5.8% (1,755) |
Number of households with income $50k - 60k:| North Beach: | 7.5% (1,145) |
| Washington: | 7.5% (2,259) |
Number of households with income $60k - 75k:| North Beach: | 8.8% (1,350) |
| State: | 8.8% (2,669) |
Number of households with income $75k - 100k:| North Beach: | 12.7% (1,946) |
| State: | 12.8% (3,861) |
Number of households with income $100k - 125k:| North Beach: | 12.0% (1,837) |
| Washington: | 12.0% (3,618) |
Number of households with income $125k - 150k:| North Beach: | 8.6% (1,312) |
| State: | 8.6% (2,580) |
Number of households with income $150k - 200k:| North Beach: | 5.9% (897) |
| State: | 5.9% (1,774) |
Number of households with income > $200k:| North Beach: | 8.0% (1,228) |
| State: | 8.1% (2,447) |
Aggregate household income in North Beach in 2022: $6,689,377
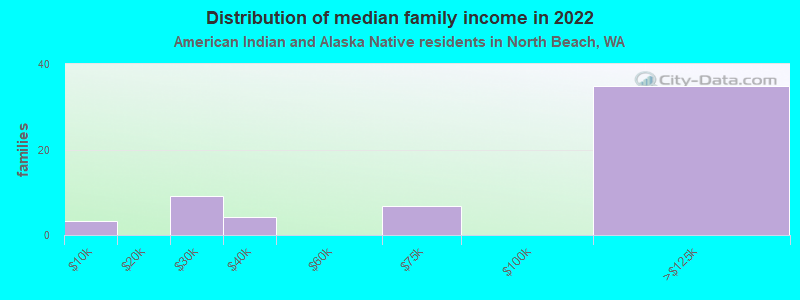
Median family income in North Beach in 2022:| North Beach: | $33,231 |
| State: | $79,010 |
Number of families with income < $10k:| North Beach: | 5.5% (3) |
| State: | 5.2% (1,047) |
Number of families with income $20k - 30k:| North Beach: | 15.5% (9) |
| State: | 6.2% (1,258) |
Number of families with income $30k - 40k:| North Beach: | 7.3% (4) |
| State: | 5.9% (1,190) |
Number of families with income $60k - 75k:| North Beach: | 11.7% (7) |
| State: | 10.5% (2,124) |
Number of families with income $100k - 125k:| North Beach: | 60.0% (35) |
| Washington: | 13.7% (2,784) |
Median non-family income in North Beach in 2022:| North Beach: | $43,572 |
| Washington: | $35,591 |
Change in median non-family income between 2000 and 2022:| North Beach, Washington: | +58.4% |
| State: | +61.8% |
Median per capita income in North Beach in 2022:| North Beach: | $40,673 |
| State: | $27,053 |
Income statistics for Multirace residents
Median household income in North Beach, WA in 2022:| North Beach: | $70,994 |
| State: | $84,303 |
Change in median household income between 2000 and 2022:| North Beach, Washington: | +75.9% |
| State: | +125.7% |
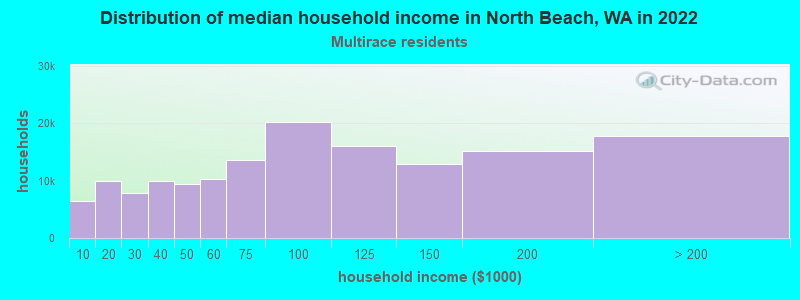
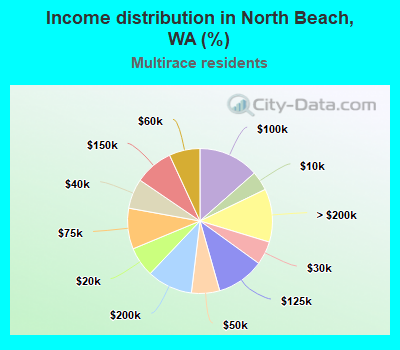
Number of households with income < $10k:| North Beach: | 4.3% (6,505) |
| State: | 4.3% (12,040) |
Number of households with income $10k - 20k:| North Beach: | 6.6% (9,962) |
| State: | 6.6% (18,437) |
Number of households with income $20k - 30k:| North Beach: | 5.2% (7,862) |
| State: | 5.2% (14,559) |
Number of households with income $30k - 40k:| North Beach: | 6.7% (9,990) |
| State: | 6.7% (18,491) |
Number of households with income $40k - 50k:| North Beach: | 6.3% (9,435) |
| State: | 6.3% (17,459) |
Number of households with income $50k - 60k:| North Beach: | 6.9% (10,307) |
| State: | 6.9% (19,086) |
Number of households with income $60k - 75k:| North Beach: | 9.1% (13,676) |
| State: | 9.1% (25,310) |
Number of households with income $75k - 100k:| North Beach: | 13.5% (20,252) |
| State: | 13.5% (37,493) |
Number of households with income $100k - 125k:| North Beach: | 10.7% (16,000) |
| State: | 10.7% (29,626) |
Number of households with income $125k - 150k:| North Beach: | 8.6% (12,910) |
| State: | 8.6% (23,899) |
Number of households with income $150k - 200k:| North Beach: | 10.2% (15,248) |
| Washington: | 10.2% (28,214) |
Number of households with income > $200k:| North Beach: | 11.9% (17,797) |
| State: | 11.9% (32,947) |
Aggregate household income in North Beach in 2022: $28,562,439
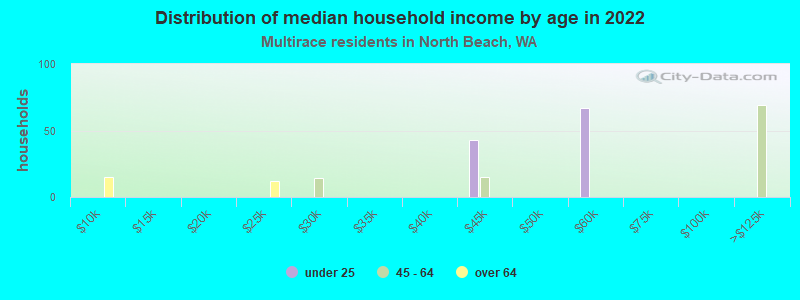
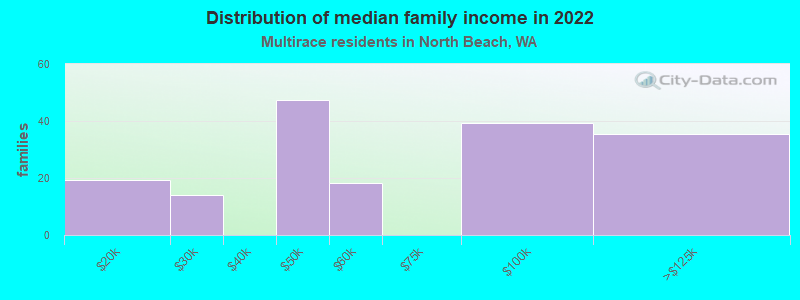
Median family income in North Beach in 2022:| North Beach: | $93,022 |
| State: | $95,629 |
Number of families with income $10k - 20k:| North Beach: | 11.1% (19) |
| State: | 4.3% (7,519) |
Number of families with income $20k - 30k:| North Beach: | 8.0% (14) |
| Washington: | 4.4% (7,775) |
Number of families with income $40k - 50k:| North Beach: | 27.3% (47) |
| Washington: | 5.9% (10,412) |
Number of families with income $50k - 60k:| North Beach: | 10.5% (18) |
| State: | 5.6% (9,922) |
Number of families with income $75k - 100k:| North Beach: | 22.7% (39) |
| Washington: | 13.6% (23,984) |
Number of families with income $100k - 125k:| North Beach: | 20.4% (35) |
| State: | 10.4% (18,288) |
Median non-family income in North Beach in 2022:| North Beach: | $59,319 |
| State: | $56,573 |
Median per capita income in North Beach in 2022:| North Beach: | $25,298 |
| Washington: | $32,496 |
Change in median per capita income between 2000 and 2022:| North Beach, Washington: | +127.6% |
| Washington: | +156.8% |
Income statistics for other residents
Number of households with income < $10k:| North Beach: | 3.3% (1) |
| State: | 5.3% (6,540) |
Number of households with income $10k - 20k:| North Beach: | 6.7% (2) |
| Washington: | 6.0% (7,385) |
Number of households with income $20k - 30k:| North Beach: | 10.0% (3) |
| Washington: | 7.5% (9,289) |
Number of households with income $30k - 40k:| North Beach: | 10.0% (3) |
| State: | 8.9% (11,015) |
Number of households with income $40k - 50k:| North Beach: | 6.7% (2) |
| Washington: | 7.6% (9,399) |
Number of households with income $50k - 60k:| North Beach: | 6.7% (2) |
| State: | 7.2% (8,867) |
Number of households with income $60k - 75k:| North Beach: | 10.0% (3) |
| Washington: | 10.5% (13,032) |
Number of households with income $75k - 100k:| North Beach: | 13.3% (4) |
| Washington: | 14.6% (18,007) |
Number of households with income $100k - 125k:| North Beach: | 13.3% (4) |
| Washington: | 12.2% (15,128) |
Number of households with income $125k - 150k:| North Beach: | 6.7% (2) |
| State: | 5.6% (6,950) |
Number of households with income $150k - 200k:| North Beach: | 6.7% (2) |
| State: | 7.1% (8,749) |
Number of households with income > $200k:| North Beach: | 6.7% (2) |
| Washington: | 7.5% (9,208) |
Aggregate household income in North Beach in 2022: $2,864,096
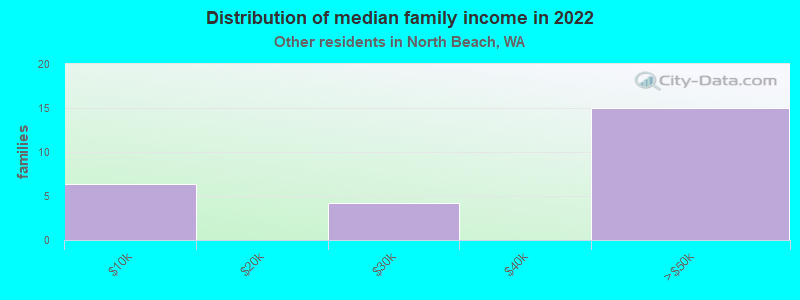
Median family income in North Beach in 2022:| North Beach: | $37,555 |
| Washington: | $72,588 |
Number of families with income < $10k:| North Beach: | 25.0% (6) |
| Washington: | 5.5% (5,287) |
Number of families with income $20k - 30k:| North Beach: | 16.5% (4) |
| State: | 6.6% (6,293) |
Number of families with income $40k - 50k:| North Beach: | 58.5% (15) |
| Washington: | 8.0% (7,634) |
Median per capita income in North Beach in 2022:| North Beach: | $8,907 |
| State: | $27,542 |
Change in median per capita income between 2000 and 2022:| North Beach, Washington: | +74.3% |
| Washington: | +167.8% |