The median household income in North Granby, CT in 2022 was $112,254, which was 21.2% greater than the median annual income of $88,429 across the entire state of Connecticut. Compared to the median income of $101,103 in 2000 this represents an increase of 9.9%. The per capita income in 2022 was $64,978, which means an increase of 47.0% compared to 2000 when it was $34,459.
Whole page based on the data from 2000 / 2022 when the population of North Granby, Connecticut was 1,720 / 1,562
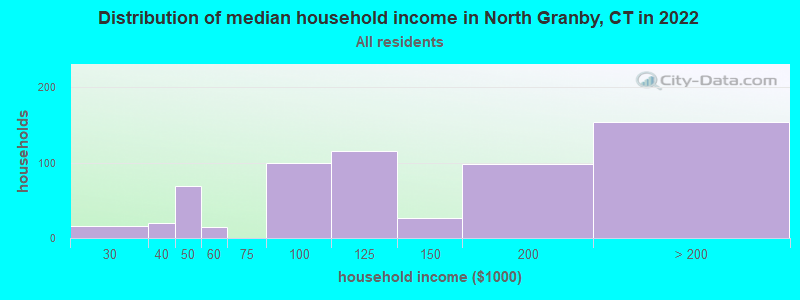
Income statistics for all residents
Median household income in North Granby, CT in 2022:
North Granby:
$112,254
State:
$88,429
Change in median household income between 2000 and 2022:
North Granby, Connecticut:
+11.0%
State:
+64.0%
Number of households with income < $10k:
North Granby:
0.0% (0)
State:
5.1% (72,746)
Number of households with income $10k - 20k:
North Granby:
0.0% (0)
State:
5.7% (81,643)
Number of households with income $20k - 30k:
North Granby:
2.6% (16)
State:
6.5% (92,844)
Number of households with income $30k - 40k:
North Granby:
3.3% (20)
State:
5.9% (83,934)
Number of households with income $40k - 50k:
North Granby:
11.3% (69)
State:
5.8% (83,025)
Number of households with income $50k - 60k:
North Granby:
2.3% (14)
Connecticut:
5.7% (81,788)
Number of households with income $60k - 75k:
North Granby:
0.0% (0)
Connecticut:
8.1% (115,651)
Number of households with income $75k - 100k:
North Granby:
16.2% (99)
State:
12.6% (180,173)
Number of households with income $100k - 125k:
North Granby:
18.8% (115)
Connecticut:
9.9% (141,231)
Number of households with income $125k - 150k:
North Granby:
4.4% (27)
State:
7.9% (112,826)
Number of households with income $150k - 200k:
North Granby:
16.0% (98)
Connecticut:
10.8% (154,641)
Number of households with income > $200k:
North Granby:
25.2% (154)
State:
16.3% (233,133)
Aggregate household income in North Granby in 2022: $99,834,136
Median family income in North Granby in 2022:
North Granby:
$136,988
State:
$115,183
Number of families with income $40k - 50k:
North Granby:
2.4% (12)
State:
4.8% (43,104)
Number of families with income $50k - 60k:
North Granby:
2.8% (14)
State:
4.8% (43,284)
Number of families with income $75k - 100k:
North Granby:
20.0% (99)
State:
12.9% (116,232)
Number of families with income $100k - 125k:
North Granby:
19.7% (97)
State:
10.6% (95,504)
Number of families with income $125k - 150k:
North Granby:
5.4% (27)
State:
9.5% (86,149)
Number of families with income $150k - 200k:
North Granby:
18.4% (90)
Connecticut:
14.0% (125,908)
Number of families with income > $200k:
North Granby:
31.3% (154)
State:
22.4% (202,515)
Median non-family income in North Granby in 2022:
North Granby:
$43,601
State:
$50,964
Change in median non-family income between 2000 and 2022:: -7.5%
North Granby, Connecticut:
-7.5%
State:
+65.1%
Median per capita income in North Granby in 2022:
North Granby:
$64,978
State:
$51,581
Change in median per capita income between 2000 and 2022:
North Granby, Connecticut:
+88.6%
State:
+79.3%
Income statistics for White residents
Median household income in North Granby, CT in 2022:
North Granby:
$112,549
State:
$96,890
Change in median household income between 2000 and 2022:
North Granby, Connecticut:
+11.5%
Connecticut:
+68.5%
Number of households with income < $10k:
North Granby:
0.0% (0)
State:
4.2% (42,265)
Number of households with income $10k - 20k:
North Granby:
0.0% (0)
State:
4.8% (48,323)
Number of households with income $20k - 30k:
North Granby:
2.5% (14)
State:
5.7% (57,716)
Number of households with income $30k - 40k:
North Granby:
3.4% (19)
State:
5.3% (53,827)
Number of households with income $40k - 50k:
North Granby:
11.4% (64)
State:
5.3% (53,301)
Number of households with income $50k - 60k:
North Granby:
2.5% (14)
Connecticut:
5.5% (55,690)
Number of households with income $60k - 75k:
North Granby:
0.0% (0)
Connecticut:
8.0% (80,329)
Number of households with income $75k - 100k:
North Granby:
14.2% (80)
Connecticut:
12.7% (128,070)
Number of households with income $100k - 125k:
North Granby:
19.0% (107)
Connecticut:
10.0% (101,210)
Number of households with income $125k - 150k:
North Granby:
4.3% (24)
State:
8.0% (81,250)
Number of households with income $150k - 200k:
North Granby:
16.7% (94)
Connecticut:
11.8% (119,527)
Number of households with income > $200k:
North Granby:
26.1% (147)
State:
18.6% (187,875)
Aggregate household income in North Granby in 2022: $93,240,557
Median family income in North Granby in 2022:
North Granby:
$155,770
Connecticut:
$128,955
Number of families with income $40k - 50k:
North Granby:
2.6% (12)
State:
3.9% (24,550)
Number of families with income $50k - 60k:
North Granby:
2.8% (13)
State:
4.3% (26,723)
Number of families with income $75k - 100k:
North Granby:
17.2% (78)
Connecticut:
12.5% (77,679)
Number of families with income $100k - 125k:
North Granby:
20.3% (92)
State:
11.1% (69,086)
Number of families with income $125k - 150k:
North Granby:
5.2% (23)
State:
9.6% (59,616)
Number of families with income $150k - 200k:
North Granby:
19.3% (87)
State:
15.7% (97,890)
Number of families with income > $200k:
North Granby:
32.5% (147)
Connecticut:
26.3% (163,417)
Median non-family income in North Granby in 2022:
North Granby:
$42,543
State:
$54,067
Change in median non-family income between 2000 and 2022:: -9.7%
North Granby, Connecticut:
-9.7%
Connecticut:
+68.7%
Median per capita income in North Granby in 2022:
North Granby:
$67,730
Connecticut:
$59,916
Change in median per capita income between 2000 and 2022:
North Granby, Connecticut:
+97.2%
Connecticut:
+90.2%
Income statistics for Black or African American residents
Median per capita income in North Granby in 2022:
North Granby:
$233,014
State:
$36,289
Income statistics for Asian residents
Median per capita income in North Granby in 2022:
North Granby:
$106,730
Connecticut:
$55,295
Change in median per capita income between 2000 and 2022:
North Granby, Connecticut:
+103.6%
Connecticut:
+97.8%
Discuss North Granby, Connecticut (CT) on our hugely popular Connecticut forum.