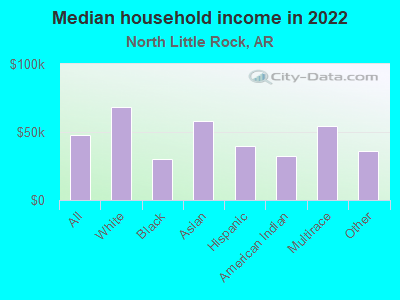
The median household income in North Little Rock, AR in 2022 was $47,464, which was 16.8% less than the median annual income of $55,432 across the entire state of Arkansas. Compared to the median income of $35,578 in 2000 this represents an increase of 25.0%. The per capita income in 2022 was $31,343, which means an increase of 37.3% compared to 2000 when it was $19,662.
Whole page based on the data from 2000 / 2022 when the population of North Little Rock, Arkansas was 60,433 / 64,587
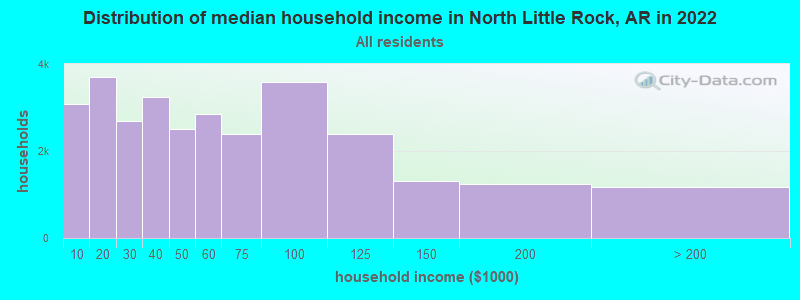
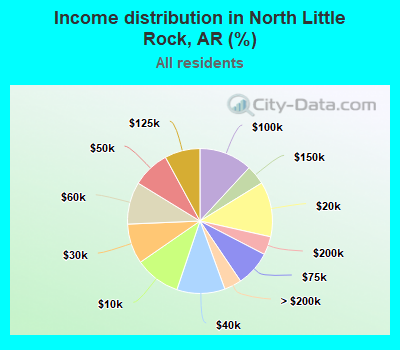
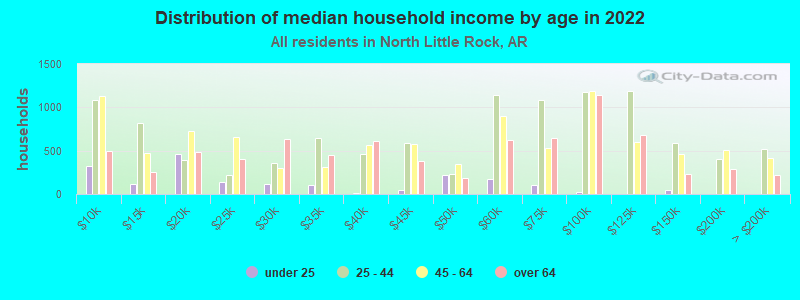
Income statistics for all residents
Median household income in North Little Rock, AR in 2022:
North Little Rock:
$47,465
State:
$55,432
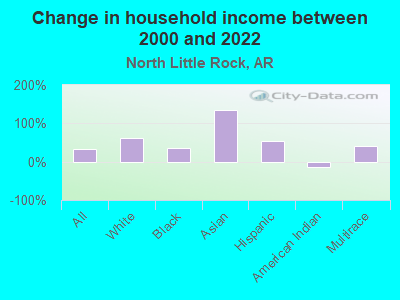
Change in median household income between 2000 and 2022:
North Little Rock, Arkansas:
+33.4%
State:
+72.2%
Number of households with income < $10k:
North Little Rock:
10.2% (3,077)
State:
7.3% (88,467)
Number of households with income $10k - 20k:
North Little Rock:
12.3% (3,710)
State:
10.6% (128,341)
Number of households with income $20k - 30k:
North Little Rock:
8.9% (2,700)
State:
9.3% (113,436)
Number of households with income $30k - 40k:
North Little Rock:
10.7% (3,242)
State:
9.5% (114,963)
Number of households with income $40k - 50k:
North Little Rock:
8.3% (2,517)
Arkansas:
8.7% (105,305)
Number of households with income $50k - 60k:
North Little Rock:
9.4% (2,852)
State:
7.8% (94,354)
Number of households with income $60k - 75k:
North Little Rock:
7.9% (2,393)
State:
10.3% (125,593)
Number of households with income $75k - 100k:
North Little Rock:
11.8% (3,576)
State:
12.6% (153,830)
Number of households with income $100k - 125k:
North Little Rock:
7.9% (2,384)
State:
8.3% (101,209)
Number of households with income $125k - 150k:
North Little Rock:
4.4% (1,320)
Arkansas:
5.1% (61,560)
Number of households with income $150k - 200k:
North Little Rock:
4.1% (1,242)
State:
5.1% (62,566)
Number of households with income > $200k:
North Little Rock:
3.9% (1,173)
State:
5.5% (66,583)
Aggregate household income in North Little Rock in 2022: $1,997,116,770
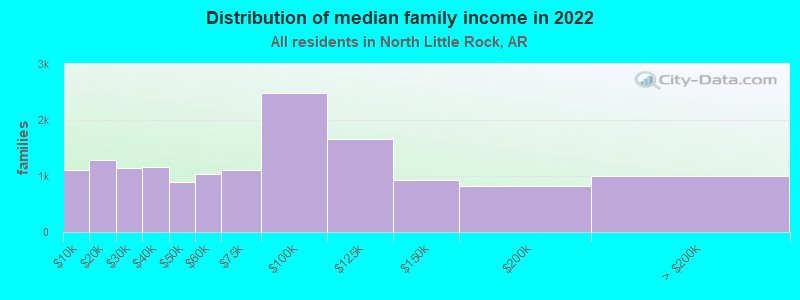
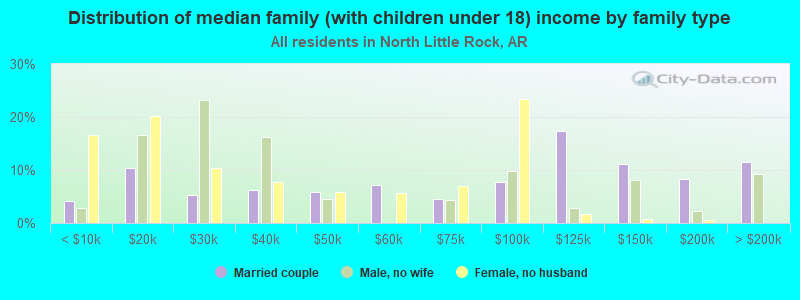
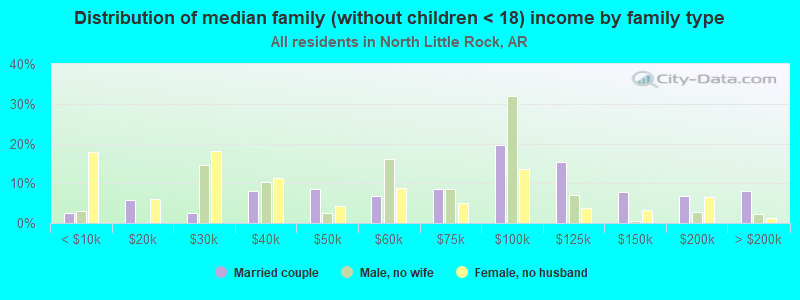
Median family income in North Little Rock in 2022:
North Little Rock:
$65,361
Arkansas:
$70,708
Number of families with income < $10k:
North Little Rock:
7.6% (1,104)
State:
4.5% (35,013)
Number of families with income $10k - 20k:
North Little Rock:
8.8% (1,279)
State:
5.2% (40,127)
Number of families with income $20k - 30k:
North Little Rock:
7.8% (1,142)
Arkansas:
7.1% (55,246)
Number of families with income $30k - 40k:
North Little Rock:
7.9% (1,160)
State:
8.3% (64,733)
Number of families with income $40k - 50k:
North Little Rock:
6.1% (885)
Arkansas:
8.5% (66,171)
Number of families with income $50k - 60k:
North Little Rock:
7.1% (1,039)
State:
7.8% (60,533)
Number of families with income $60k - 75k:
North Little Rock:
7.6% (1,103)
Arkansas:
11.3% (87,716)
Number of families with income $75k - 100k:
North Little Rock:
17.0% (2,480)
State:
15.4% (119,552)
Number of families with income $100k - 125k:
North Little Rock:
11.4% (1,660)
Arkansas:
10.7% (83,139)
Number of families with income $125k - 150k:
North Little Rock:
6.3% (920)
State:
6.9% (53,320)
Number of families with income $150k - 200k:
North Little Rock:
5.7% (829)
State:
7.0% (54,640)
Number of families with income > $200k:
North Little Rock:
6.9% (1,000)
Arkansas:
7.4% (57,743)
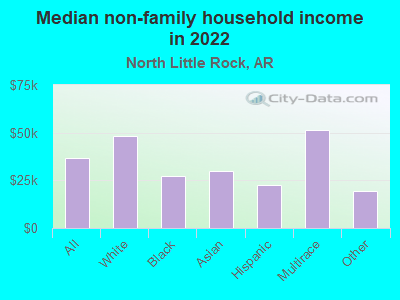
Median non-family income in North Little Rock in 2022:
North Little Rock:
$36,560
State:
$31,230
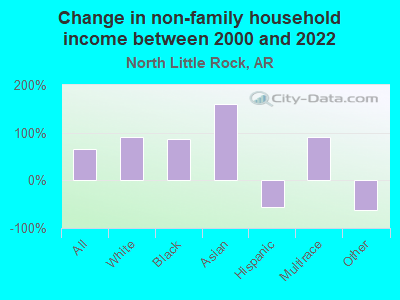
Change in median non-family income between 2000 and 2022:
North Little Rock, Arkansas:
+65.0%
State:
+73.5%
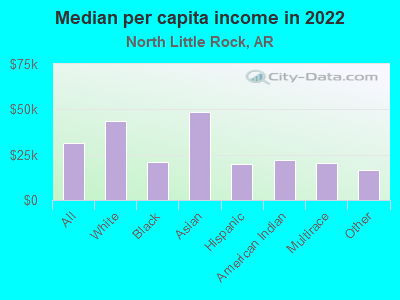
Median per capita income in North Little Rock in 2022:
North Little Rock:
$31,344
Arkansas:
$31,380
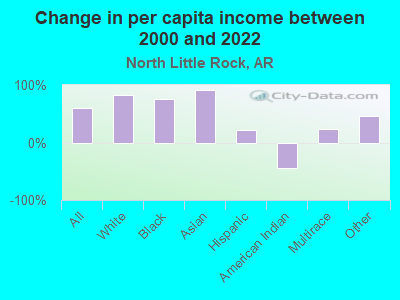
Change in median per capita income between 2000 and 2022:
North Little Rock, Arkansas:
+59.4%
State:
+85.6%
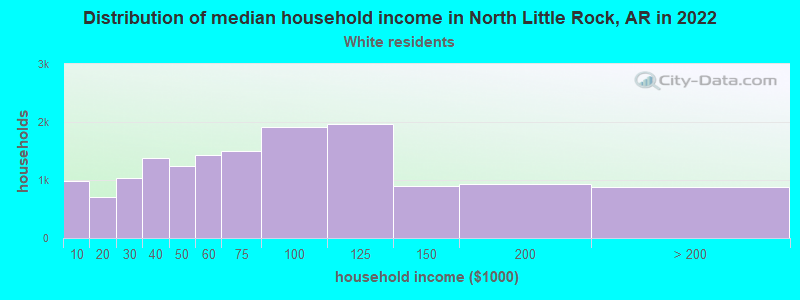
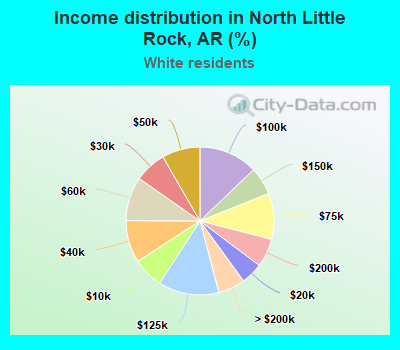
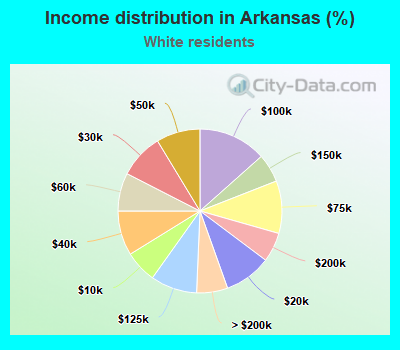
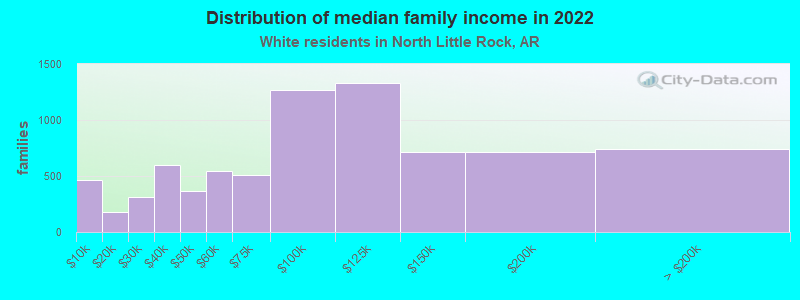
Income statistics for White residents
Median household income in North Little Rock, AR in 2022:
North Little Rock:
$68,070
State:
$60,595
Change in median household income between 2000 and 2022:
North Little Rock, Arkansas:
+63.4%
Arkansas:
+75.1%
Number of households with income < $10k:
North Little Rock:
6.7% (991)
State:
6.3% (55,696)
Number of households with income $10k - 20k:
North Little Rock:
4.8% (706)
State:
9.3% (81,739)
Number of households with income $20k - 30k:
North Little Rock:
6.9% (1,030)
State:
8.8% (77,378)
Number of households with income $30k - 40k:
North Little Rock:
9.2% (1,372)
State:
8.8% (77,496)
Number of households with income $40k - 50k:
North Little Rock:
8.3% (1,237)
Arkansas:
8.7% (76,115)
Number of households with income $50k - 60k:
North Little Rock:
9.6% (1,428)
Arkansas:
7.5% (66,259)
Number of households with income $60k - 75k:
North Little Rock:
10.1% (1,493)
State:
10.4% (91,072)
Number of households with income $75k - 100k:
North Little Rock:
12.9% (1,908)
State:
13.4% (118,116)
Number of households with income $100k - 125k:
North Little Rock:
13.3% (1,970)
State:
9.2% (80,719)
Number of households with income $125k - 150k:
North Little Rock:
6.1% (904)
State:
5.6% (49,507)
Number of households with income $150k - 200k:
North Little Rock:
6.2% (925)
Arkansas:
5.8% (51,161)
Number of households with income > $200k:
North Little Rock:
5.9% (875)
Arkansas:
6.1% (53,810)
Aggregate household income in North Little Rock in 2022: $1,257,626,704
Median family income in North Little Rock in 2022:
North Little Rock:
$86,496
State:
$77,061
Number of families with income < $10k:
North Little Rock:
6.0% (465)
Arkansas:
3.7% (21,450)
Number of families with income $10k - 20k:
North Little Rock:
2.4% (183)
State:
4.3% (24,477)
Number of families with income $20k - 30k:
North Little Rock:
4.0% (313)
Arkansas:
6.5% (37,010)
Number of families with income $30k - 40k:
North Little Rock:
7.7% (599)
Arkansas:
7.4% (42,177)
Number of families with income $40k - 50k:
North Little Rock:
4.7% (365)
State:
8.0% (45,722)
Number of families with income $50k - 60k:
North Little Rock:
7.0% (543)
Arkansas:
7.3% (41,667)
Number of families with income $60k - 75k:
North Little Rock:
6.6% (512)
Arkansas:
11.0% (63,207)
Number of families with income $75k - 100k:
North Little Rock:
16.3% (1,265)
Arkansas:
16.2% (92,829)
Number of families with income $100k - 125k:
North Little Rock:
17.2% (1,330)
Arkansas:
11.7% (66,707)
Number of families with income $125k - 150k:
North Little Rock:
9.2% (712)
Arkansas:
7.7% (44,225)
Number of families with income $150k - 200k:
North Little Rock:
9.2% (713)
Arkansas:
7.9% (45,398)
Number of families with income > $200k:
North Little Rock:
9.6% (744)
State:
8.3% (47,690)
Median non-family income in North Little Rock in 2022:
North Little Rock:
$48,303
State:
$33,651
Change in median non-family income between 2000 and 2022:
North Little Rock, Arkansas:
+90.5%
State:
+75.3%
Median per capita income in North Little Rock in 2022:
North Little Rock:
$43,387
State:
$34,985
Change in median per capita income between 2000 and 2022:
North Little Rock, Arkansas:
+82.0%
State:
+89.9%
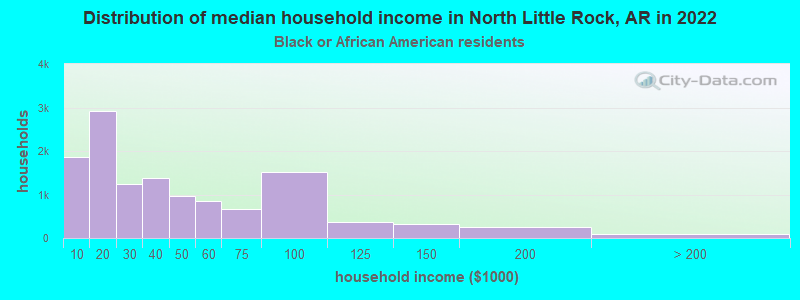
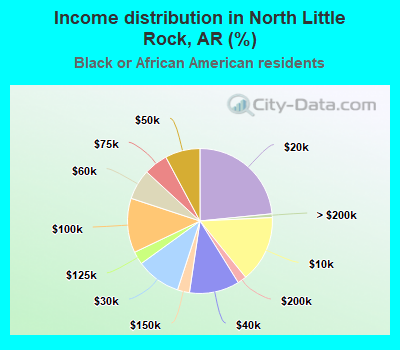
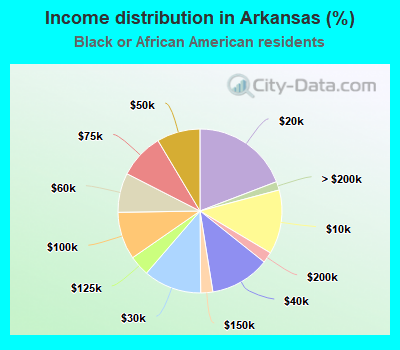
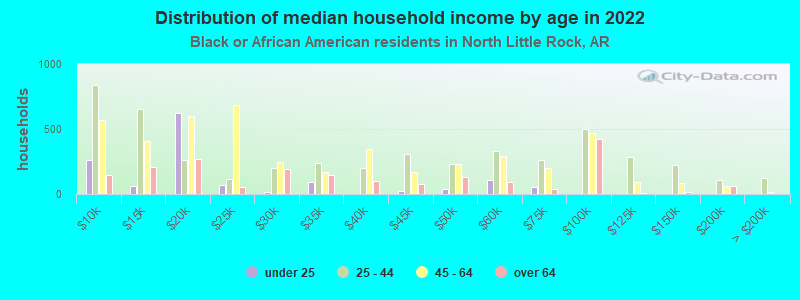
Income statistics for Black or African American residents
Median household income in North Little Rock, AR in 2022:
North Little Rock:
$30,137
State:
$35,703
Change in median household income between 2000 and 2022:
North Little Rock, Arkansas:
+36.1%
State:
+72.5%
Number of households with income < $10k:
North Little Rock:
14.9% (1,854)
Arkansas:
12.7% (23,314)
Number of households with income $10k - 20k:
North Little Rock:
23.4% (2,913)
State:
19.2% (35,357)
Number of households with income $20k - 30k:
North Little Rock:
10.0% (1,244)
State:
11.4% (21,073)
Number of households with income $30k - 40k:
North Little Rock:
11.2% (1,390)
State:
11.8% (21,694)
Number of households with income $40k - 50k:
North Little Rock:
7.8% (970)
State:
8.5% (15,750)
Number of households with income $50k - 60k:
North Little Rock:
6.8% (843)
State:
7.8% (14,317)
Number of households with income $60k - 75k:
North Little Rock:
5.4% (666)
State:
8.9% (16,442)
Number of households with income $75k - 100k:
North Little Rock:
12.2% (1,512)
State:
9.4% (17,292)
Number of households with income $100k - 125k:
North Little Rock:
2.9% (358)
State:
4.0% (7,458)
Number of households with income $125k - 150k:
North Little Rock:
2.7% (333)
Arkansas:
2.4% (4,410)
Number of households with income $150k - 200k:
North Little Rock:
2.0% (250)
State:
2.2% (4,004)
Number of households with income > $200k:
North Little Rock:
0.8% (103)
State:
1.7% (3,121)
Aggregate household income in North Little Rock in 2022: $538,794,159
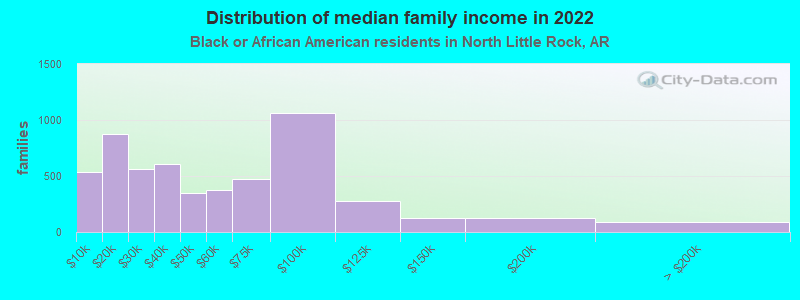
Median family income in North Little Rock in 2022:
North Little Rock:
$47,921
Arkansas:
$49,020
Number of families with income < $10k:
North Little Rock:
9.9% (540)
State:
9.0% (8,750)
Number of families with income $10k - 20k:
North Little Rock:
16.0% (871)
Arkansas:
10.8% (10,530)
Number of families with income $20k - 30k:
North Little Rock:
10.4% (565)
State:
10.5% (10,186)
Number of families with income $30k - 40k:
North Little Rock:
11.1% (604)
Arkansas:
10.1% (9,824)
Number of families with income $40k - 50k:
North Little Rock:
6.4% (348)
State:
10.7% (10,377)
Number of families with income $50k - 60k:
North Little Rock:
6.9% (377)
State:
8.5% (8,326)
Number of families with income $60k - 75k:
North Little Rock:
8.7% (474)
State:
12.5% (12,151)
Number of families with income $75k - 100k:
North Little Rock:
19.5% (1,060)
Arkansas:
13.0% (12,700)
Number of families with income $100k - 125k:
North Little Rock:
5.1% (277)
State:
6.4% (6,234)
Number of families with income $125k - 150k:
North Little Rock:
2.2% (122)
State:
3.0% (2,907)
Number of families with income $150k - 200k:
North Little Rock:
2.3% (126)
State:
3.1% (3,058)
Number of families with income > $200k:
North Little Rock:
1.6% (86)
Arkansas:
2.4% (2,377)
Median non-family income in North Little Rock in 2022:
North Little Rock:
$27,321
State:
$23,144
Change in median non-family income between 2000 and 2022:
North Little Rock, Arkansas:
+85.9%
State:
+94.3%
Median per capita income in North Little Rock in 2022:
North Little Rock:
$21,074
State:
$22,000
Change in median per capita income between 2000 and 2022:
North Little Rock, Arkansas:
+75.4%
Arkansas:
+107.9%
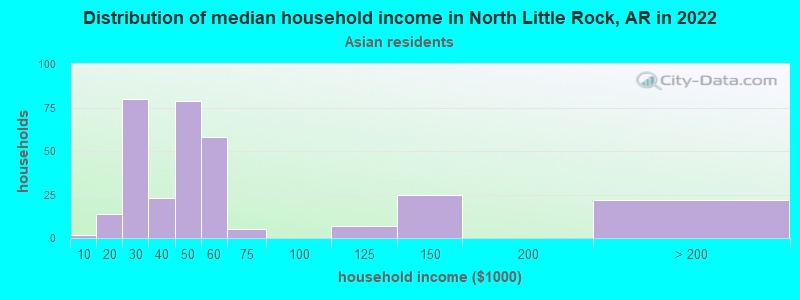
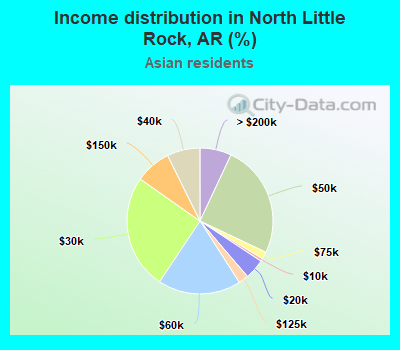
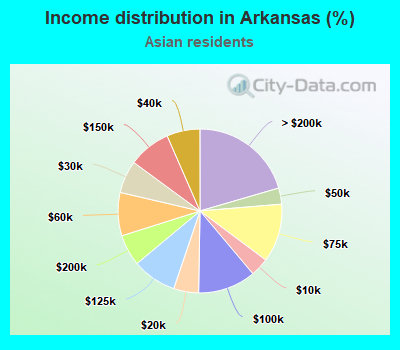
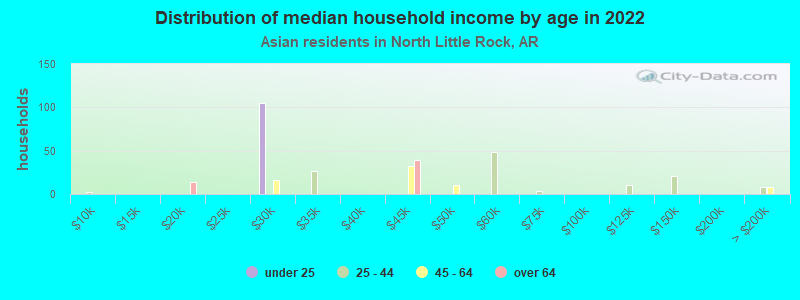
Income statistics for Asian residents
Median household income in North Little Rock, AR in 2022:
North Little Rock:
$58,448
State:
$83,200
Change in median household income between 2000 and 2022:
North Little Rock, Arkansas:
+133.8%
State:
+119.9%
Number of households with income < $10k:
North Little Rock:
0.6% (2)
State:
3.7% (601)
Number of households with income $10k - 20k:
North Little Rock:
4.4% (14)
Arkansas:
4.9% (813)
Number of households with income $20k - 30k:
North Little Rock:
25.4% (80)
State:
6.4% (1,057)
Number of households with income $30k - 40k:
North Little Rock:
7.3% (23)
State:
6.6% (1,077)
Number of households with income $40k - 50k:
North Little Rock:
25.1% (79)
State:
3.2% (523)
Number of households with income $50k - 60k:
North Little Rock:
18.4% (58)
State:
8.5% (1,401)
Number of households with income $60k - 75k:
North Little Rock:
1.6% (5)
Arkansas:
11.5% (1,895)
Number of households with income $75k - 100k:
North Little Rock:
0.0% (0)
Arkansas:
11.4% (1,875)
Number of households with income $100k - 125k:
North Little Rock:
2.2% (7)
Arkansas:
8.7% (1,435)
Number of households with income $125k - 150k:
North Little Rock:
7.9% (25)
State:
8.4% (1,377)
Number of households with income $150k - 200k:
North Little Rock:
0.0% (0)
Arkansas:
6.2% (1,017)
Number of households with income > $200k:
North Little Rock:
7.0% (22)
State:
20.5% (3,371)
Aggregate household income in North Little Rock in 2022: $28,341,965
Median non-family income in North Little Rock in 2022:
North Little Rock:
$29,799
Arkansas:
$59,460
Median per capita income in North Little Rock in 2022:
North Little Rock:
$48,570
Arkansas:
$42,828
Change in median per capita income between 2000 and 2022:
North Little Rock, Arkansas:
+91.4%
Arkansas:
+159.7%
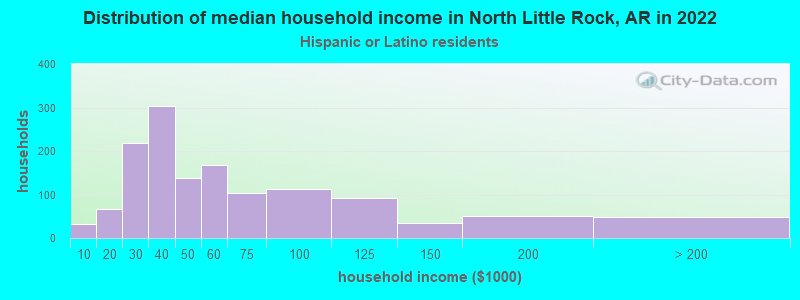
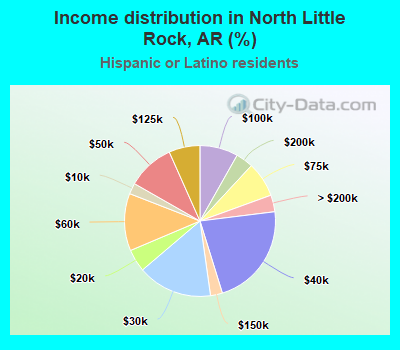
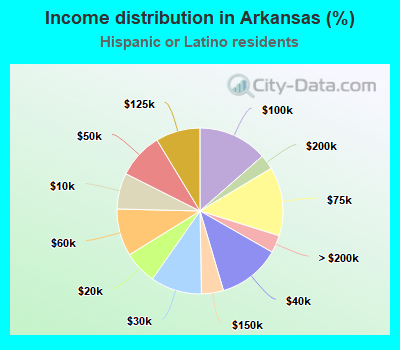
Income statistics for Hispanic or Latino residents
Median household income in North Little Rock, AR in 2022:
North Little Rock:
$39,634
State:
$54,314
Change in median household income between 2000 and 2022:
North Little Rock, Arkansas:
+54.2%
Arkansas:
+92.1%
Number of households with income < $10k:
North Little Rock:
2.3% (32)
State:
7.0% (4,903)
Number of households with income $10k - 20k:
North Little Rock:
4.8% (66)
Arkansas:
6.4% (4,496)
Number of households with income $20k - 30k:
North Little Rock:
16.0% (219)
State:
10.0% (6,963)
Number of households with income $30k - 40k:
North Little Rock:
22.2% (303)
Arkansas:
12.2% (8,492)
Number of households with income $40k - 50k:
North Little Rock:
10.1% (138)
Arkansas:
8.9% (6,213)
Number of households with income $50k - 60k:
North Little Rock:
12.3% (168)
State:
9.2% (6,437)
Number of households with income $60k - 75k:
North Little Rock:
7.5% (103)
Arkansas:
13.4% (9,354)
Number of households with income $75k - 100k:
North Little Rock:
8.2% (112)
State:
13.5% (9,432)
Number of households with income $100k - 125k:
North Little Rock:
6.7% (91)
State:
8.7% (6,040)
Number of households with income $125k - 150k:
North Little Rock:
2.6% (35)
Arkansas:
4.3% (3,001)
Number of households with income $150k - 200k:
North Little Rock:
3.7% (51)
State:
2.9% (2,023)
Number of households with income > $200k:
North Little Rock:
3.6% (49)
State:
3.4% (2,381)
Aggregate household income in North Little Rock in 2022: $80,409,964
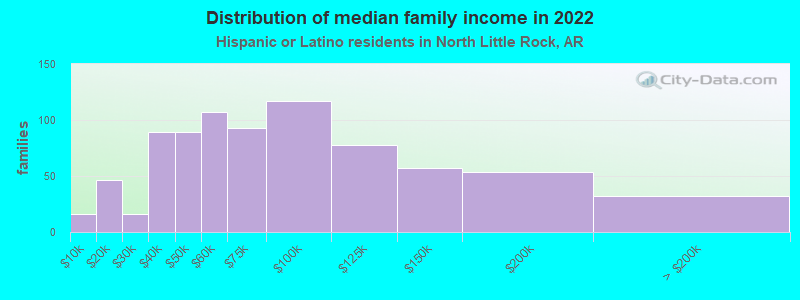
Median family income in North Little Rock in 2022:
North Little Rock:
$53,070
State:
$55,981
Number of families with income < $10k:
North Little Rock:
2.1% (16)
Arkansas:
5.5% (2,876)
Number of families with income $10k - 20k:
North Little Rock:
5.8% (46)
State:
5.9% (3,086)
Number of families with income $20k - 30k:
North Little Rock:
2.1% (16)
Arkansas:
6.4% (3,345)
Number of families with income $30k - 40k:
North Little Rock:
11.2% (89)
State:
13.5% (7,085)
Number of families with income $40k - 50k:
North Little Rock:
11.2% (89)
State:
9.5% (5,021)
Number of families with income $50k - 60k:
North Little Rock:
13.4% (107)
Arkansas:
12.4% (6,552)
Number of families with income $60k - 75k:
North Little Rock:
11.7% (93)
State:
12.2% (6,426)
Number of families with income $75k - 100k:
North Little Rock:
14.7% (117)
State:
12.9% (6,775)
Number of families with income $100k - 125k:
North Little Rock:
9.8% (78)
Arkansas:
8.7% (4,561)
Number of families with income $125k - 150k:
North Little Rock:
7.2% (57)
State:
5.5% (2,880)
Number of families with income $150k - 200k:
North Little Rock:
6.8% (54)
Arkansas:
3.7% (1,972)
Number of families with income > $200k:
North Little Rock:
4.0% (32)
State:
3.9% (2,063)
Median non-family income in North Little Rock in 2022:
North Little Rock:
$22,488
State:
$30,892
Change in median non-family income between 2000 and 2022:: -55.3%
North Little Rock, Arkansas:
-55.3%
Arkansas:
+54.9%
Median per capita income in North Little Rock in 2022:
North Little Rock:
$19,877
Arkansas:
$20,128
Change in median per capita income between 2000 and 2022:
North Little Rock, Arkansas:
+22.4%
State:
+111.4%
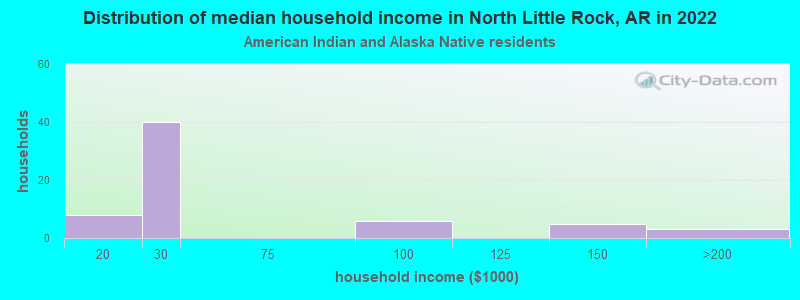
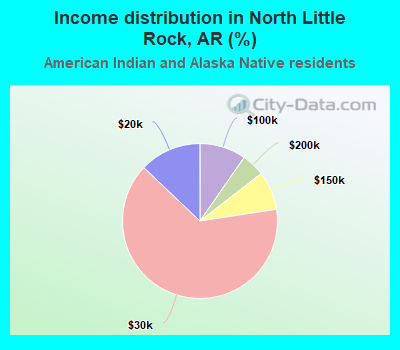
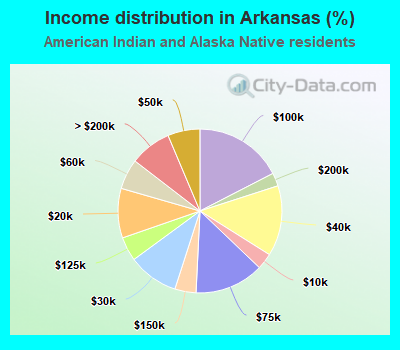
Income statistics for American Indian and Alaska Native residents
Median household income in North Little Rock, AR in 2022:
North Little Rock:
$32,121
Arkansas:
$62,518
Change in median household income between 2000 and 2022:: -14.0%
North Little Rock, Arkansas:
-14.0%
State:
+116.3%
Number of households with income < $10k:
North Little Rock:
0.0% (0)
State:
3.2% (246)
Number of households with income $10k - 20k:
North Little Rock:
12.9% (8)
State:
9.8% (749)
Number of households with income $20k - 30k:
North Little Rock:
64.5% (40)
Arkansas:
10.0% (764)
Number of households with income $30k - 40k:
North Little Rock:
0.0% (0)
State:
13.9% (1,067)
Number of households with income $40k - 50k:
North Little Rock:
0.0% (0)
State:
6.4% (488)
Number of households with income $50k - 60k:
North Little Rock:
0.0% (0)
State:
6.0% (459)
Number of households with income $60k - 75k:
North Little Rock:
0.0% (0)
Arkansas:
13.6% (1,046)
Number of households with income $75k - 100k:
North Little Rock:
9.7% (6)
State:
17.4% (1,337)
Number of households with income $100k - 125k:
North Little Rock:
0.0% (0)
State:
4.8% (365)
Number of households with income $125k - 150k:
North Little Rock:
8.1% (5)
Arkansas:
4.2% (321)
Number of households with income $150k - 200k:
North Little Rock:
4.8% (3)
State:
2.6% (199)
Number of households with income > $200k:
North Little Rock:
0.0% (0)
State:
8.2% (628)
Aggregate household income in North Little Rock in 2022: $4,129,200
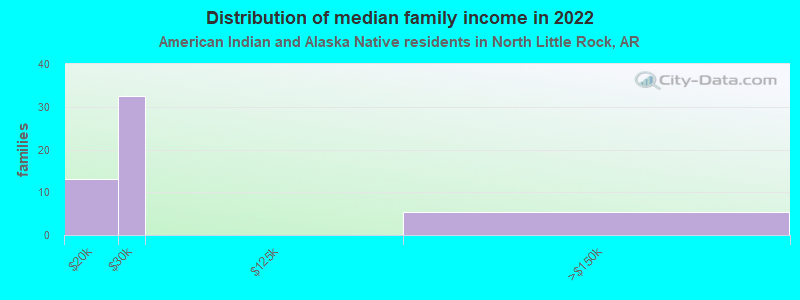
Median family income in North Little Rock in 2022:
North Little Rock:
$26,673
State:
$59,476
Number of families with income $10k - 20k:
North Little Rock:
25.7% (13)
State:
0.7% (40)
Number of families with income $20k - 30k:
North Little Rock:
63.8% (33)
State:
10.3% (592)
Number of families with income $125k - 150k:
North Little Rock:
10.4% (5)
State:
5.6% (321)
Median per capita income in North Little Rock in 2022:
North Little Rock:
$21,934
State:
$22,487
Change in median per capita income between 2000 and 2022:: -44.5%
North Little Rock, Arkansas:
-44.5%
State:
+54.5%
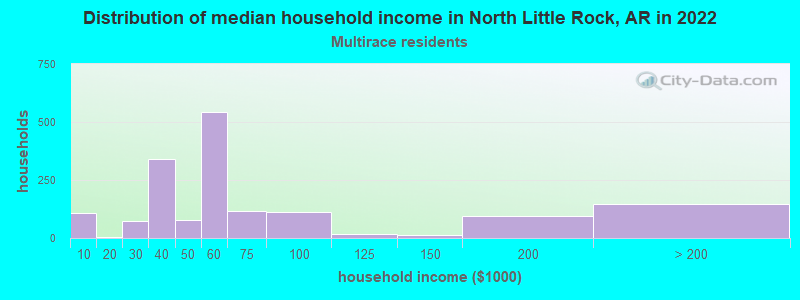
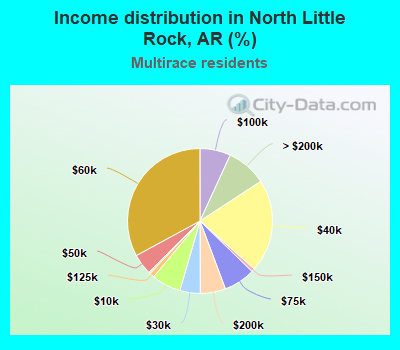
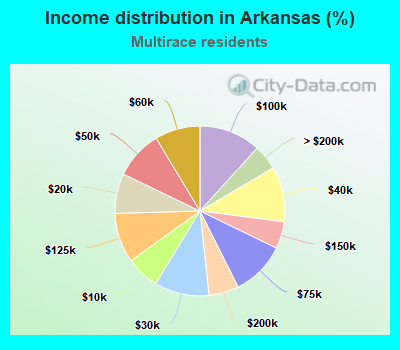
Income statistics for Multirace residents
Median household income in North Little Rock, AR in 2022:
North Little Rock:
$54,166
Arkansas:
$55,609
Change in median household income between 2000 and 2022:
North Little Rock, Arkansas:
+41.3%
State:
+111.0%
Number of households with income < $10k:
North Little Rock:
6.5% (108)
State:
6.3% (6,303)
Number of households with income $10k - 20k:
North Little Rock:
0.4% (6)
Arkansas:
7.6% (7,548)
Number of households with income $20k - 30k:
North Little Rock:
4.5% (75)
State:
10.4% (10,340)
Number of households with income $30k - 40k:
North Little Rock:
20.7% (342)
State:
10.5% (10,444)
Number of households with income $40k - 50k:
North Little Rock:
4.6% (76)
State:
9.2% (9,176)
Number of households with income $50k - 60k:
North Little Rock:
32.9% (543)
State:
8.6% (8,560)
Number of households with income $60k - 75k:
North Little Rock:
7.0% (116)
State:
10.4% (10,351)
Number of households with income $75k - 100k:
North Little Rock:
6.8% (113)
State:
11.7% (11,670)
Number of households with income $100k - 125k:
North Little Rock:
1.1% (18)
Arkansas:
9.5% (9,424)
Number of households with income $125k - 150k:
North Little Rock:
0.7% (12)
Arkansas:
5.2% (5,120)
Number of households with income $150k - 200k:
North Little Rock:
5.6% (93)
State:
5.7% (5,665)
Number of households with income > $200k:
North Little Rock:
9.0% (148)
State:
4.8% (4,770)
Aggregate household income in North Little Rock in 2022: $161,566,448
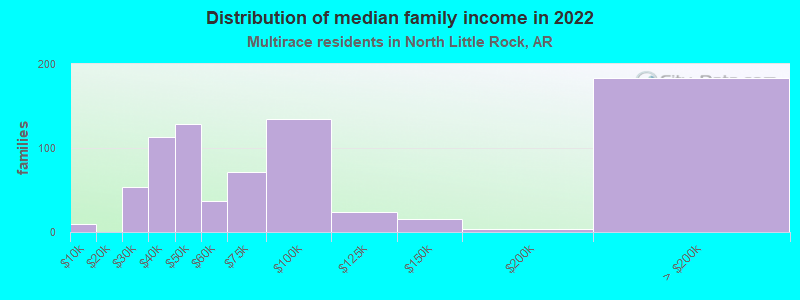
Median family income in North Little Rock in 2022:
North Little Rock:
$46,896
Arkansas:
$63,446
Number of families with income < $10k:
North Little Rock:
1.3% (10)
Arkansas:
4.6% (3,122)
Number of families with income $20k - 30k:
North Little Rock:
6.9% (53)
State:
7.8% (5,322)
Number of families with income $30k - 40k:
North Little Rock:
14.7% (113)
State:
11.6% (7,938)
Number of families with income $40k - 50k:
North Little Rock:
16.5% (128)
State:
9.9% (6,783)
Number of families with income $50k - 60k:
North Little Rock:
4.7% (37)
State:
9.0% (6,141)
Number of families with income $60k - 75k:
North Little Rock:
9.3% (72)
State:
10.6% (7,239)
Number of families with income $75k - 100k:
North Little Rock:
17.5% (135)
State:
13.0% (8,908)
Number of families with income $100k - 125k:
North Little Rock:
3.1% (24)
State:
11.1% (7,614)
Number of families with income $125k - 150k:
North Little Rock:
1.9% (15)
State:
5.8% (3,999)
Number of families with income $150k - 200k:
North Little Rock:
0.5% (4)
Arkansas:
6.9% (4,711)
Number of families with income > $200k:
North Little Rock:
23.7% (183)
State:
4.8% (3,292)
Median non-family income in North Little Rock in 2022:
North Little Rock:
$51,379
State:
$34,567
Change in median non-family income between 2000 and 2022:
North Little Rock, Arkansas:
+90.6%
State:
+115.4%
Median per capita income in North Little Rock in 2022:
North Little Rock:
$20,278
Arkansas:
$23,635
Change in median per capita income between 2000 and 2022:
North Little Rock, Arkansas:
+22.9%
State:
+103.6%
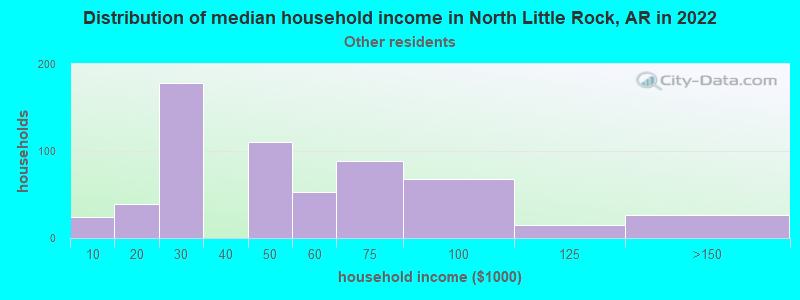
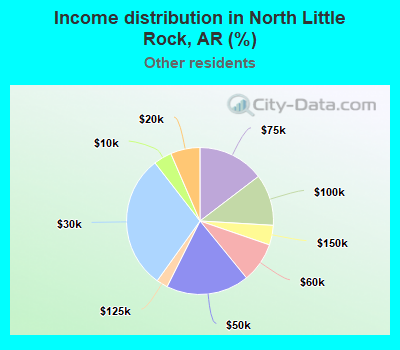
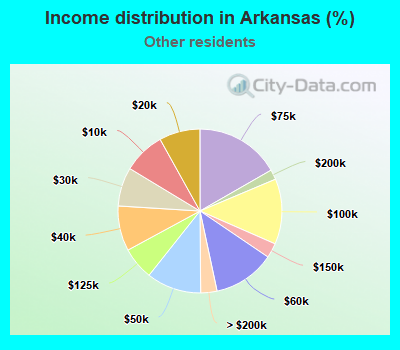
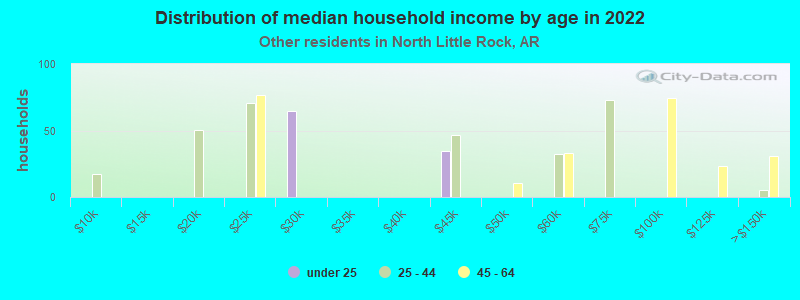
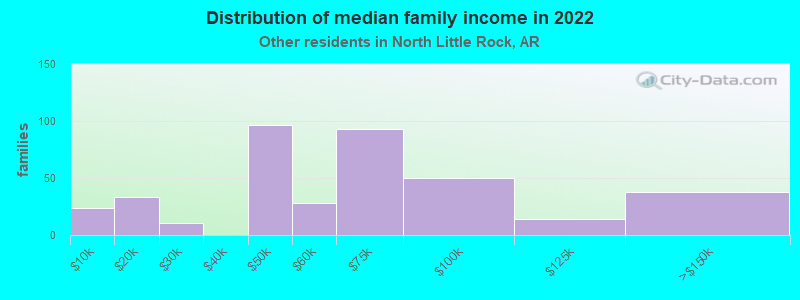
Income statistics for other residents
Median household income in North Little Rock, AR in 2022:
North Little Rock:
$36,387
State:
$53,528
Number of households with income < $10k:
North Little Rock:
4.0% (24)
Arkansas:
8.3% (2,184)
Number of households with income $10k - 20k:
North Little Rock:
6.5% (39)
Arkansas:
8.1% (2,135)
Number of households with income $20k - 30k:
North Little Rock:
29.6% (178)
State:
7.7% (2,025)
Number of households with income $30k - 40k:
North Little Rock:
0.0% (0)
Arkansas:
8.9% (2,350)
Number of households with income $40k - 50k:
North Little Rock:
18.3% (110)
State:
10.8% (2,857)
Number of households with income $50k - 60k:
North Little Rock:
8.8% (53)
Arkansas:
12.2% (3,220)
Number of households with income $60k - 75k:
North Little Rock:
14.6% (88)
Arkansas:
16.7% (4,415)
Number of households with income $75k - 100k:
North Little Rock:
11.3% (68)
State:
12.9% (3,411)
Number of households with income $100k - 125k:
North Little Rock:
2.5% (15)
Arkansas:
6.4% (1,697)
Number of households with income $125k - 150k:
North Little Rock:
4.3% (26)
State:
2.9% (768)
Number of households with income $150k - 200k:
North Little Rock:
0.0% (0)
Arkansas:
2.0% (520)
Number of households with income > $200k:
North Little Rock:
0.0% (0)
State:
3.2% (847)
Aggregate household income in North Little Rock in 2022: $25,767,333
Median family income in North Little Rock in 2022:
North Little Rock:
$54,444
Arkansas:
$56,675
Number of families with income < $10k:
North Little Rock:
6.0% (23)
State:
6.4% (1,280)
Number of families with income $10k - 20k:
North Little Rock:
8.7% (34)
Arkansas:
6.9% (1,384)
Number of families with income $20k - 30k:
North Little Rock:
2.6% (10)
State:
3.4% (688)
Number of families with income $40k - 50k:
North Little Rock:
25.1% (97)
State:
11.0% (2,197)
Number of families with income $50k - 60k:
North Little Rock:
7.2% (28)
State:
14.6% (2,908)
Number of families with income $60k - 75k:
North Little Rock:
24.1% (93)
State:
18.7% (3,735)
Number of families with income $75k - 100k:
North Little Rock:
12.9% (50)
State:
11.1% (2,206)
Number of families with income $100k - 125k:
North Little Rock:
3.6% (14)
Arkansas:
6.6% (1,326)
Number of families with income $125k - 150k:
North Little Rock:
9.9% (38)
State:
3.8% (768)
Median non-family income in North Little Rock in 2022:
North Little Rock:
$19,306
State:
$28,137
Change in median non-family income between 2000 and 2022:: -61.9%
North Little Rock, Arkansas:
-61.9%
Arkansas:
+35.2%
Median per capita income in North Little Rock in 2022:
North Little Rock:
$16,434
State:
$20,131
Change in median per capita income between 2000 and 2022:
North Little Rock, Arkansas:
+46.3%
State:
+128.6%
Discuss North Little Rock, Arkansas (AR) on our hugely popular Arkansas forum.