The median household income in North Lynnwood, WA in 2022 was $87,739, which was 4.1% less than the median annual income of $91,306 across the entire state of Washington. Compared to the median income of $53,060 in 2000 this represents an increase of 39.5%. The per capita income in 2022 was $44,311, which means an increase of 47.2% compared to 2000 when it was $23,417.
Whole page based on the data from 2000 / 2022 when the population of North Lynnwood, Washington was 16,574 / 24,579
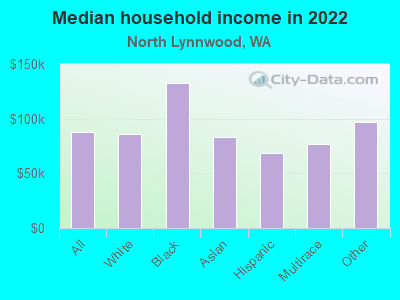
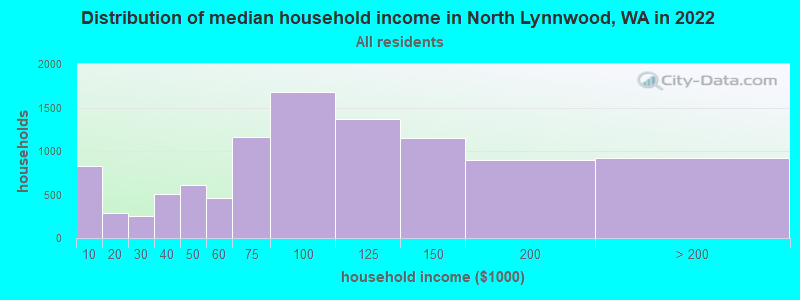
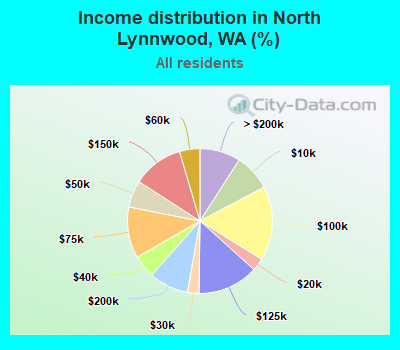
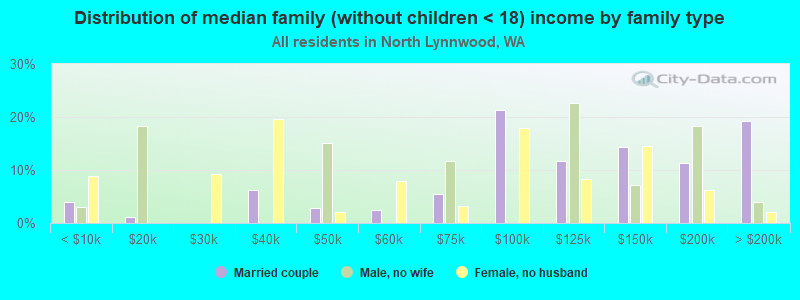
Income statistics for all residents
Median household income in North Lynnwood, WA in 2022:
North Lynnwood:
$87,740
State:
$91,306
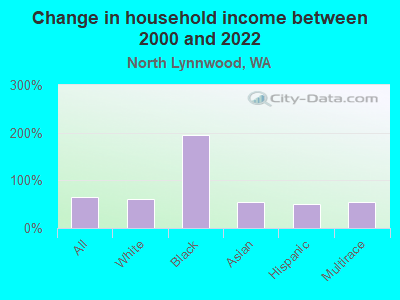
Change in median household income between 2000 and 2022:
North Lynnwood, Washington:
+65.4%
Washington:
+99.5%
Number of households with income < $10k:
North Lynnwood:
8.2% (829)
State:
4.5% (139,331)
Number of households with income $10k - 20k:
North Lynnwood:
2.8% (283)
State:
5.0% (154,508)
Number of households with income $20k - 30k:
North Lynnwood:
2.6% (258)
Washington:
5.4% (166,555)
Number of households with income $30k - 40k:
North Lynnwood:
5.0% (510)
Washington:
5.5% (170,324)
Number of households with income $40k - 50k:
North Lynnwood:
6.0% (606)
State:
6.0% (183,941)
Number of households with income $50k - 60k:
North Lynnwood:
4.6% (460)
State:
6.1% (187,395)
Number of households with income $60k - 75k:
North Lynnwood:
11.4% (1,156)
State:
8.7% (266,771)
Number of households with income $75k - 100k:
North Lynnwood:
16.6% (1,676)
State:
13.1% (404,672)
Number of households with income $100k - 125k:
North Lynnwood:
13.6% (1,370)
State:
11.0% (337,911)
Number of households with income $125k - 150k:
North Lynnwood:
11.3% (1,144)
Washington:
8.0% (244,934)
Number of households with income $150k - 200k:
North Lynnwood:
8.8% (892)
State:
10.5% (323,812)
Number of households with income > $200k:
North Lynnwood:
9.1% (917)
Washington:
16.2% (499,799)
Aggregate household income in North Lynnwood in 2022: $1,064,475,489
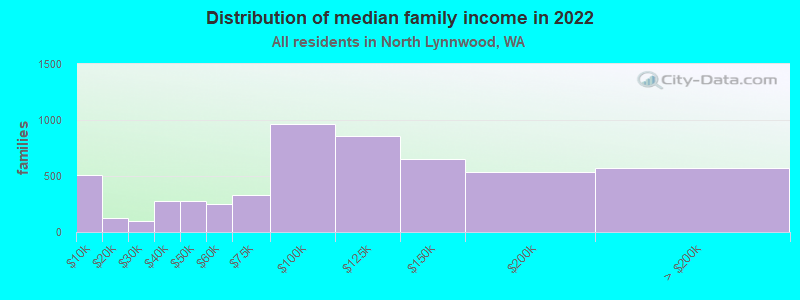
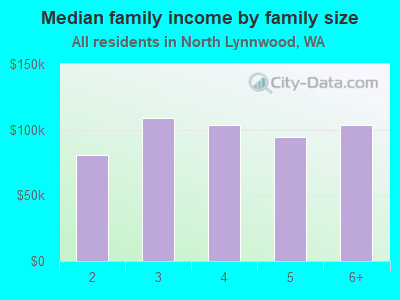
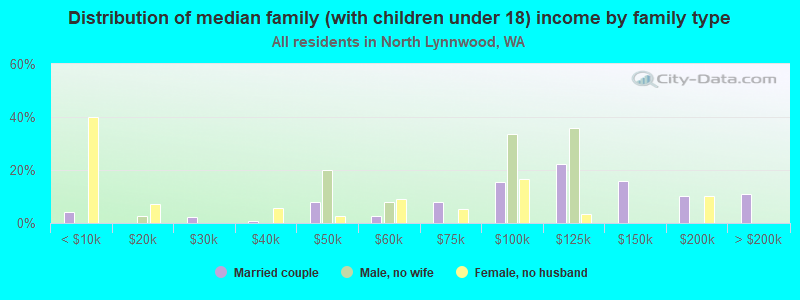
Median family income in North Lynnwood in 2022:
North Lynnwood:
$103,534
State:
$109,192
Number of families with income < $10k:
North Lynnwood:
9.4% (513)
Washington:
2.9% (55,953)
Number of families with income $10k - 20k:
North Lynnwood:
2.2% (122)
State:
2.6% (50,138)
Number of families with income $20k - 30k:
North Lynnwood:
1.7% (95)
State:
3.2% (61,974)
Number of families with income $30k - 40k:
North Lynnwood:
5.0% (274)
State:
4.1% (80,240)
Number of families with income $40k - 50k:
North Lynnwood:
5.1% (276)
State:
4.9% (94,310)
Number of families with income $50k - 60k:
North Lynnwood:
4.6% (251)
State:
5.3% (101,674)
Number of families with income $60k - 75k:
North Lynnwood:
6.1% (329)
State:
8.2% (158,348)
Number of families with income $75k - 100k:
North Lynnwood:
17.7% (965)
State:
13.8% (267,812)
Number of families with income $100k - 125k:
North Lynnwood:
15.7% (855)
State:
12.4% (240,213)
Number of families with income $125k - 150k:
North Lynnwood:
12.0% (652)
State:
9.3% (180,011)
Number of families with income $150k - 200k:
North Lynnwood:
9.8% (532)
State:
13.0% (250,874)
Number of families with income > $200k:
North Lynnwood:
10.5% (573)
State:
20.4% (393,898)
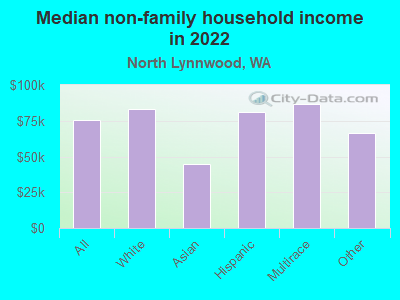
Median non-family income in North Lynnwood in 2022:
North Lynnwood:
$75,176
Washington:
$57,299
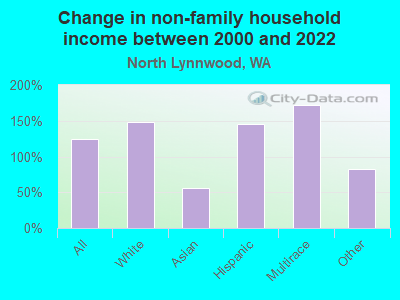
Change in median non-family income between 2000 and 2022:
North Lynnwood, Washington:
+125.2%
State:
+94.9%
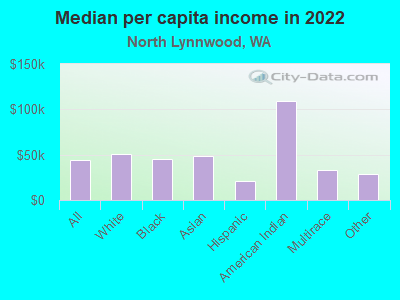
Median per capita income in North Lynnwood in 2022:
North Lynnwood:
$44,312
State:
$50,764
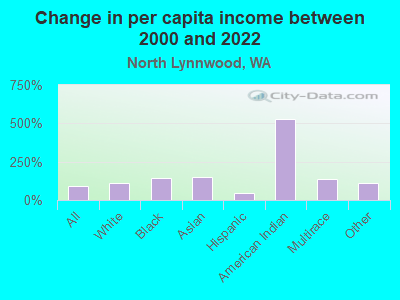
Change in median per capita income between 2000 and 2022:
North Lynnwood, Washington:
+89.2%
State:
+121.0%
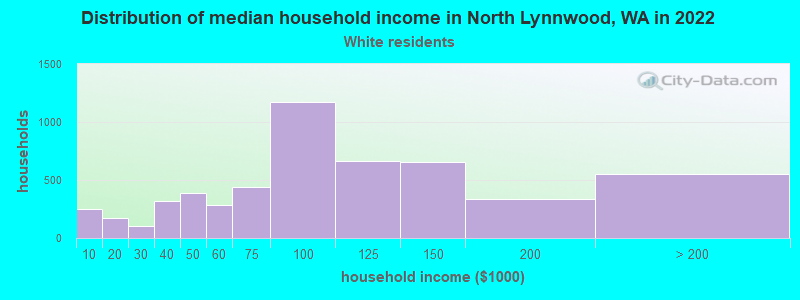
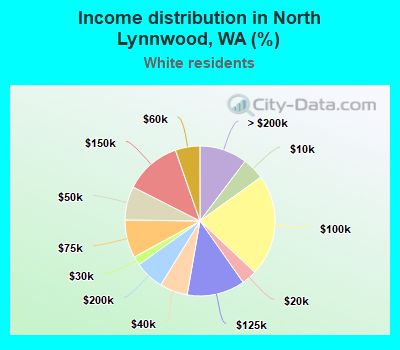
Income statistics for White residents
Median household income in North Lynnwood, WA in 2022:
North Lynnwood:
$86,147
Washington:
$91,916
Change in median household income between 2000 and 2022:
North Lynnwood, Washington:
+60.5%
Washington:
+95.4%
Number of households with income < $10k:
North Lynnwood:
4.7% (254)
State:
4.3% (95,850)
Number of households with income $10k - 20k:
North Lynnwood:
3.3% (175)
State:
4.8% (106,421)
Number of households with income $20k - 30k:
North Lynnwood:
1.9% (101)
State:
5.5% (122,860)
Number of households with income $30k - 40k:
North Lynnwood:
6.0% (322)
State:
5.4% (119,627)
Number of households with income $40k - 50k:
North Lynnwood:
7.3% (388)
State:
5.9% (132,276)
Number of households with income $50k - 60k:
North Lynnwood:
5.3% (284)
State:
6.1% (136,212)
Number of households with income $60k - 75k:
North Lynnwood:
8.2% (439)
State:
8.8% (196,086)
Number of households with income $75k - 100k:
North Lynnwood:
21.9% (1,173)
Washington:
13.4% (299,192)
Number of households with income $100k - 125k:
North Lynnwood:
12.5% (668)
State:
11.3% (252,209)
Number of households with income $125k - 150k:
North Lynnwood:
12.2% (653)
Washington:
7.9% (175,962)
Number of households with income $150k - 200k:
North Lynnwood:
6.4% (340)
State:
10.7% (239,156)
Number of households with income > $200k:
North Lynnwood:
10.3% (551)
State:
16.1% (359,917)
Aggregate household income in North Lynnwood in 2022: $566,576,228
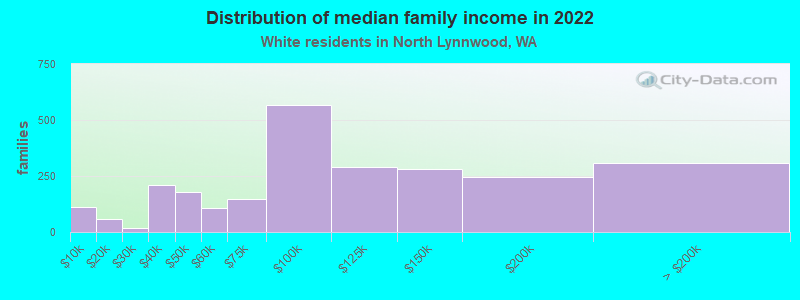
Median family income in North Lynnwood in 2022:
North Lynnwood:
$91,231
State:
$112,511
Number of families with income < $10k:
North Lynnwood:
4.4% (110)
State:
2.4% (33,676)
Number of families with income $10k - 20k:
North Lynnwood:
2.2% (56)
Washington:
2.0% (28,228)
Number of families with income $20k - 30k:
North Lynnwood:
0.6% (16)
State:
2.9% (39,288)
Number of families with income $30k - 40k:
North Lynnwood:
8.3% (209)
State:
3.6% (50,190)
Number of families with income $40k - 50k:
North Lynnwood:
7.0% (177)
Washington:
4.6% (63,009)
Number of families with income $50k - 60k:
North Lynnwood:
4.2% (106)
State:
5.0% (69,270)
Number of families with income $60k - 75k:
North Lynnwood:
5.9% (149)
Washington:
8.2% (112,369)
Number of families with income $75k - 100k:
North Lynnwood:
22.6% (569)
Washington:
14.1% (194,214)
Number of families with income $100k - 125k:
North Lynnwood:
11.5% (290)
State:
13.2% (182,184)
Number of families with income $125k - 150k:
North Lynnwood:
11.2% (281)
State:
9.5% (130,928)
Number of families with income $150k - 200k:
North Lynnwood:
9.7% (245)
State:
13.7% (188,621)
Number of families with income > $200k:
North Lynnwood:
12.2% (308)
State:
20.8% (285,982)
Median non-family income in North Lynnwood in 2022:
North Lynnwood:
$83,428
State:
$56,103
Change in median non-family income between 2000 and 2022:
North Lynnwood, Washington:
+148.5%
Washington:
+87.7%
Median per capita income in North Lynnwood in 2022:
North Lynnwood:
$50,935
State:
$55,212
Change in median per capita income between 2000 and 2022:
North Lynnwood, Washington:
+107.7%
State:
+123.8%
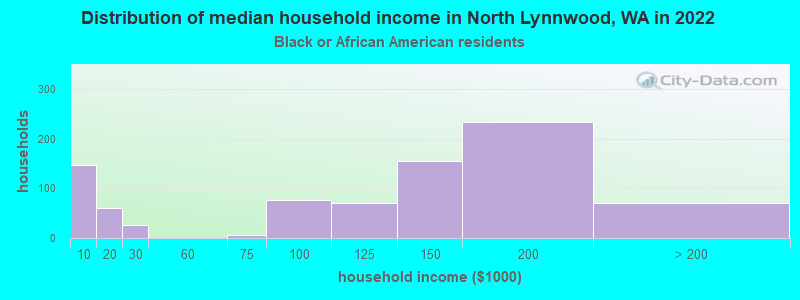
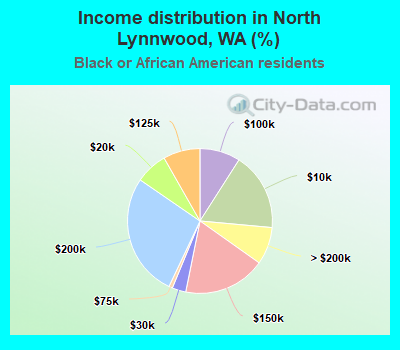
Income statistics for Black or African American residents
Median household income in North Lynnwood, WA in 2022:
North Lynnwood:
$132,947
Washington:
$68,202
Number of households with income < $10k:
North Lynnwood:
17.4% (148)
State:
7.2% (8,014)
Number of households with income $10k - 20k:
North Lynnwood:
7.2% (61)
Washington:
8.0% (8,904)
Number of households with income $20k - 30k:
North Lynnwood:
3.1% (26)
Washington:
7.4% (8,207)
Number of households with income $30k - 40k:
North Lynnwood:
0.0% (0)
Washington:
5.6% (6,220)
Number of households with income $40k - 50k:
North Lynnwood:
0.0% (0)
State:
9.5% (10,585)
Number of households with income $50k - 60k:
North Lynnwood:
0.0% (0)
State:
7.3% (8,078)
Number of households with income $60k - 75k:
North Lynnwood:
0.8% (7)
Washington:
8.7% (9,704)
Number of households with income $75k - 100k:
North Lynnwood:
9.1% (77)
State:
12.9% (14,315)
Number of households with income $100k - 125k:
North Lynnwood:
8.2% (70)
State:
7.7% (8,592)
Number of households with income $125k - 150k:
North Lynnwood:
18.4% (156)
Washington:
8.9% (9,840)
Number of households with income $150k - 200k:
North Lynnwood:
27.5% (234)
State:
7.6% (8,434)
Number of households with income > $200k:
North Lynnwood:
8.4% (71)
State:
9.1% (10,075)
Aggregate household income in North Lynnwood in 2022: $81,461,784
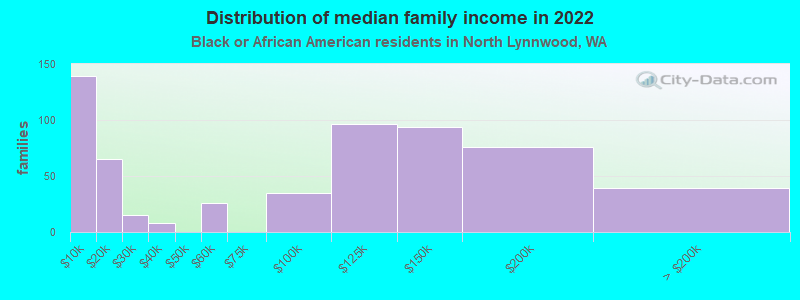
Median family income in North Lynnwood in 2022:
North Lynnwood:
$120,954
State:
$82,165
Number of families with income < $10k:
North Lynnwood:
23.4% (139)
State:
5.5% (3,709)
Number of families with income $10k - 20k:
North Lynnwood:
11.0% (65)
State:
7.4% (4,951)
Number of families with income $20k - 30k:
North Lynnwood:
2.6% (15)
State:
4.7% (3,151)
Number of families with income $30k - 40k:
North Lynnwood:
1.3% (8)
State:
5.3% (3,525)
Number of families with income $50k - 60k:
North Lynnwood:
4.4% (26)
State:
7.0% (4,687)
Number of families with income $75k - 100k:
North Lynnwood:
5.9% (35)
Washington:
14.8% (9,876)
Number of families with income $100k - 125k:
North Lynnwood:
16.1% (96)
Washington:
9.0% (6,018)
Number of families with income $125k - 150k:
North Lynnwood:
15.8% (94)
State:
9.5% (6,348)
Number of families with income $150k - 200k:
North Lynnwood:
12.9% (76)
State:
8.6% (5,737)
Number of families with income > $200k:
North Lynnwood:
6.6% (39)
State:
12.0% (8,041)
Median per capita income in North Lynnwood in 2022:
North Lynnwood:
$45,498
State:
$38,209
Change in median per capita income between 2000 and 2022:
North Lynnwood, Washington:
+142.3%
State:
+115.3%
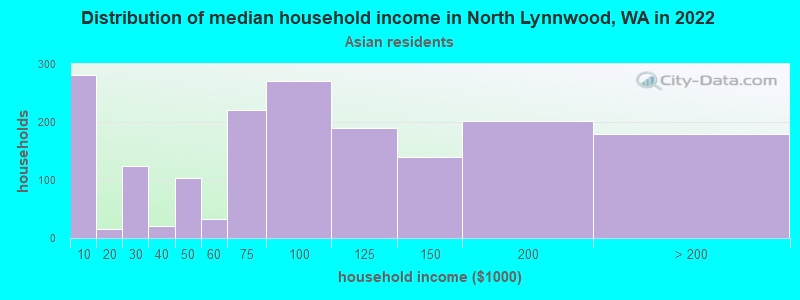
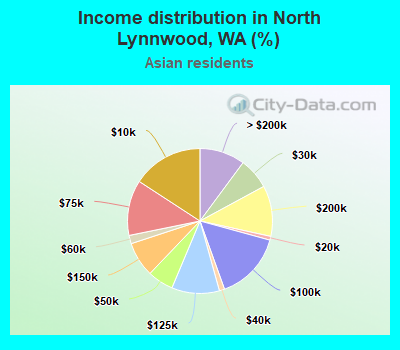
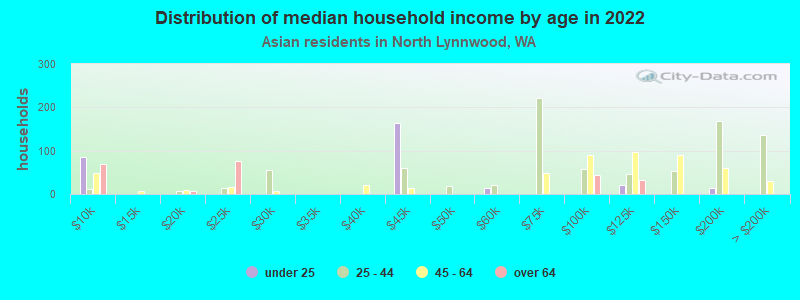
Income statistics for Asian residents
Median household income in North Lynnwood, WA in 2022:
North Lynnwood:
$82,987
State:
$125,692
Change in median household income between 2000 and 2022:
North Lynnwood, Washington:
+54.3%
State:
+164.5%
Number of households with income < $10k:
North Lynnwood:
15.8% (281)
State:
4.9% (14,099)
Number of households with income $10k - 20k:
North Lynnwood:
0.8% (15)
State:
3.5% (9,873)
Number of households with income $20k - 30k:
North Lynnwood:
7.0% (124)
State:
2.9% (8,352)
Number of households with income $30k - 40k:
North Lynnwood:
1.2% (21)
State:
4.0% (11,415)
Number of households with income $40k - 50k:
North Lynnwood:
5.8% (103)
State:
4.0% (11,421)
Number of households with income $50k - 60k:
North Lynnwood:
1.9% (33)
State:
4.2% (12,100)
Number of households with income $60k - 75k:
North Lynnwood:
12.4% (220)
State:
6.3% (17,903)
Number of households with income $75k - 100k:
North Lynnwood:
15.3% (271)
Washington:
10.4% (29,663)
Number of households with income $100k - 125k:
North Lynnwood:
10.6% (189)
State:
9.4% (26,839)
Number of households with income $125k - 150k:
North Lynnwood:
7.8% (139)
State:
8.5% (24,200)
Number of households with income $150k - 200k:
North Lynnwood:
11.3% (201)
State:
12.6% (35,976)
Number of households with income > $200k:
North Lynnwood:
10.1% (180)
Washington:
29.2% (83,109)
Aggregate household income in North Lynnwood in 2022: $207,884,609
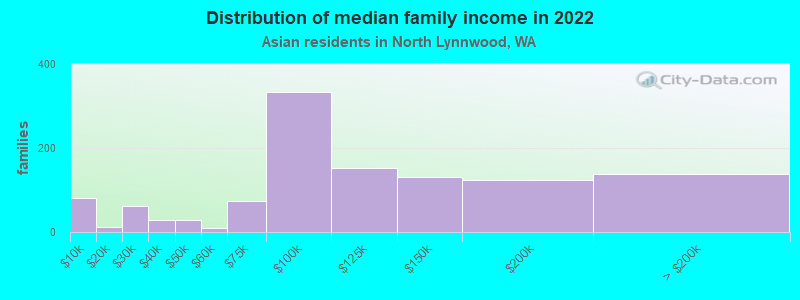
Median family income in North Lynnwood in 2022:
North Lynnwood:
$97,662
Washington:
$143,595
Number of families with income < $10k:
North Lynnwood:
7.0% (82)
State:
2.9% (5,479)
Number of families with income $10k - 20k:
North Lynnwood:
1.0% (11)
Washington:
2.2% (4,150)
Number of families with income $20k - 30k:
North Lynnwood:
5.2% (61)
State:
1.9% (3,558)
Number of families with income $30k - 40k:
North Lynnwood:
2.4% (28)
State:
3.1% (5,734)
Number of families with income $40k - 50k:
North Lynnwood:
2.4% (28)
Washington:
3.6% (6,707)
Number of families with income $50k - 60k:
North Lynnwood:
0.8% (9)
Washington:
4.1% (7,663)
Number of families with income $60k - 75k:
North Lynnwood:
6.2% (73)
State:
5.1% (9,490)
Number of families with income $75k - 100k:
North Lynnwood:
28.5% (334)
Washington:
11.7% (21,919)
Number of families with income $100k - 125k:
North Lynnwood:
13.0% (152)
Washington:
9.3% (17,280)
Number of families with income $125k - 150k:
North Lynnwood:
11.2% (132)
State:
8.4% (15,602)
Number of families with income $150k - 200k:
North Lynnwood:
10.5% (123)
Washington:
13.3% (24,789)
Number of families with income > $200k:
North Lynnwood:
11.7% (137)
State:
34.4% (64,250)
Median non-family income in North Lynnwood in 2022:
North Lynnwood:
$44,556
Washington:
$84,971
Change in median non-family income between 2000 and 2022:
North Lynnwood, Washington:
+55.6%
Washington:
+211.1%
Median per capita income in North Lynnwood in 2022:
North Lynnwood:
$48,386
Washington:
$67,666
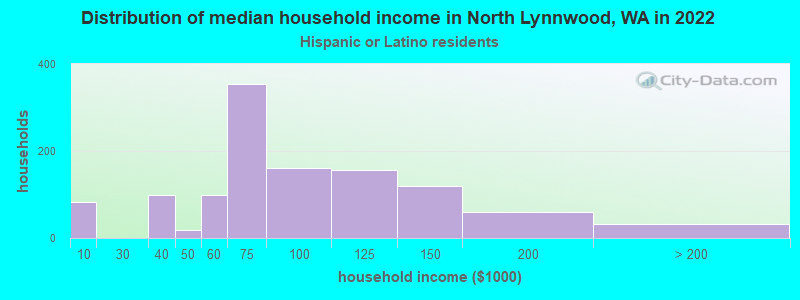
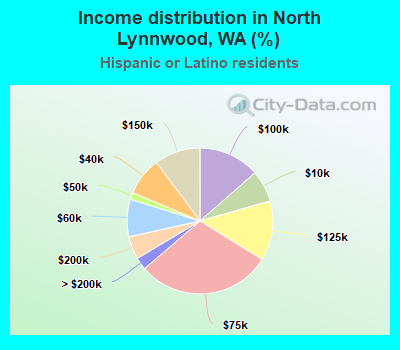
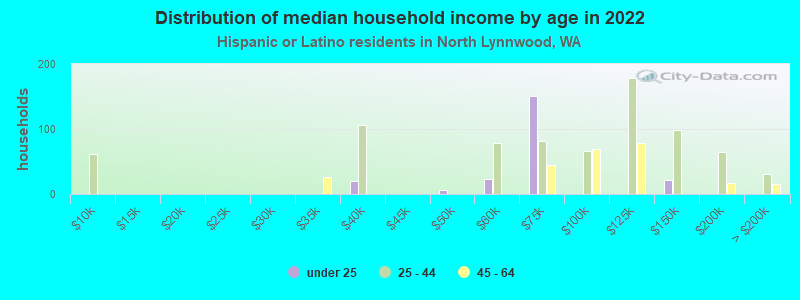
Income statistics for Hispanic or Latino residents
Median household income in North Lynnwood, WA in 2022:
North Lynnwood:
$68,454
State:
$74,770
Change in median household income between 2000 and 2022:
North Lynnwood, Washington:
+49.8%
State:
+128.3%
Number of households with income < $10k:
North Lynnwood:
7.0% (83)
Washington:
4.9% (14,456)
Number of households with income $10k - 20k:
North Lynnwood:
0.0% (0)
Washington:
5.3% (15,449)
Number of households with income $20k - 30k:
North Lynnwood:
0.0% (0)
Washington:
6.8% (20,016)
Number of households with income $30k - 40k:
North Lynnwood:
8.5% (100)
State:
7.7% (22,548)
Number of households with income $40k - 50k:
North Lynnwood:
1.5% (18)
Washington:
7.3% (21,450)
Number of households with income $50k - 60k:
North Lynnwood:
8.3% (98)
State:
7.7% (22,744)
Number of households with income $60k - 75k:
North Lynnwood:
29.9% (353)
Washington:
10.5% (30,737)
Number of households with income $75k - 100k:
North Lynnwood:
13.6% (160)
State:
14.9% (43,843)
Number of households with income $100k - 125k:
North Lynnwood:
13.2% (156)
State:
11.1% (32,554)
Number of households with income $125k - 150k:
North Lynnwood:
10.2% (120)
State:
7.4% (21,624)
Number of households with income $150k - 200k:
North Lynnwood:
5.1% (60)
State:
7.3% (21,360)
Number of households with income > $200k:
North Lynnwood:
2.7% (32)
State:
9.2% (27,055)
Aggregate household income in North Lynnwood in 2022: $97,937,868
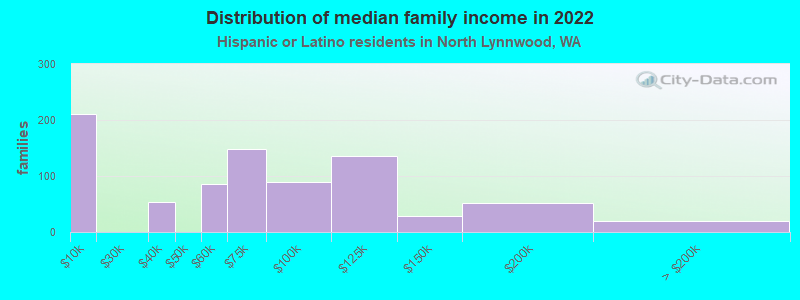
Median family income in North Lynnwood in 2022:
North Lynnwood:
$65,014
Washington:
$76,866
Number of families with income < $10k:
North Lynnwood:
25.5% (210)
State:
4.4% (9,443)
Number of families with income $30k - 40k:
North Lynnwood:
6.6% (54)
State:
8.3% (17,803)
Number of families with income $50k - 60k:
North Lynnwood:
10.5% (86)
Washington:
7.9% (16,852)
Number of families with income $60k - 75k:
North Lynnwood:
18.1% (149)
Washington:
11.4% (24,342)
Number of families with income $75k - 100k:
North Lynnwood:
10.8% (89)
State:
14.4% (30,698)
Number of families with income $100k - 125k:
North Lynnwood:
16.4% (135)
Washington:
11.4% (24,331)
Number of families with income $125k - 150k:
North Lynnwood:
3.5% (29)
State:
7.5% (16,099)
Number of families with income $150k - 200k:
North Lynnwood:
6.3% (52)
Washington:
8.2% (17,551)
Number of families with income > $200k:
North Lynnwood:
2.3% (19)
State:
9.7% (20,653)
Median non-family income in North Lynnwood in 2022:
North Lynnwood:
$81,043
State:
$54,173
Change in median non-family income between 2000 and 2022:
North Lynnwood, Washington:
+145.3%
State:
+105.8%
Median per capita income in North Lynnwood in 2022:
North Lynnwood:
$21,268
Washington:
$28,252
Change in median per capita income between 2000 and 2022:
North Lynnwood, Washington:
+44.3%
State:
+150.2%
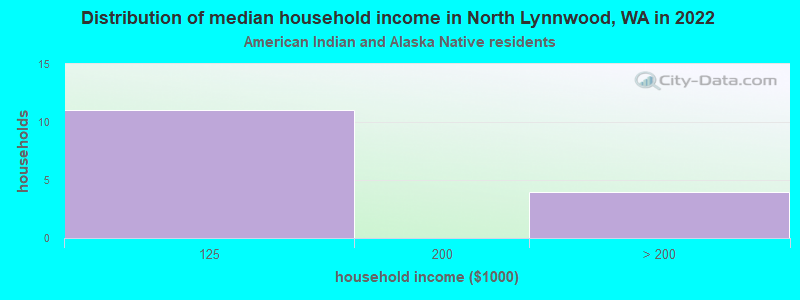
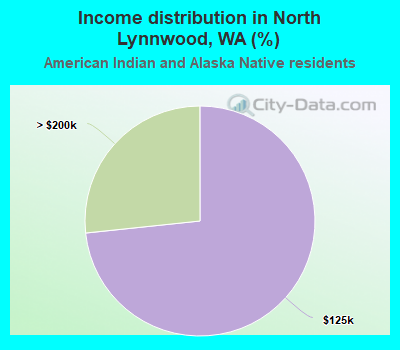
Income statistics for American Indian and Alaska Native residents
Number of households with income < $10k:
North Lynnwood:
0.0% (0)
Washington:
5.9% (1,768)
Number of households with income $10k - 20k:
North Lynnwood:
0.0% (0)
State:
8.9% (2,694)
Number of households with income $20k - 30k:
North Lynnwood:
0.0% (0)
Washington:
8.0% (2,412)
Number of households with income $30k - 40k:
North Lynnwood:
0.0% (0)
State:
7.7% (2,327)
Number of households with income $40k - 50k:
North Lynnwood:
0.0% (0)
Washington:
5.8% (1,755)
Number of households with income $50k - 60k:
North Lynnwood:
0.0% (0)
State:
7.5% (2,259)
Number of households with income $60k - 75k:
North Lynnwood:
0.0% (0)
Washington:
8.8% (2,669)
Number of households with income $75k - 100k:
North Lynnwood:
0.0% (0)
Washington:
12.8% (3,861)
Number of households with income $100k - 125k:
North Lynnwood:
73.3% (11)
Washington:
12.0% (3,618)
Number of households with income $125k - 150k:
North Lynnwood:
0.0% (0)
Washington:
8.6% (2,580)
Number of households with income $150k - 200k:
North Lynnwood:
0.0% (0)
Washington:
5.9% (1,774)
Number of households with income > $200k:
North Lynnwood:
26.7% (4)
State:
8.1% (2,447)
Aggregate household income in North Lynnwood in 2022: $16,391,754
Median per capita income in North Lynnwood in 2022:
North Lynnwood:
$109,209
Washington:
$27,053
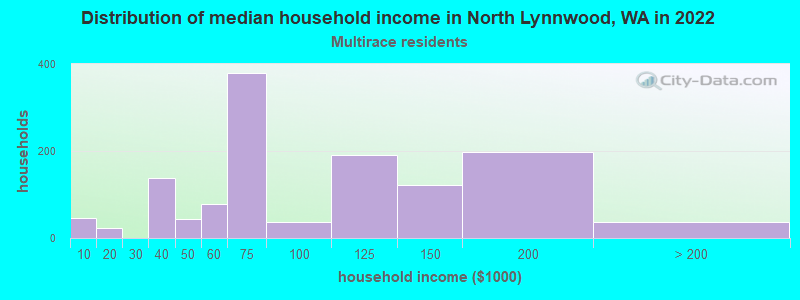
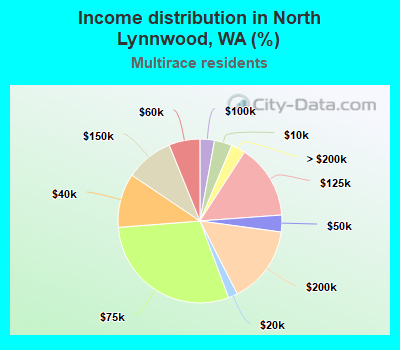
Income statistics for Multirace residents
Median household income in North Lynnwood, WA in 2022:
North Lynnwood:
$76,652
Washington:
$84,303
Change in median household income between 2000 and 2022:
North Lynnwood, Washington:
+53.9%
Washington:
+125.7%
Number of households with income < $10k:
North Lynnwood:
3.5% (45)
Washington:
4.3% (12,040)
Number of households with income $10k - 20k:
North Lynnwood:
1.9% (24)
State:
6.6% (18,437)
Number of households with income $20k - 30k:
North Lynnwood:
0.0% (0)
State:
5.2% (14,559)
Number of households with income $30k - 40k:
North Lynnwood:
10.7% (138)
State:
6.7% (18,491)
Number of households with income $40k - 50k:
North Lynnwood:
3.3% (43)
Washington:
6.3% (17,459)
Number of households with income $50k - 60k:
North Lynnwood:
6.1% (79)
Washington:
6.9% (19,086)
Number of households with income $60k - 75k:
North Lynnwood:
29.4% (380)
Washington:
9.1% (25,310)
Number of households with income $75k - 100k:
North Lynnwood:
2.9% (37)
State:
13.5% (37,493)
Number of households with income $100k - 125k:
North Lynnwood:
14.7% (190)
Washington:
10.7% (29,626)
Number of households with income $125k - 150k:
North Lynnwood:
9.4% (122)
State:
8.6% (23,899)
Number of households with income $150k - 200k:
North Lynnwood:
15.3% (198)
Washington:
10.2% (28,214)
Number of households with income > $200k:
North Lynnwood:
2.8% (36)
State:
11.9% (32,947)
Aggregate household income in North Lynnwood in 2022: $115,962,022
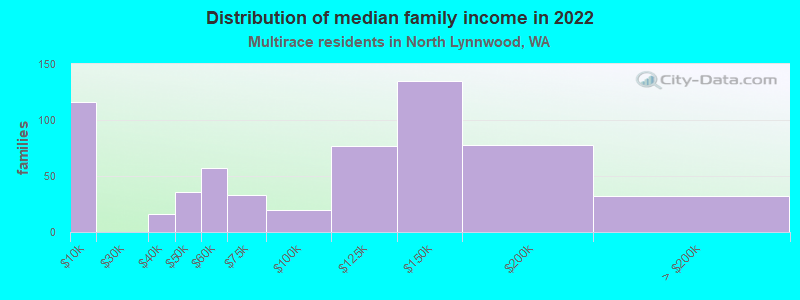
Median family income in North Lynnwood in 2022:
North Lynnwood:
$121,066
State:
$95,629
Number of families with income < $10k:
North Lynnwood:
19.4% (116)
State:
3.5% (6,121)
Number of families with income $30k - 40k:
North Lynnwood:
2.7% (16)
State:
5.8% (10,186)
Number of families with income $40k - 50k:
North Lynnwood:
6.0% (36)
State:
5.9% (10,412)
Number of families with income $50k - 60k:
North Lynnwood:
9.5% (57)
State:
5.6% (9,922)
Number of families with income $60k - 75k:
North Lynnwood:
5.5% (33)
Washington:
9.7% (17,113)
Number of families with income $75k - 100k:
North Lynnwood:
3.4% (20)
Washington:
13.6% (23,984)
Number of families with income $100k - 125k:
North Lynnwood:
12.9% (77)
Washington:
10.4% (18,288)
Number of families with income $125k - 150k:
North Lynnwood:
22.5% (135)
Washington:
10.5% (18,481)
Number of families with income $150k - 200k:
North Lynnwood:
13.0% (78)
State:
11.9% (20,852)
Number of families with income > $200k:
North Lynnwood:
5.3% (32)
State:
14.4% (25,289)
Median non-family income in North Lynnwood in 2022:
North Lynnwood:
$86,940
State:
$56,573
Median per capita income in North Lynnwood in 2022:
North Lynnwood:
$33,180
Washington:
$32,496
Change in median per capita income between 2000 and 2022:
North Lynnwood, Washington:
+140.4%
Washington:
+156.8%
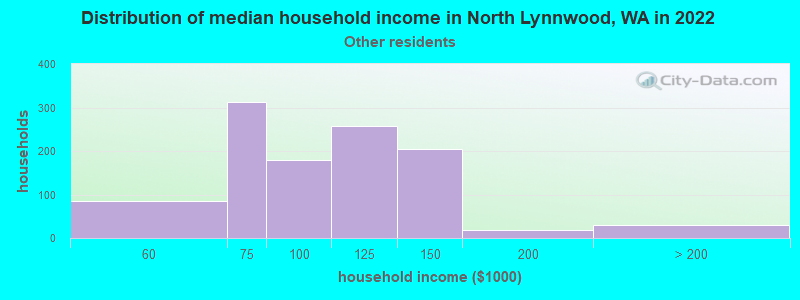
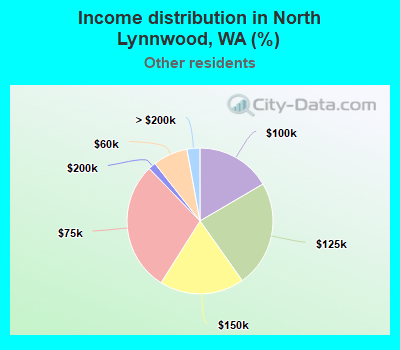
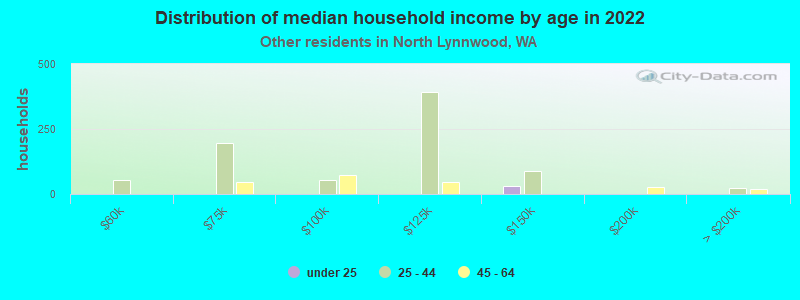
Income statistics for other residents
Median household income in North Lynnwood, WA in 2022:
North Lynnwood:
$96,751
Washington:
$69,545
Number of households with income < $10k:
North Lynnwood:
0.0% (0)
State:
5.3% (6,540)
Number of households with income $10k - 20k:
North Lynnwood:
0.0% (0)
State:
6.0% (7,385)
Number of households with income $20k - 30k:
North Lynnwood:
0.0% (0)
Washington:
7.5% (9,289)
Number of households with income $30k - 40k:
North Lynnwood:
0.0% (0)
State:
8.9% (11,015)
Number of households with income $40k - 50k:
North Lynnwood:
0.0% (0)
Washington:
7.6% (9,399)
Number of households with income $50k - 60k:
North Lynnwood:
7.7% (84)
State:
7.2% (8,867)
Number of households with income $60k - 75k:
North Lynnwood:
28.8% (313)
Washington:
10.5% (13,032)
Number of households with income $75k - 100k:
North Lynnwood:
16.6% (180)
State:
14.6% (18,007)
Number of households with income $100k - 125k:
North Lynnwood:
23.6% (257)
State:
12.2% (15,128)
Number of households with income $125k - 150k:
North Lynnwood:
18.8% (204)
Washington:
5.6% (6,950)
Number of households with income $150k - 200k:
North Lynnwood:
1.7% (18)
State:
7.1% (8,749)
Number of households with income > $200k:
North Lynnwood:
2.9% (31)
Washington:
7.5% (9,208)
Aggregate household income in North Lynnwood in 2022: $104,459,295
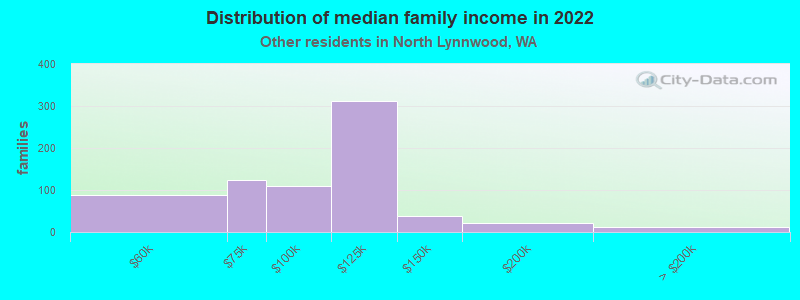
Median family income in North Lynnwood in 2022:
North Lynnwood:
$103,748
Washington:
$72,588
Number of families with income $50k - 60k:
North Lynnwood:
12.5% (88)
State:
7.7% (7,357)
Number of families with income $60k - 75k:
North Lynnwood:
17.7% (125)
Washington:
10.3% (9,864)
Number of families with income $75k - 100k:
North Lynnwood:
15.6% (110)
Washington:
14.5% (13,800)
Number of families with income $100k - 125k:
North Lynnwood:
44.1% (312)
State:
12.9% (12,298)
Number of families with income $125k - 150k:
North Lynnwood:
5.3% (38)
State:
6.0% (5,679)
Number of families with income $150k - 200k:
North Lynnwood:
3.1% (22)
State:
8.2% (7,822)
Number of families with income > $200k:
North Lynnwood:
1.7% (12)
State:
7.1% (6,764)
Median non-family income in North Lynnwood in 2022:
North Lynnwood:
$66,097
State:
$44,777
Change in median non-family income between 2000 and 2022:
North Lynnwood, Washington:
+82.7%
State:
+84.2%
Median per capita income in North Lynnwood in 2022:
North Lynnwood:
$28,147
State:
$27,542
Change in median per capita income between 2000 and 2022:
North Lynnwood, Washington:
+109.0%
State:
+167.8%
Discuss North Lynnwood, Washington (WA) on our hugely popular Washington forum.