The median household income in North New Hyde Park, NY in 2022 was $148,449, which was 46.4% greater than the median annual income of $79,557 across the entire state of New York. Compared to the median income of $69,792 in 2000 this represents an increase of 53.0%. The per capita income in 2022 was $61,535, which means an increase of 48.0% compared to 2000 when it was $31,998.
Whole page based on the data from 2000 / 2022 when the population of North New Hyde Park, New York was 14,542 / 14,595
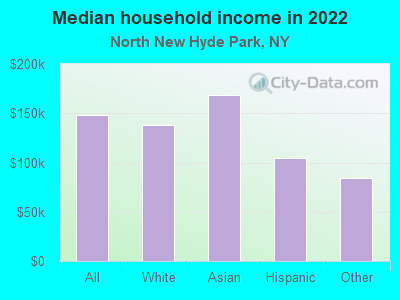
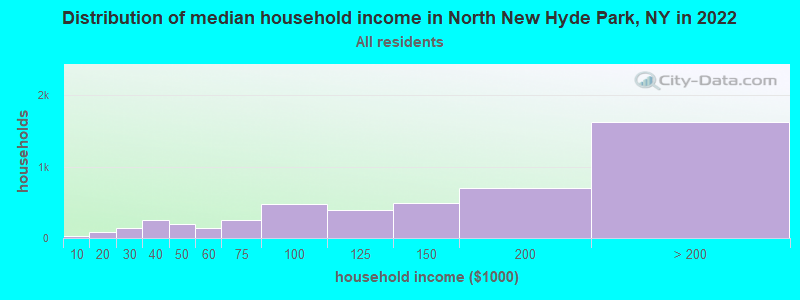
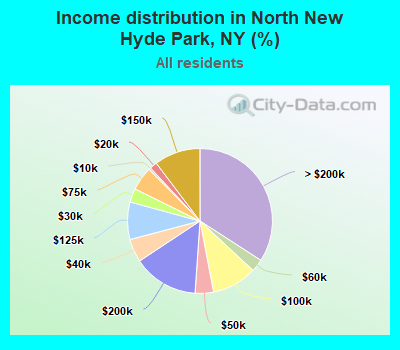
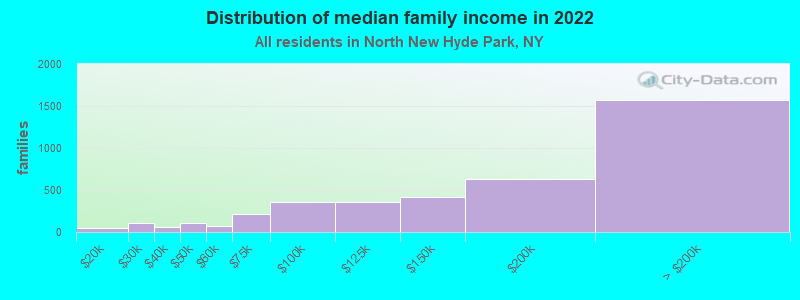
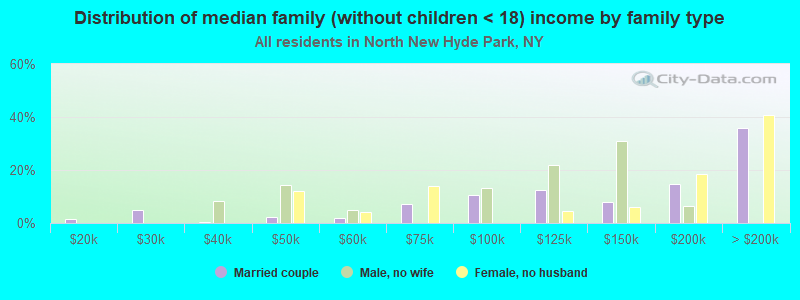
Income statistics for all residents
Median household income in North New Hyde Park, NY in 2022:
North New Hyde Park:
$148,449
State:
$79,557
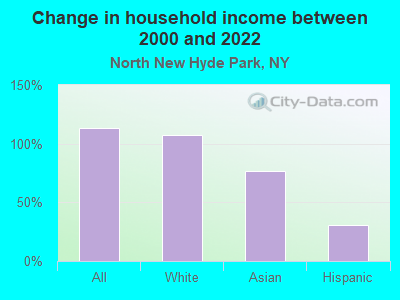
Change in median household income between 2000 and 2022:
North New Hyde Park, New York:
+112.7%
New York:
+83.3%
Number of households with income < $10k:
North New Hyde Park:
0.4% (21)
New York:
6.8% (527,598)
Number of households with income $10k - 20k:
North New Hyde Park:
1.6% (78)
State:
7.4% (574,940)
Number of households with income $20k - 30k:
North New Hyde Park:
3.1% (146)
New York:
6.7% (517,718)
Number of households with income $30k - 40k:
North New Hyde Park:
5.2% (247)
State:
6.5% (506,674)
Number of households with income $40k - 50k:
North New Hyde Park:
4.1% (195)
New York:
6.1% (470,439)
Number of households with income $50k - 60k:
North New Hyde Park:
2.8% (133)
State:
5.8% (454,042)
Number of households with income $60k - 75k:
North New Hyde Park:
5.3% (252)
State:
8.5% (657,508)
Number of households with income $75k - 100k:
North New Hyde Park:
10.1% (478)
State:
11.6% (899,824)
Number of households with income $100k - 125k:
North New Hyde Park:
8.4% (397)
New York:
9.3% (723,825)
Number of households with income $125k - 150k:
North New Hyde Park:
10.3% (490)
State:
7.1% (552,420)
Number of households with income $150k - 200k:
North New Hyde Park:
14.6% (694)
State:
9.4% (727,051)
Number of households with income > $200k:
North New Hyde Park:
34.1% (1,623)
New York:
15.0% (1,162,269)
Aggregate household income in North New Hyde Park in 2022: $886,399,088
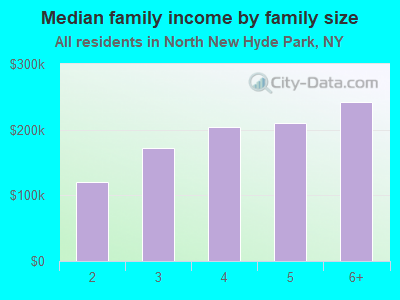
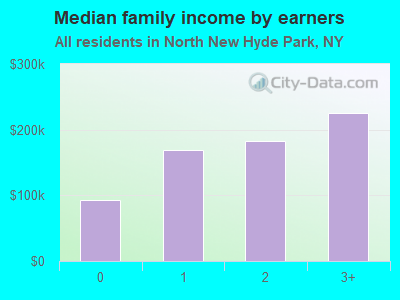
Median family income in North New Hyde Park in 2022:
North New Hyde Park:
$170,204
State:
$99,066
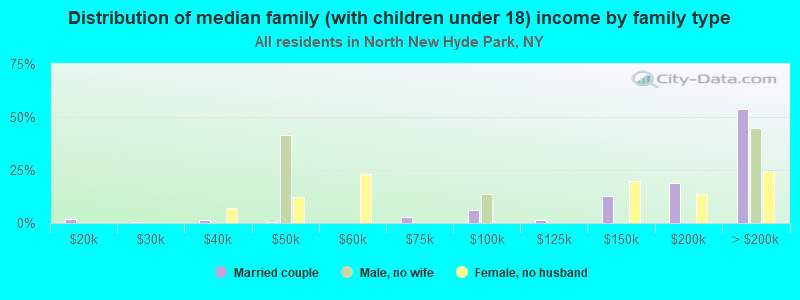
Number of families with income $10k - 20k:
North New Hyde Park:
1.3% (51)
State:
4.3% (205,373)
Number of families with income $20k - 30k:
North New Hyde Park:
2.8% (112)
State:
5.1% (241,229)
Number of families with income $30k - 40k:
North New Hyde Park:
1.5% (58)
State:
5.5% (259,233)
Number of families with income $40k - 50k:
North New Hyde Park:
2.8% (113)
State:
5.5% (259,113)
Number of families with income $50k - 60k:
North New Hyde Park:
1.9% (74)
State:
5.4% (255,320)
Number of families with income $60k - 75k:
North New Hyde Park:
5.5% (220)
State:
8.2% (388,624)
Number of families with income $75k - 100k:
North New Hyde Park:
8.9% (352)
State:
12.3% (583,110)
Number of families with income $100k - 125k:
North New Hyde Park:
9.1% (359)
State:
10.6% (500,579)
Number of families with income $125k - 150k:
North New Hyde Park:
10.4% (413)
New York:
8.5% (400,594)
Number of families with income $150k - 200k:
North New Hyde Park:
16.0% (635)
State:
11.6% (551,650)
Number of families with income > $200k:
North New Hyde Park:
39.7% (1,572)
State:
18.9% (895,998)
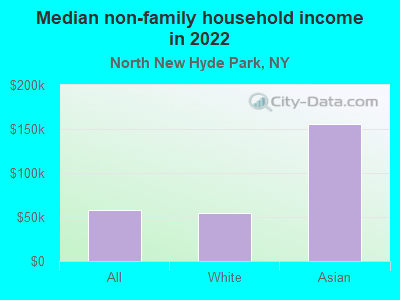
Median non-family income in North New Hyde Park in 2022:
North New Hyde Park:
$58,498
New York:
$50,181
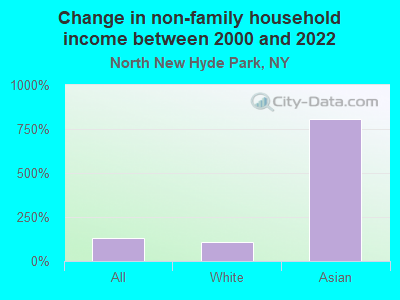
Change in median non-family income between 2000 and 2022:
North New Hyde Park, New York:
+128.0%
State:
+85.4%
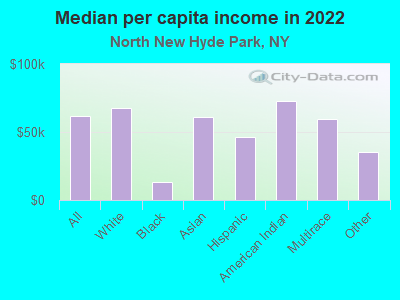
Median per capita income in North New Hyde Park in 2022:
North New Hyde Park:
$61,535
New York:
$47,421
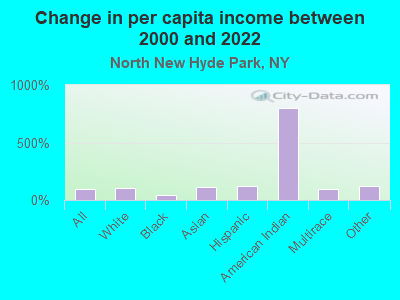
Change in median per capita income between 2000 and 2022:
North New Hyde Park, New York:
+92.3%
New York:
+102.7%
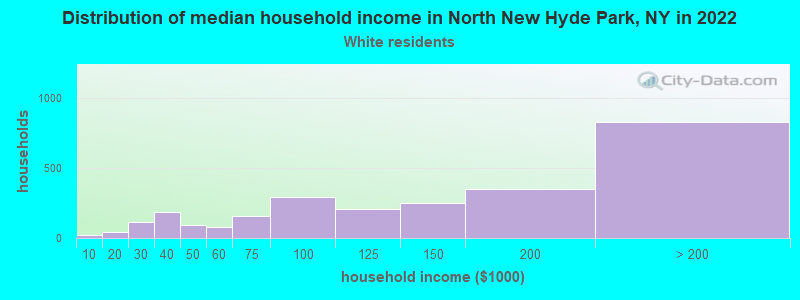
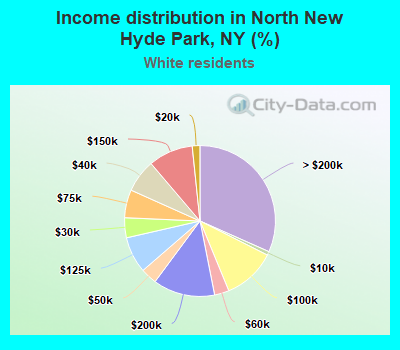
Income statistics for White residents
Median household income in North New Hyde Park, NY in 2022:
North New Hyde Park:
$137,565
State:
$89,408
Change in median household income between 2000 and 2022:
North New Hyde Park, New York:
+107.2%
State:
+85.5%
Number of households with income < $10k:
North New Hyde Park:
0.8% (21)
New York:
4.8% (225,550)
Number of households with income $10k - 20k:
North New Hyde Park:
1.6% (43)
State:
6.1% (289,425)
Number of households with income $20k - 30k:
North New Hyde Park:
4.3% (112)
State:
5.9% (280,254)
Number of households with income $30k - 40k:
North New Hyde Park:
7.1% (185)
State:
6.1% (288,263)
Number of households with income $40k - 50k:
North New Hyde Park:
3.5% (91)
State:
5.9% (278,079)
Number of households with income $50k - 60k:
North New Hyde Park:
3.1% (82)
State:
5.7% (267,554)
Number of households with income $60k - 75k:
North New Hyde Park:
6.0% (157)
State:
8.4% (398,344)
Number of households with income $75k - 100k:
North New Hyde Park:
11.3% (296)
State:
11.8% (554,841)
Number of households with income $100k - 125k:
North New Hyde Park:
7.8% (204)
State:
10.0% (469,794)
Number of households with income $125k - 150k:
North New Hyde Park:
9.6% (251)
New York:
7.6% (360,467)
Number of households with income $150k - 200k:
North New Hyde Park:
13.3% (347)
New York:
10.1% (477,078)
Number of households with income > $200k:
North New Hyde Park:
31.7% (829)
State:
17.6% (829,233)
Aggregate household income in North New Hyde Park in 2022: $443,943,194
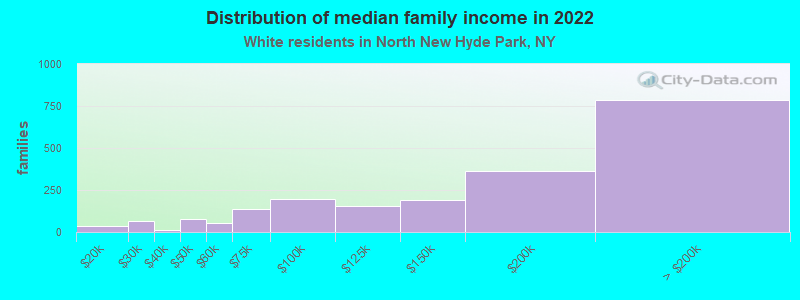
Median family income in North New Hyde Park in 2022:
North New Hyde Park:
$173,756
State:
$115,170
Number of families with income $10k - 20k:
North New Hyde Park:
1.7% (34)
State:
3.0% (83,127)
Number of families with income $20k - 30k:
North New Hyde Park:
3.3% (68)
State:
3.5% (97,578)
Number of families with income $30k - 40k:
North New Hyde Park:
0.4% (9)
State:
4.1% (114,108)
Number of families with income $40k - 50k:
North New Hyde Park:
3.6% (75)
New York:
4.7% (130,902)
Number of families with income $50k - 60k:
North New Hyde Park:
2.6% (53)
State:
4.9% (135,118)
Number of families with income $60k - 75k:
North New Hyde Park:
6.5% (134)
New York:
7.8% (216,254)
Number of families with income $75k - 100k:
North New Hyde Park:
9.5% (197)
New York:
12.4% (342,382)
Number of families with income $100k - 125k:
North New Hyde Park:
7.5% (156)
New York:
11.4% (314,917)
Number of families with income $125k - 150k:
North New Hyde Park:
9.2% (190)
State:
9.4% (260,489)
Number of families with income $150k - 200k:
North New Hyde Park:
17.7% (366)
State:
13.2% (365,586)
Number of families with income > $200k:
North New Hyde Park:
38.0% (785)
New York:
23.2% (642,319)
Median non-family income in North New Hyde Park in 2022:
North New Hyde Park:
$54,308
New York:
$54,783
Change in median non-family income between 2000 and 2022:
North New Hyde Park, New York:
+110.4%
New York:
+87.9%
Median per capita income in North New Hyde Park in 2022:
North New Hyde Park:
$67,586
State:
$57,640
Change in median per capita income between 2000 and 2022:
North New Hyde Park, New York:
+105.0%
New York:
+111.6%
Income statistics for Black or African American residents
Aggregate household income in North New Hyde Park in 2022: $9,169,525
Median per capita income in North New Hyde Park in 2022:
North New Hyde Park:
$13,049
State:
$31,947
Change in median per capita income between 2000 and 2022:
North New Hyde Park, New York:
+40.9%
New York:
+106.1%
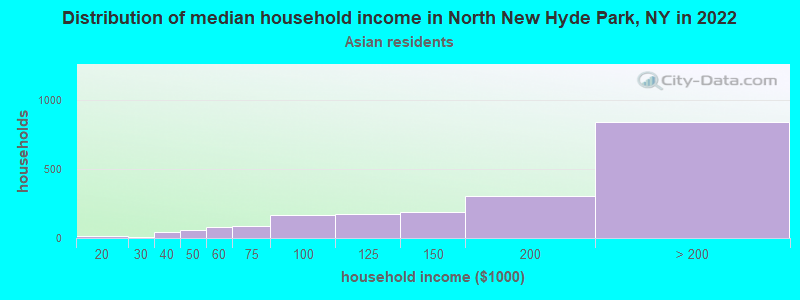
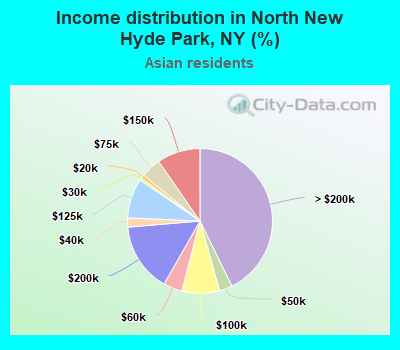
Income statistics for Asian residents
Median household income in North New Hyde Park, NY in 2022:
North New Hyde Park:
$168,678
New York:
$89,947
Change in median household income between 2000 and 2022:
North New Hyde Park, New York:
+77.1%
New York:
+98.1%
Number of households with income < $10k:
North New Hyde Park:
0.0% (0)
State:
6.9% (42,537)
Number of households with income $10k - 20k:
North New Hyde Park:
0.8% (16)
New York:
7.3% (44,745)
Number of households with income $20k - 30k:
North New Hyde Park:
0.5% (10)
State:
6.2% (38,249)
Number of households with income $30k - 40k:
North New Hyde Park:
2.0% (40)
New York:
5.5% (33,993)
Number of households with income $40k - 50k:
North New Hyde Park:
2.9% (57)
State:
4.8% (29,795)
Number of households with income $50k - 60k:
North New Hyde Park:
4.2% (83)
New York:
5.2% (32,100)
Number of households with income $60k - 75k:
North New Hyde Park:
4.5% (88)
State:
7.3% (44,615)
Number of households with income $75k - 100k:
North New Hyde Park:
8.4% (164)
New York:
10.8% (66,687)
Number of households with income $100k - 125k:
North New Hyde Park:
8.9% (174)
State:
8.2% (50,233)
Number of households with income $125k - 150k:
North New Hyde Park:
9.6% (189)
State:
7.2% (44,299)
Number of households with income $150k - 200k:
North New Hyde Park:
15.4% (302)
New York:
10.4% (63,837)
Number of households with income > $200k:
North New Hyde Park:
42.8% (839)
New York:
20.1% (123,891)
Aggregate household income in North New Hyde Park in 2022: $443,659,301
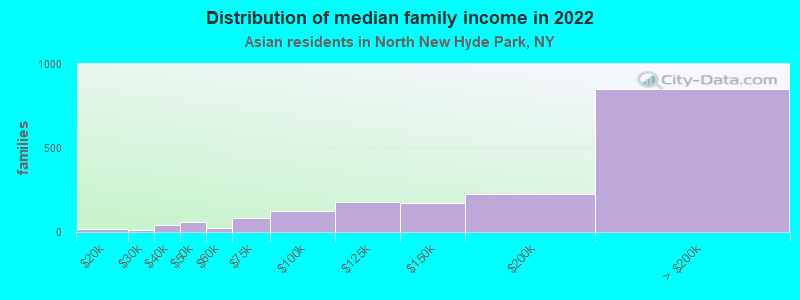
Median family income in North New Hyde Park in 2022:
North New Hyde Park:
$183,458
New York:
$98,136
Number of families with income $10k - 20k:
North New Hyde Park:
1.0% (19)
State:
5.2% (22,725)
Number of families with income $20k - 30k:
North New Hyde Park:
0.7% (13)
State:
6.4% (27,990)
Number of families with income $30k - 40k:
North New Hyde Park:
2.2% (39)
New York:
6.2% (26,994)
Number of families with income $40k - 50k:
North New Hyde Park:
3.2% (58)
State:
5.2% (22,750)
Number of families with income $50k - 60k:
North New Hyde Park:
1.4% (25)
State:
5.5% (24,015)
Number of families with income $60k - 75k:
North New Hyde Park:
4.6% (83)
State:
7.6% (33,120)
Number of families with income $75k - 100k:
North New Hyde Park:
7.0% (125)
State:
10.7% (46,726)
Number of families with income $100k - 125k:
North New Hyde Park:
10.0% (179)
State:
8.6% (37,796)
Number of families with income $125k - 150k:
North New Hyde Park:
9.7% (173)
New York:
7.3% (31,893)
Number of families with income $150k - 200k:
North New Hyde Park:
12.6% (227)
State:
11.0% (48,177)
Number of families with income > $200k:
North New Hyde Park:
47.5% (852)
State:
22.2% (97,322)
Median non-family income in North New Hyde Park in 2022:
North New Hyde Park:
$155,290
State:
$63,573
Median per capita income in North New Hyde Park in 2022:
North New Hyde Park:
$61,192
State:
$46,726
Change in median per capita income between 2000 and 2022:
North New Hyde Park, New York:
+110.6%
State:
+126.6%
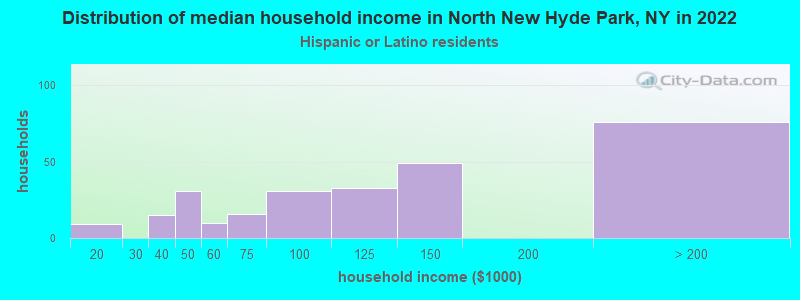
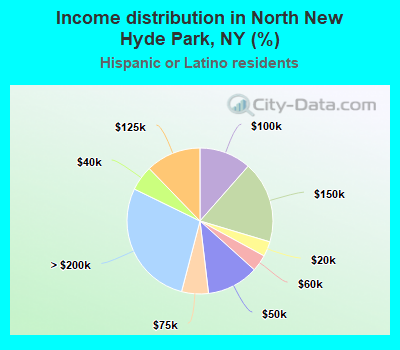
Income statistics for Hispanic or Latino residents
Median household income in North New Hyde Park, NY in 2022:
North New Hyde Park:
$104,415
State:
$60,468
Change in median household income between 2000 and 2022:
North New Hyde Park, New York:
+30.9%
State:
+98.3%
Number of households with income < $10k:
North New Hyde Park:
0.0% (0)
State:
9.9% (127,185)
Number of households with income $10k - 20k:
North New Hyde Park:
3.3% (9)
State:
10.7% (136,699)
Number of households with income $20k - 30k:
North New Hyde Park:
0.0% (0)
State:
8.1% (102,991)
Number of households with income $30k - 40k:
North New Hyde Park:
5.6% (15)
State:
7.8% (100,149)
Number of households with income $40k - 50k:
North New Hyde Park:
11.5% (31)
New York:
6.9% (87,760)
Number of households with income $50k - 60k:
North New Hyde Park:
3.7% (10)
State:
6.3% (80,968)
Number of households with income $60k - 75k:
North New Hyde Park:
5.9% (16)
New York:
8.7% (110,631)
Number of households with income $75k - 100k:
North New Hyde Park:
11.5% (31)
State:
11.2% (142,787)
Number of households with income $100k - 125k:
North New Hyde Park:
12.2% (33)
State:
8.2% (104,850)
Number of households with income $125k - 150k:
North New Hyde Park:
18.1% (49)
State:
6.3% (80,274)
Number of households with income $150k - 200k:
North New Hyde Park:
0.0% (0)
State:
7.4% (95,117)
Number of households with income > $200k:
North New Hyde Park:
28.1% (76)
State:
8.6% (109,514)
Aggregate household income in North New Hyde Park in 2022: $43,941,339
Median per capita income in North New Hyde Park in 2022:
North New Hyde Park:
$46,676
State:
$29,761
Change in median per capita income between 2000 and 2022:
North New Hyde Park, New York:
+121.4%
State:
+132.7%
Income statistics for American Indian and Alaska Native residents
Number of households with income < $10k:
North New Hyde Park:
0.0% (0)
State:
8.6% (3,559)
Number of households with income $10k - 20k:
North New Hyde Park:
0.0% (0)
State:
5.9% (2,455)
Number of households with income $20k - 30k:
North New Hyde Park:
0.0% (0)
State:
8.2% (3,393)
Number of households with income $30k - 40k:
North New Hyde Park:
0.0% (0)
State:
11.9% (4,918)
Number of households with income $40k - 50k:
North New Hyde Park:
0.0% (0)
State:
6.5% (2,682)
Number of households with income $50k - 60k:
North New Hyde Park:
0.0% (0)
State:
6.1% (2,516)
Number of households with income $60k - 75k:
North New Hyde Park:
0.0% (0)
New York:
10.0% (4,125)
Number of households with income $75k - 100k:
North New Hyde Park:
0.0% (0)
State:
13.3% (5,517)
Number of households with income $100k - 125k:
North New Hyde Park:
0.0% (0)
New York:
8.4% (3,463)
Number of households with income $125k - 150k:
North New Hyde Park:
100.0% (35)
State:
7.0% (2,887)
Number of households with income $150k - 200k:
North New Hyde Park:
0.0% (0)
State:
9.9% (4,106)
Number of households with income > $200k:
North New Hyde Park:
0.0% (0)
New York:
4.2% (1,744)
Median per capita income in North New Hyde Park in 2022:
North New Hyde Park:
$72,775
State:
$25,837
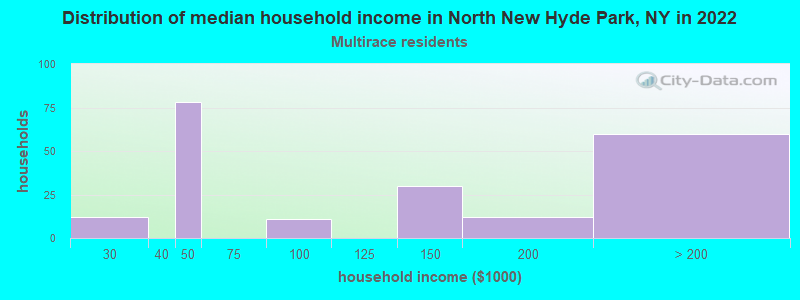
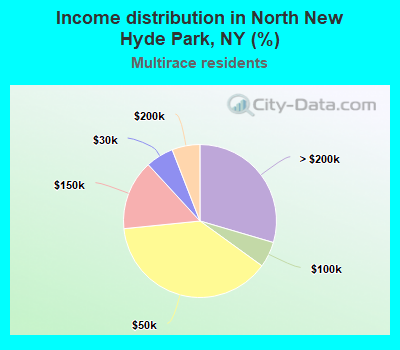
Income statistics for Multirace residents
Number of households with income < $10k:
North New Hyde Park:
0.0% (0)
State:
8.9% (57,924)
Number of households with income $10k - 20k:
North New Hyde Park:
0.0% (0)
State:
8.7% (56,590)
Number of households with income $20k - 30k:
North New Hyde Park:
5.9% (12)
State:
7.1% (46,287)
Number of households with income $30k - 40k:
North New Hyde Park:
0.0% (0)
State:
6.9% (45,132)
Number of households with income $40k - 50k:
North New Hyde Park:
38.4% (78)
New York:
5.8% (37,946)
Number of households with income $50k - 60k:
North New Hyde Park:
0.0% (0)
New York:
5.6% (36,410)
Number of households with income $60k - 75k:
North New Hyde Park:
0.0% (0)
State:
7.8% (50,819)
Number of households with income $75k - 100k:
North New Hyde Park:
5.4% (11)
New York:
11.7% (76,024)
Number of households with income $100k - 125k:
North New Hyde Park:
0.0% (0)
New York:
9.3% (60,635)
Number of households with income $125k - 150k:
North New Hyde Park:
14.8% (30)
State:
6.2% (40,533)
Number of households with income $150k - 200k:
North New Hyde Park:
5.9% (12)
State:
8.6% (56,409)
Number of households with income > $200k:
North New Hyde Park:
29.6% (60)
New York:
13.4% (87,442)
Aggregate household income in North New Hyde Park in 2022: $38,583,158
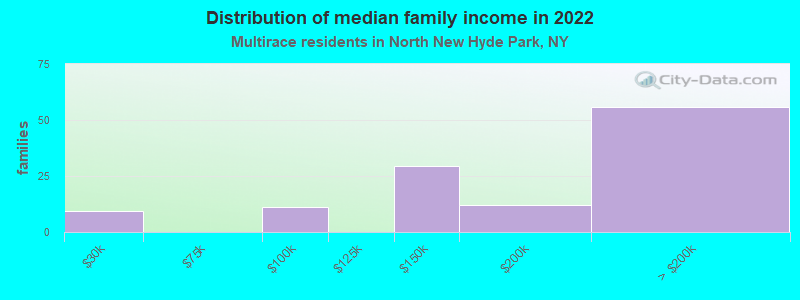
Median family income in North New Hyde Park in 2022:
North New Hyde Park:
$228,292
State:
$85,788
Number of families with income $20k - 30k:
North New Hyde Park:
8.1% (10)
State:
6.6% (26,534)
Number of families with income $75k - 100k:
North New Hyde Park:
9.5% (11)
State:
12.9% (51,995)
Number of families with income $125k - 150k:
North New Hyde Park:
25.1% (30)
State:
7.1% (28,583)
Number of families with income $150k - 200k:
North New Hyde Park:
10.1% (12)
State:
9.4% (37,771)
Number of families with income > $200k:
North New Hyde Park:
47.2% (56)
New York:
15.7% (62,951)
Median per capita income in North New Hyde Park in 2022:
North New Hyde Park:
$59,522
State:
$36,931
Change in median per capita income between 2000 and 2022:
North New Hyde Park, New York:
+97.2%
State:
+158.8%
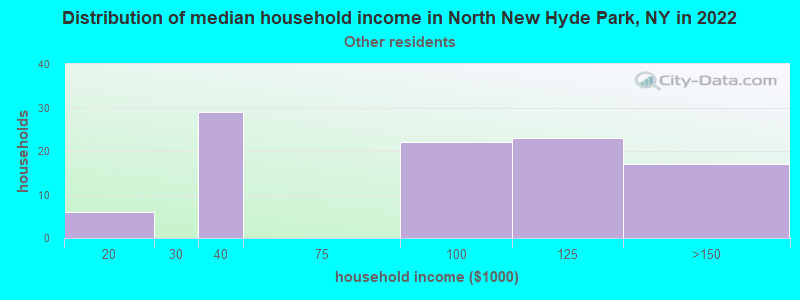
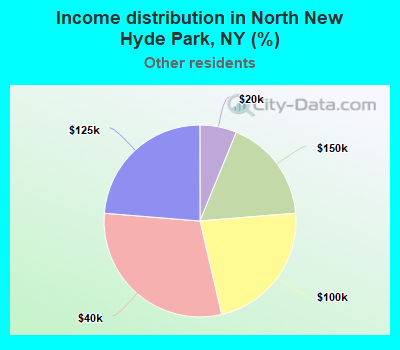
Income statistics for other residents
Median household income in North New Hyde Park, NY in 2022:
North New Hyde Park:
$83,938
State:
$56,210
Number of households with income < $10k:
North New Hyde Park:
0.0% (0)
State:
10.3% (69,252)
Number of households with income $10k - 20k:
North New Hyde Park:
6.2% (6)
State:
11.0% (73,890)
Number of households with income $20k - 30k:
North New Hyde Park:
0.0% (0)
State:
8.8% (59,096)
Number of households with income $30k - 40k:
North New Hyde Park:
29.9% (29)
State:
8.1% (54,418)
Number of households with income $40k - 50k:
North New Hyde Park:
0.0% (0)
State:
7.3% (49,042)
Number of households with income $50k - 60k:
North New Hyde Park:
0.0% (0)
State:
6.5% (43,945)
Number of households with income $60k - 75k:
North New Hyde Park:
0.0% (0)
State:
9.5% (64,087)
Number of households with income $75k - 100k:
North New Hyde Park:
22.7% (22)
New York:
10.9% (73,094)
Number of households with income $100k - 125k:
North New Hyde Park:
23.7% (23)
State:
7.9% (53,055)
Number of households with income $125k - 150k:
North New Hyde Park:
17.5% (17)
New York:
5.9% (39,446)
Number of households with income $150k - 200k:
North New Hyde Park:
0.0% (0)
State:
7.2% (48,653)
Number of households with income > $200k:
North New Hyde Park:
0.0% (0)
State:
6.6% (44,703)
Aggregate household income in North New Hyde Park in 2022: $8,691,434
Median per capita income in North New Hyde Park in 2022:
North New Hyde Park:
$35,080
State:
$26,975
Change in median per capita income between 2000 and 2022:
North New Hyde Park, New York:
+124.3%
State:
+144.6%
Discuss North New Hyde Park, New York (NY) on our hugely popular New York forum.