The median household income in North Patchogue, NY in 2022 was $115,032, which was 30.8% greater than the median annual income of $79,557 across the entire state of New York. Compared to the median income of $61,145 in 2000 this represents an increase of 46.8%. The per capita income in 2022 was $43,986, which means an increase of 46.1% compared to 2000 when it was $23,719.
Whole page based on the data from 2000 / 2022 when the population of North Patchogue, New York was 7,825 / 7,805
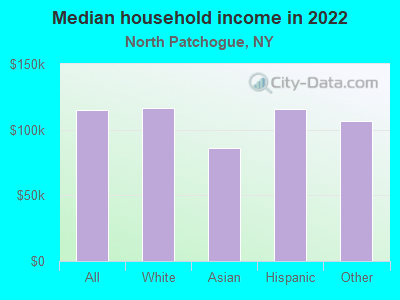
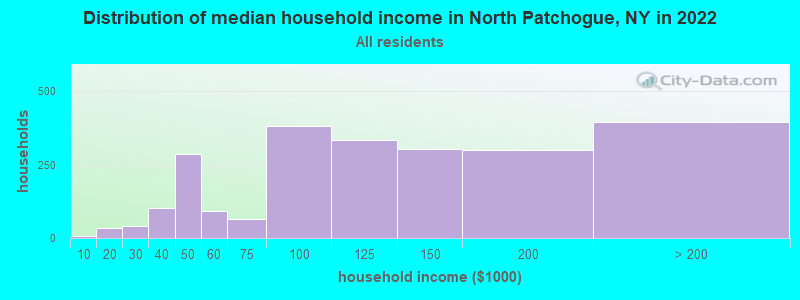
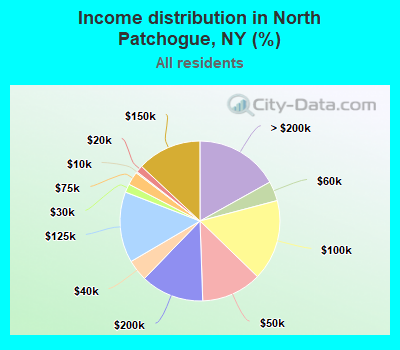
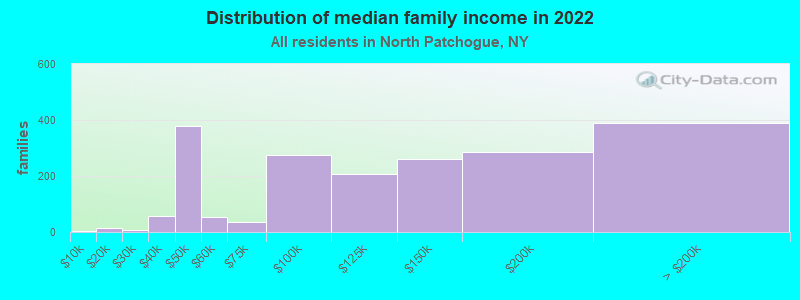
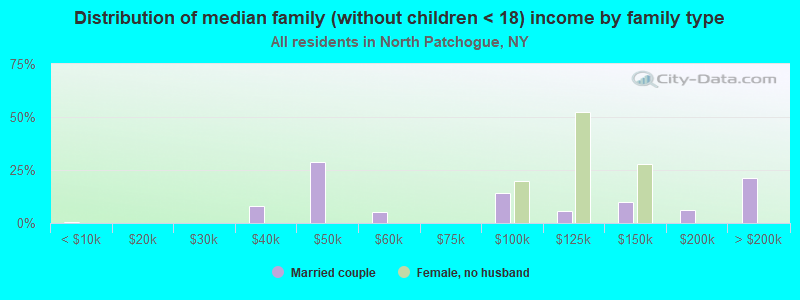
Income statistics for all residents
Median household income in North Patchogue, NY in 2022:
North Patchogue:
$115,033
New York:
$79,557
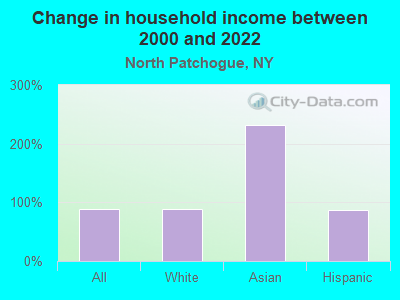
Change in median household income between 2000 and 2022:
North Patchogue, New York:
+88.1%
State:
+83.3%
Number of households with income < $10k:
North Patchogue:
0.3% (6)
State:
6.8% (527,598)
Number of households with income $10k - 20k:
North Patchogue:
1.4% (33)
State:
7.4% (574,940)
Number of households with income $20k - 30k:
North Patchogue:
1.7% (40)
New York:
6.7% (517,718)
Number of households with income $30k - 40k:
North Patchogue:
4.3% (101)
State:
6.5% (506,674)
Number of households with income $40k - 50k:
North Patchogue:
12.2% (285)
State:
6.1% (470,439)
Number of households with income $50k - 60k:
North Patchogue:
4.0% (93)
State:
5.8% (454,042)
Number of households with income $60k - 75k:
North Patchogue:
2.7% (63)
New York:
8.5% (657,508)
Number of households with income $75k - 100k:
North Patchogue:
16.4% (382)
State:
11.6% (899,824)
Number of households with income $100k - 125k:
North Patchogue:
14.3% (335)
State:
9.3% (723,825)
Number of households with income $125k - 150k:
North Patchogue:
13.0% (304)
New York:
7.1% (552,420)
Number of households with income $150k - 200k:
North Patchogue:
12.8% (298)
State:
9.4% (727,051)
Number of households with income > $200k:
North Patchogue:
16.9% (395)
New York:
15.0% (1,162,269)
Aggregate household income in North Patchogue in 2022: $334,923,968
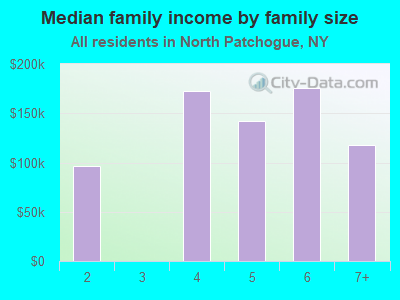
Median family income in North Patchogue in 2022:
North Patchogue:
$124,524
State:
$99,066
Number of families with income < $10k:
North Patchogue:
0.3% (5)
State:
4.2% (197,409)
Number of families with income $10k - 20k:
North Patchogue:
0.7% (14)
State:
4.3% (205,373)
Number of families with income $20k - 30k:
North Patchogue:
0.4% (7)
State:
5.1% (241,229)
Number of families with income $30k - 40k:
North Patchogue:
2.8% (56)
State:
5.5% (259,233)
Number of families with income $40k - 50k:
North Patchogue:
19.3% (379)
New York:
5.5% (259,113)
Number of families with income $50k - 60k:
North Patchogue:
2.7% (52)
State:
5.4% (255,320)
Number of families with income $60k - 75k:
North Patchogue:
1.8% (36)
New York:
8.2% (388,624)
Number of families with income $75k - 100k:
North Patchogue:
14.0% (276)
New York:
12.3% (583,110)
Number of families with income $100k - 125k:
North Patchogue:
10.6% (208)
New York:
10.6% (500,579)
Number of families with income $125k - 150k:
North Patchogue:
13.2% (259)
New York:
8.5% (400,594)
Number of families with income $150k - 200k:
North Patchogue:
14.4% (284)
State:
11.6% (551,650)
Number of families with income > $200k:
North Patchogue:
19.8% (389)
New York:
18.9% (895,998)
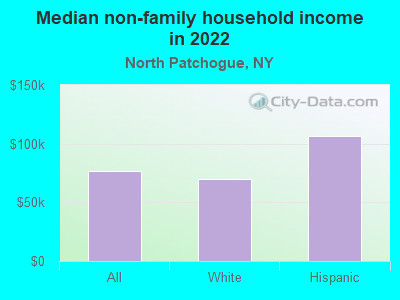
Median non-family income in North Patchogue in 2022:
North Patchogue:
$76,956
State:
$50,181
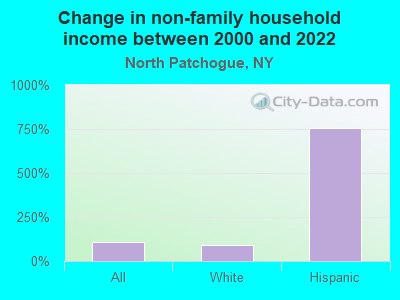
Change in median non-family income between 2000 and 2022:
North Patchogue, New York:
+106.5%
State:
+85.4%
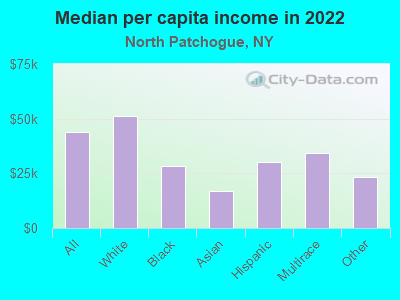
Median per capita income in North Patchogue in 2022:
North Patchogue:
$43,987
State:
$47,421
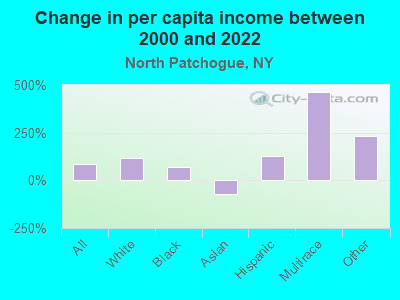
Change in median per capita income between 2000 and 2022:
North Patchogue, New York:
+85.4%
New York:
+102.7%
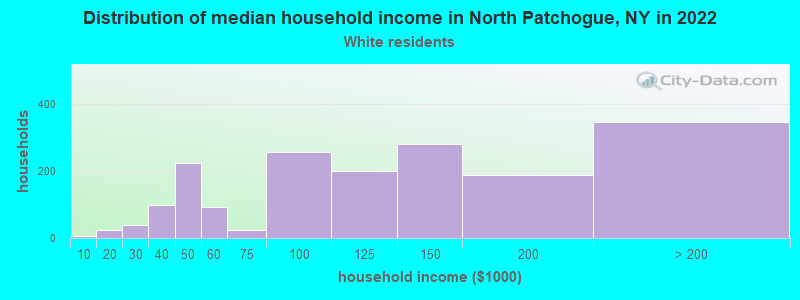
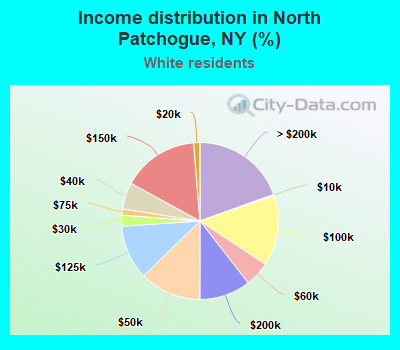
Income statistics for White residents
Median household income in North Patchogue, NY in 2022:
North Patchogue:
$116,138
New York:
$89,408
Change in median household income between 2000 and 2022:
North Patchogue, New York:
+88.7%
New York:
+85.5%
Number of households with income < $10k:
North Patchogue:
0.3% (5)
State:
4.8% (225,550)
Number of households with income $10k - 20k:
North Patchogue:
1.3% (23)
State:
6.1% (289,425)
Number of households with income $20k - 30k:
North Patchogue:
2.3% (40)
State:
5.9% (280,254)
Number of households with income $30k - 40k:
North Patchogue:
5.5% (97)
New York:
6.1% (288,263)
Number of households with income $40k - 50k:
North Patchogue:
12.7% (225)
State:
5.9% (278,079)
Number of households with income $50k - 60k:
North Patchogue:
5.1% (91)
State:
5.7% (267,554)
Number of households with income $60k - 75k:
North Patchogue:
1.3% (23)
New York:
8.4% (398,344)
Number of households with income $75k - 100k:
North Patchogue:
14.6% (258)
State:
11.8% (554,841)
Number of households with income $100k - 125k:
North Patchogue:
11.2% (199)
New York:
10.0% (469,794)
Number of households with income $125k - 150k:
North Patchogue:
15.7% (279)
State:
7.6% (360,467)
Number of households with income $150k - 200k:
North Patchogue:
10.5% (187)
State:
10.1% (477,078)
Number of households with income > $200k:
North Patchogue:
19.5% (346)
State:
17.6% (829,233)
Aggregate household income in North Patchogue in 2022: $270,550,160
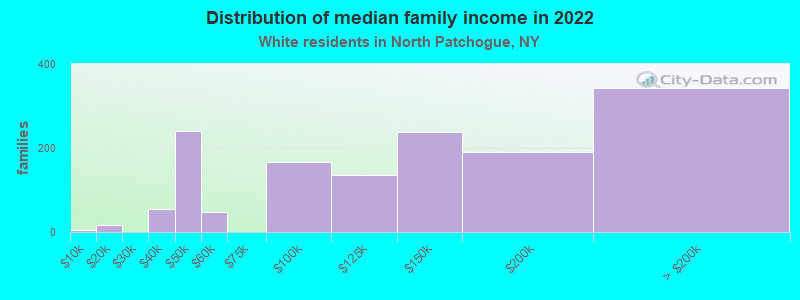
Median family income in North Patchogue in 2022:
North Patchogue:
$134,653
State:
$115,170
Number of families with income < $10k:
North Patchogue:
0.3% (4)
State:
2.5% (68,851)
Number of families with income $10k - 20k:
North Patchogue:
1.1% (16)
New York:
3.0% (83,127)
Number of families with income $30k - 40k:
North Patchogue:
3.8% (54)
State:
4.1% (114,108)
Number of families with income $40k - 50k:
North Patchogue:
16.7% (240)
State:
4.7% (130,902)
Number of families with income $50k - 60k:
North Patchogue:
3.3% (48)
State:
4.9% (135,118)
Number of families with income $75k - 100k:
North Patchogue:
11.6% (166)
State:
12.4% (342,382)
Number of families with income $100k - 125k:
North Patchogue:
9.5% (136)
State:
11.4% (314,917)
Number of families with income $125k - 150k:
North Patchogue:
16.6% (238)
State:
9.4% (260,489)
Number of families with income $150k - 200k:
North Patchogue:
13.2% (190)
State:
13.2% (365,586)
Number of families with income > $200k:
North Patchogue:
23.9% (343)
State:
23.2% (642,319)
Median non-family income in North Patchogue in 2022:
North Patchogue:
$69,501
New York:
$54,783
Change in median non-family income between 2000 and 2022:
North Patchogue, New York:
+89.5%
State:
+87.9%
Median per capita income in North Patchogue in 2022:
North Patchogue:
$51,051
New York:
$57,640
Change in median per capita income between 2000 and 2022:
North Patchogue, New York:
+117.5%
State:
+111.6%
Income statistics for Black or African American residents
Median per capita income in North Patchogue in 2022:
North Patchogue:
$28,372
State:
$31,947
Change in median per capita income between 2000 and 2022:
North Patchogue, New York:
+72.1%
New York:
+106.1%
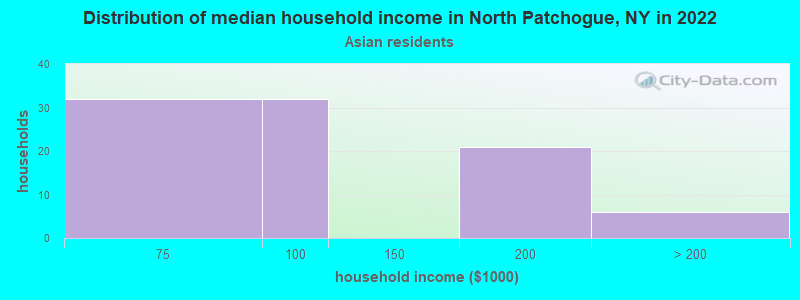
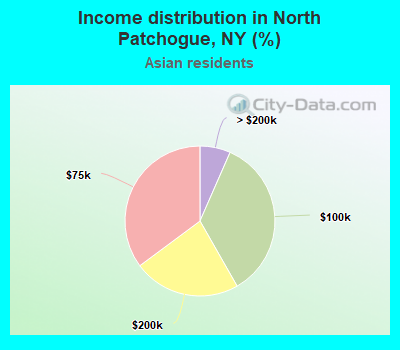
Income statistics for Asian residents
Median household income in North Patchogue, NY in 2022:
North Patchogue:
$86,255
New York:
$89,947
Number of households with income < $10k:
North Patchogue:
0.0% (0)
New York:
6.9% (42,537)
Number of households with income $10k - 20k:
North Patchogue:
0.0% (0)
State:
7.3% (44,745)
Number of households with income $20k - 30k:
North Patchogue:
0.0% (0)
State:
6.2% (38,249)
Number of households with income $30k - 40k:
North Patchogue:
0.0% (0)
State:
5.5% (33,993)
Number of households with income $40k - 50k:
North Patchogue:
0.0% (0)
State:
4.8% (29,795)
Number of households with income $50k - 60k:
North Patchogue:
0.0% (0)
New York:
5.2% (32,100)
Number of households with income $60k - 75k:
North Patchogue:
35.2% (32)
State:
7.3% (44,615)
Number of households with income $75k - 100k:
North Patchogue:
35.2% (32)
New York:
10.8% (66,687)
Number of households with income $100k - 125k:
North Patchogue:
0.0% (0)
State:
8.2% (50,233)
Number of households with income $125k - 150k:
North Patchogue:
0.0% (0)
State:
7.2% (44,299)
Number of households with income $150k - 200k:
North Patchogue:
23.1% (21)
New York:
10.4% (63,837)
Number of households with income > $200k:
North Patchogue:
6.6% (6)
New York:
20.1% (123,891)
Aggregate household income in North Patchogue in 2022: $11,127,527
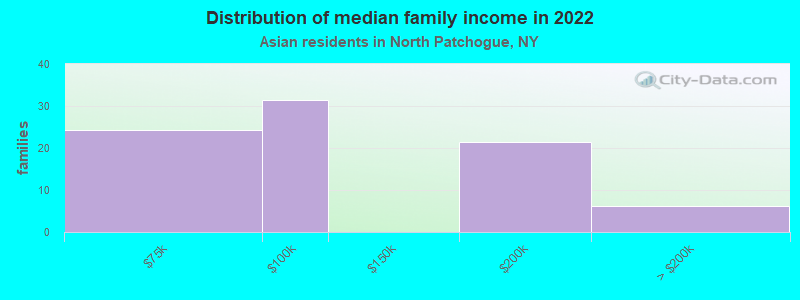
Median family income in North Patchogue in 2022:
North Patchogue:
$86,903
New York:
$98,136
Number of families with income $60k - 75k:
North Patchogue:
29.1% (24)
New York:
7.6% (33,120)
Number of families with income $75k - 100k:
North Patchogue:
37.6% (31)
State:
10.7% (46,726)
Number of families with income $150k - 200k:
North Patchogue:
25.7% (21)
State:
11.0% (48,177)
Number of families with income > $200k:
North Patchogue:
7.5% (6)
State:
22.2% (97,322)
Median per capita income in North Patchogue in 2022:
North Patchogue:
$17,035
State:
$46,726
Change in median per capita income between 2000 and 2022:: -71.1%
North Patchogue, New York:
-71.1%
State:
+126.6%
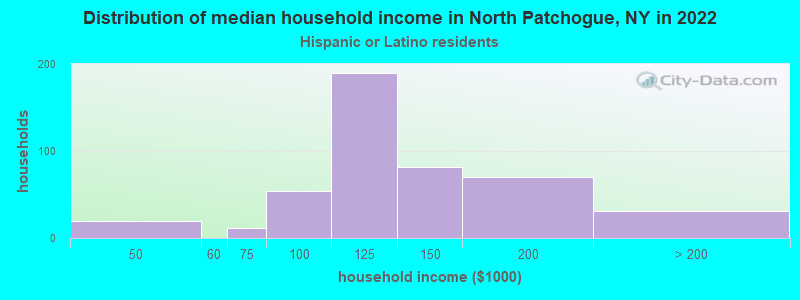
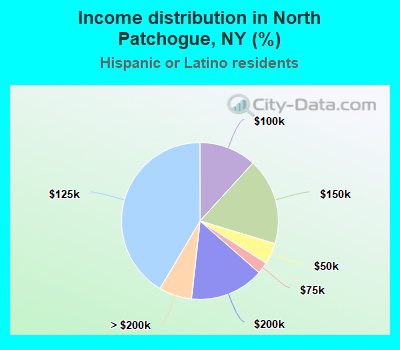
Income statistics for Hispanic or Latino residents
Median household income in North Patchogue, NY in 2022:
North Patchogue:
$115,577
New York:
$60,468
Change in median household income between 2000 and 2022:
North Patchogue, New York:
+87.5%
New York:
+98.3%
Number of households with income < $10k:
North Patchogue:
0.0% (0)
New York:
9.9% (127,185)
Number of households with income $10k - 20k:
North Patchogue:
0.0% (0)
New York:
10.7% (136,699)
Number of households with income $20k - 30k:
North Patchogue:
0.0% (0)
State:
8.1% (102,991)
Number of households with income $30k - 40k:
North Patchogue:
0.0% (0)
New York:
7.8% (100,149)
Number of households with income $40k - 50k:
North Patchogue:
4.4% (20)
State:
6.9% (87,760)
Number of households with income $50k - 60k:
North Patchogue:
0.0% (0)
State:
6.3% (80,968)
Number of households with income $60k - 75k:
North Patchogue:
2.4% (11)
State:
8.7% (110,631)
Number of households with income $75k - 100k:
North Patchogue:
11.8% (54)
New York:
11.2% (142,787)
Number of households with income $100k - 125k:
North Patchogue:
41.5% (190)
State:
8.2% (104,850)
Number of households with income $125k - 150k:
North Patchogue:
17.9% (82)
State:
6.3% (80,274)
Number of households with income $150k - 200k:
North Patchogue:
15.3% (70)
State:
7.4% (95,117)
Number of households with income > $200k:
North Patchogue:
6.8% (31)
State:
8.6% (109,514)
Aggregate household income in North Patchogue in 2022: $54,268,163
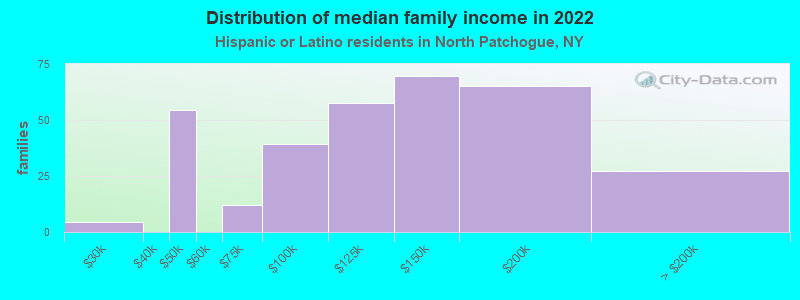
Median family income in North Patchogue in 2022:
North Patchogue:
$127,305
New York:
$68,770
Number of families with income $20k - 30k:
North Patchogue:
1.4% (5)
State:
8.0% (68,048)
Number of families with income $40k - 50k:
North Patchogue:
16.5% (55)
State:
7.4% (62,941)
Number of families with income $60k - 75k:
North Patchogue:
3.7% (12)
State:
9.3% (78,564)
Number of families with income $75k - 100k:
North Patchogue:
11.9% (39)
State:
12.6% (106,685)
Number of families with income $100k - 125k:
North Patchogue:
17.4% (58)
State:
9.4% (79,139)
Number of families with income $125k - 150k:
North Patchogue:
21.1% (70)
State:
6.9% (58,255)
Number of families with income $150k - 200k:
North Patchogue:
19.7% (65)
State:
8.3% (69,877)
Number of families with income > $200k:
North Patchogue:
8.3% (27)
State:
9.3% (78,555)
Median non-family income in North Patchogue in 2022:
North Patchogue:
$106,443
State:
$34,000
Median per capita income in North Patchogue in 2022:
North Patchogue:
$30,036
State:
$29,761
Change in median per capita income between 2000 and 2022:
North Patchogue, New York:
+128.4%
New York:
+132.7%
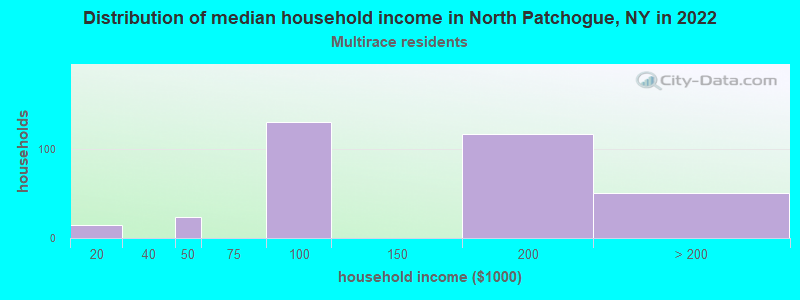
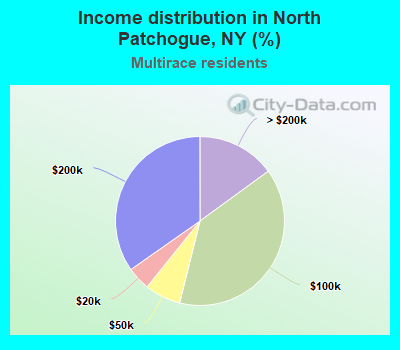
Income statistics for Multirace residents
Number of households with income < $10k:
North Patchogue:
0.0% (0)
State:
8.9% (57,924)
Number of households with income $10k - 20k:
North Patchogue:
4.5% (15)
State:
8.7% (56,590)
Number of households with income $20k - 30k:
North Patchogue:
0.0% (0)
State:
7.1% (46,287)
Number of households with income $30k - 40k:
North Patchogue:
0.0% (0)
State:
6.9% (45,132)
Number of households with income $40k - 50k:
North Patchogue:
6.9% (23)
State:
5.8% (37,946)
Number of households with income $50k - 60k:
North Patchogue:
0.0% (0)
New York:
5.6% (36,410)
Number of households with income $60k - 75k:
North Patchogue:
0.0% (0)
State:
7.8% (50,819)
Number of households with income $75k - 100k:
North Patchogue:
38.9% (130)
New York:
11.7% (76,024)
Number of households with income $100k - 125k:
North Patchogue:
0.0% (0)
State:
9.3% (60,635)
Number of households with income $125k - 150k:
North Patchogue:
0.0% (0)
State:
6.2% (40,533)
Number of households with income $150k - 200k:
North Patchogue:
34.7% (116)
State:
8.6% (56,409)
Number of households with income > $200k:
North Patchogue:
15.0% (50)
New York:
13.4% (87,442)
Aggregate household income in North Patchogue in 2022: $41,543,207
Median per capita income in North Patchogue in 2022:
North Patchogue:
$34,165
State:
$36,931
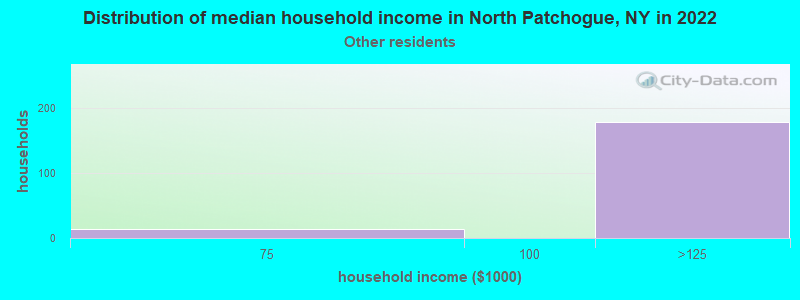
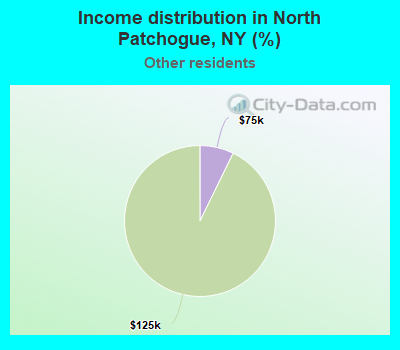
Income statistics for other residents
Median household income in North Patchogue, NY in 2022:
North Patchogue:
$106,823
State:
$56,210
Number of households with income < $10k:
North Patchogue:
0.0% (0)
State:
10.3% (69,252)
Number of households with income $10k - 20k:
North Patchogue:
0.0% (0)
State:
11.0% (73,890)
Number of households with income $20k - 30k:
North Patchogue:
0.0% (0)
New York:
8.8% (59,096)
Number of households with income $30k - 40k:
North Patchogue:
0.0% (0)
State:
8.1% (54,418)
Number of households with income $40k - 50k:
North Patchogue:
0.0% (0)
State:
7.3% (49,042)
Number of households with income $50k - 60k:
North Patchogue:
0.0% (0)
New York:
6.5% (43,945)
Number of households with income $60k - 75k:
North Patchogue:
7.3% (14)
State:
9.5% (64,087)
Number of households with income $75k - 100k:
North Patchogue:
0.0% (0)
State:
10.9% (73,094)
Number of households with income $100k - 125k:
North Patchogue:
92.7% (179)
State:
7.9% (53,055)
Number of households with income $125k - 150k:
North Patchogue:
0.0% (0)
State:
5.9% (39,446)
Number of households with income $150k - 200k:
North Patchogue:
0.0% (0)
State:
7.2% (48,653)
Number of households with income > $200k:
North Patchogue:
0.0% (0)
State:
6.6% (44,703)
Aggregate household income in North Patchogue in 2022: $16,218,357
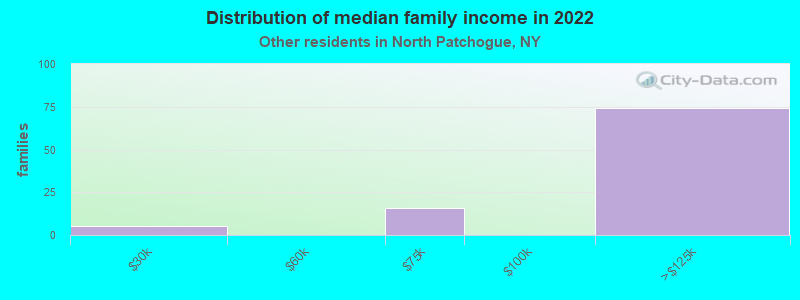
Median family income in North Patchogue in 2022:
North Patchogue:
$104,171
State:
$63,465
Number of families with income $20k - 30k:
North Patchogue:
5.4% (5)
State:
9.2% (43,198)
Number of families with income $60k - 75k:
North Patchogue:
16.5% (16)
New York:
10.1% (47,546)
Number of families with income $100k - 125k:
North Patchogue:
78.2% (74)
State:
8.6% (40,211)
Median per capita income in North Patchogue in 2022:
North Patchogue:
$23,512
State:
$26,975
Discuss North Patchogue, New York (NY) on our hugely popular New York forum.