North Salem, New York (NY) income map, earnings map, and wages data
The median household income in North Salem, NY in 2022 was $170,562, which was 53.4% greater than the median annual income of $79,557 across the entire state of New York. Compared to the median income of $100,280 in 2000 this represents an increase of 41.2%. The per capita income in 2022 was $90,464, which means an increase of 46.0% compared to 2000 when it was $48,818.
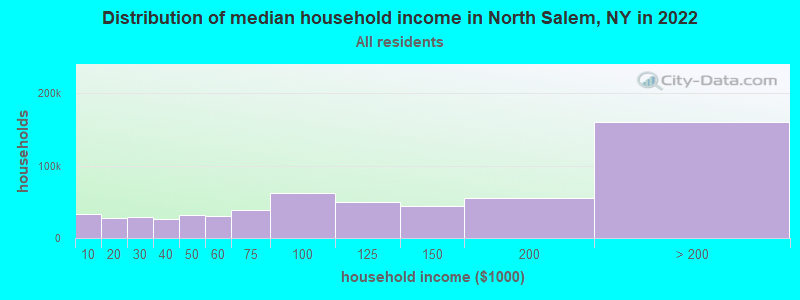
Income statistics for all residents
Median household income in North Salem, NY in 2022:| North Salem: | $170,562 |
| New York: | $79,557 |
Change in median household income between 2000 and 2022:| North Salem, New York: | +70.1% |
| State: | +83.3% |
Number of households with income < $10k:| North Salem: | 5.6% (33,012) |
| State: | 6.8% (527,598) |
Number of households with income $10k - 20k:| North Salem: | 4.7% (27,590) |
| New York: | 7.4% (574,940) |
Number of households with income $20k - 30k:| North Salem: | 4.9% (28,981) |
| State: | 6.7% (517,718) |
Number of households with income $30k - 40k:| North Salem: | 4.5% (26,231) |
| State: | 6.5% (506,674) |
Number of households with income $40k - 50k:| North Salem: | 5.4% (31,535) |
| State: | 6.1% (470,439) |
Number of households with income $50k - 60k:| North Salem: | 5.2% (30,615) |
| New York: | 5.8% (454,042) |
Number of households with income $60k - 75k:| North Salem: | 6.7% (39,292) |
| State: | 8.5% (657,508) |
Number of households with income $75k - 100k:| North Salem: | 10.5% (61,712) |
| New York: | 11.6% (899,824) |
Number of households with income $100k - 125k:| North Salem: | 8.4% (49,413) |
| State: | 9.3% (723,825) |
Number of households with income $125k - 150k:| North Salem: | 7.6% (44,688) |
| State: | 7.1% (552,420) |
Number of households with income $150k - 200k:| North Salem: | 9.4% (55,580) |
| State: | 9.4% (727,051) |
Number of households with income > $200k:| North Salem: | 27.2% (160,435) |
| New York: | 15.0% (1,162,269) |
Aggregate household income in North Salem in 2022: $7,677,418,128
Median family income in North Salem in 2022:| North Salem: | $193,718 |
| State: | $99,066 |
Median non-family income in North Salem in 2022:| North Salem: | $86,378 |
| State: | $50,181 |
Change in median non-family income between 2000 and 2022:| North Salem, New York: | +62.4% |
| New York: | +85.4% |
Median per capita income in North Salem in 2022:| North Salem: | $90,465 |
| New York: | $47,421 |
Change in median per capita income between 2000 and 2022:| North Salem, New York: | +85.3% |
| State: | +102.7% |
Income statistics for White residents
Median household income in North Salem, NY in 2022:| North Salem: | $182,680 |
| State: | $89,408 |
Change in median household income between 2000 and 2022:| North Salem, New York: | +83.3% |
| State: | +85.5% |
Number of households with income < $10k:| North Salem: | 3.4% (10,045) |
| State: | 4.8% (225,550) |
Number of households with income $10k - 20k:| North Salem: | 3.4% (10,138) |
| New York: | 6.1% (289,425) |
Number of households with income $20k - 30k:| North Salem: | 3.8% (11,060) |
| New York: | 5.9% (280,254) |
Number of households with income $30k - 40k:| North Salem: | 4.2% (12,281) |
| State: | 6.1% (288,263) |
Number of households with income $40k - 50k:| North Salem: | 4.1% (12,035) |
| New York: | 5.9% (278,079) |
Number of households with income $50k - 60k:| North Salem: | 4.1% (11,975) |
| State: | 5.7% (267,554) |
Number of households with income $60k - 75k:| North Salem: | 6.2% (18,331) |
| State: | 8.4% (398,344) |
Number of households with income $75k - 100k:| North Salem: | 9.9% (29,039) |
| New York: | 11.8% (554,841) |
Number of households with income $100k - 125k:| North Salem: | 8.5% (24,966) |
| State: | 10.0% (469,794) |
Number of households with income $125k - 150k:| North Salem: | 7.6% (22,269) |
| State: | 7.6% (360,467) |
Number of households with income $150k - 200k:| North Salem: | 10.3% (30,219) |
| State: | 10.1% (477,078) |
Number of households with income > $200k:| North Salem: | 34.6% (101,779) |
| State: | 17.6% (829,233) |
Aggregate household income in North Salem in 2022: $5,184,914,474
Median family income in North Salem in 2022:| North Salem: | $222,112 |
| State: | $115,170 |
Number of families with income < $10k:| North Salem: | 0.8% (9) |
| State: | 2.5% (68,851) |
Number of families with income $10k - 20k:| North Salem: | 0.6% (6) |
| State: | 3.0% (83,127) |
Number of families with income $20k - 30k:| North Salem: | 0.8% (8) |
| State: | 3.5% (97,578) |
Number of families with income $30k - 40k:| North Salem: | 1.4% (15) |
| State: | 4.1% (114,108) |
Number of families with income $40k - 50k:| North Salem: | 1.2% (13) |
| State: | 4.7% (130,902) |
Number of families with income $50k - 60k:| North Salem: | 2.5% (26) |
| State: | 4.9% (135,118) |
Number of families with income $60k - 75k:| North Salem: | 4.6% (49) |
| New York: | 7.8% (216,254) |
Number of families with income $75k - 100k:| North Salem: | 8.2% (87) |
| State: | 12.4% (342,382) |
Number of families with income $100k - 125k:| North Salem: | 10.7% (114) |
| New York: | 11.4% (314,917) |
Number of families with income $125k - 150k:| North Salem: | 15.4% (164) |
| State: | 9.4% (260,489) |
Number of families with income $150k - 200k:| North Salem: | 13.7% (145) |
| New York: | 13.2% (365,586) |
Number of families with income > $200k:| North Salem: | 40.2% (427) |
| State: | 23.2% (642,319) |
Median non-family income in North Salem in 2022:| North Salem: | $91,663 |
| State: | $54,783 |
Change in median non-family income between 2000 and 2022:| North Salem, New York: | +74.1% |
| State: | +87.9% |
Median per capita income in North Salem in 2022:| North Salem: | $102,863 |
| State: | $57,640 |
Change in median per capita income between 2000 and 2022:| North Salem, New York: | +108.4% |
| State: | +111.6% |
Income statistics for Black or African American residents
Median household income in North Salem, NY in 2022:| North Salem: | $172,614 |
| State: | $57,898 |
Change in median household income between 2000 and 2022:| North Salem, New York: | +68.8% |
| New York: | +84.6% |
Number of households with income < $10k:| North Salem: | 12.0% (17,165) |
| State: | 12.0% (128,500) |
Number of households with income $10k - 20k:| North Salem: | 6.0% (8,654) |
| State: | 10.0% (107,541) |
Number of households with income $20k - 30k:| North Salem: | 7.6% (10,853) |
| State: | 8.4% (90,192) |
Number of households with income $30k - 40k:| North Salem: | 5.6% (8,034) |
| State: | 7.4% (79,579) |
Number of households with income $40k - 50k:| North Salem: | 9.2% (13,163) |
| State: | 6.8% (72,491) |
Number of households with income $50k - 60k:| North Salem: | 7.0% (10,095) |
| State: | 6.7% (71,309) |
Number of households with income $60k - 75k:| North Salem: | 6.0% (8,628) |
| New York: | 8.9% (95,050) |
Number of households with income $75k - 100k:| North Salem: | 11.7% (16,794) |
| State: | 11.5% (123,569) |
Number of households with income $100k - 125k:| North Salem: | 10.5% (15,101) |
| State: | 8.1% (86,632) |
Number of households with income $125k - 150k:| North Salem: | 6.5% (9,320) |
| State: | 6.0% (64,788) |
Number of households with income $150k - 200k:| North Salem: | 6.9% (9,896) |
| State: | 7.2% (76,644) |
Number of households with income > $200k:| North Salem: | 11.0% (15,755) |
| State: | 7.0% (75,062) |
Aggregate household income in North Salem in 2022: $1,270,376
Median non-family income in North Salem in 2022:| North Salem: | $184,494 |
| New York: | $37,265 |
Change in median non-family income between 2000 and 2022:| North Salem, New York: | +80.4% |
| State: | +81.7% |
Median per capita income in North Salem in 2022:| North Salem: | $58,193 |
| State: | $31,947 |
Change in median per capita income between 2000 and 2022:| North Salem, New York: | +105.0% |
| State: | +106.1% |
Income statistics for Asian residents
Median household income in North Salem, NY in 2022:| North Salem: | $277,802 |
| State: | $89,947 |
Change in median household income between 2000 and 2022:| North Salem, New York: | +89.7% |
| State: | +98.1% |
Number of households with income < $10k:| North Salem: | 3.8% (1,414) |
| New York: | 6.9% (42,537) |
Number of households with income $10k - 20k:| North Salem: | 6.1% (2,287) |
| New York: | 7.3% (44,745) |
Number of households with income $20k - 30k:| North Salem: | 0.7% (275) |
| State: | 6.2% (38,249) |
Number of households with income $30k - 40k:| North Salem: | 2.2% (819) |
| New York: | 5.5% (33,993) |
Number of households with income $40k - 50k:| North Salem: | 2.2% (828) |
| State: | 4.8% (29,795) |
Number of households with income $50k - 60k:| North Salem: | 3.8% (1,431) |
| New York: | 5.2% (32,100) |
Number of households with income $60k - 75k:| North Salem: | 4.5% (1,665) |
| State: | 7.3% (44,615) |
Number of households with income $75k - 100k:| North Salem: | 7.8% (2,909) |
| State: | 10.8% (66,687) |
Number of households with income $100k - 125k:| North Salem: | 4.0% (1,497) |
| State: | 8.2% (50,233) |
Number of households with income $125k - 150k:| North Salem: | 8.3% (3,091) |
| New York: | 7.2% (44,299) |
Number of households with income $150k - 200k:| North Salem: | 13.5% (5,042) |
| State: | 10.4% (63,837) |
Number of households with income > $200k:| North Salem: | 43.2% (16,140) |
| State: | 20.1% (123,891) |
Aggregate household income in North Salem in 2022: $15,089,879
Median family income in North Salem in 2022:| North Salem: | $306,354 |
| New York: | $98,136 |
Number of families with income $125k - 150k:| North Salem: | 19.3% (12) |
| State: | 7.3% (31,893) |
Number of families with income > $200k:| North Salem: | 80.7% (49) |
| State: | 22.2% (97,322) |
Median per capita income in North Salem in 2022:| North Salem: | $187,874 |
| State: | $46,726 |
Change in median per capita income between 2000 and 2022:| North Salem, New York: | +114.5% |
| State: | +126.6% |
Income statistics for Hispanic or Latino residents
Median household income in North Salem, NY in 2022:| North Salem: | $188,470 |
| State: | $60,468 |
Change in median household income between 2000 and 2022:| North Salem, New York: | +75.3% |
| State: | +98.3% |
Number of households with income < $10k:| North Salem: | 7.6% (16,282) |
| State: | 9.9% (127,185) |
Number of households with income $10k - 20k:| North Salem: | 6.7% (14,293) |
| State: | 10.7% (136,699) |
Number of households with income $20k - 30k:| North Salem: | 7.2% (15,337) |
| State: | 8.1% (102,991) |
Number of households with income $30k - 40k:| North Salem: | 5.9% (12,576) |
| New York: | 7.8% (100,149) |
Number of households with income $40k - 50k:| North Salem: | 6.8% (14,467) |
| State: | 6.9% (87,760) |
Number of households with income $50k - 60k:| North Salem: | 7.7% (16,407) |
| State: | 6.3% (80,968) |
Number of households with income $60k - 75k:| North Salem: | 9.4% (19,962) |
| State: | 8.7% (110,631) |
Number of households with income $75k - 100k:| North Salem: | 11.6% (24,733) |
| State: | 11.2% (142,787) |
Number of households with income $100k - 125k:| North Salem: | 8.3% (17,707) |
| New York: | 8.2% (104,850) |
Number of households with income $125k - 150k:| North Salem: | 8.6% (18,332) |
| State: | 6.3% (80,274) |
Number of households with income $150k - 200k:| North Salem: | 6.8% (14,506) |
| State: | 7.4% (95,117) |
Number of households with income > $200k:| North Salem: | 13.3% (28,238) |
| New York: | 8.6% (109,514) |
Aggregate household income in North Salem in 2022: $14,535,585
Median family income in North Salem in 2022:| North Salem: | $221,106 |
| State: | $68,770 |
Number of families with income < $10k:| North Salem: | 3.9% (19) |
| State: | 6.9% (58,565) |
Number of families with income $10k - 20k:| North Salem: | 2.5% (12) |
| New York: | 7.0% (59,058) |
Number of families with income $20k - 30k:| North Salem: | 5.1% (25) |
| New York: | 8.0% (68,048) |
Number of families with income $30k - 40k:| North Salem: | 4.1% (20) |
| State: | 8.4% (70,668) |
Number of families with income $40k - 50k:| North Salem: | 4.8% (23) |
| New York: | 7.4% (62,941) |
Number of families with income $50k - 60k:| North Salem: | 5.4% (26) |
| New York: | 6.6% (55,592) |
Number of families with income $60k - 75k:| North Salem: | 8.9% (43) |
| State: | 9.3% (78,564) |
Number of families with income $75k - 100k:| North Salem: | 12.8% (62) |
| State: | 12.6% (106,685) |
Number of families with income $100k - 125k:| North Salem: | 13.2% (64) |
| New York: | 9.4% (79,139) |
Number of families with income $125k - 150k:| North Salem: | 18.8% (91) |
| State: | 6.9% (58,255) |
Number of families with income $150k - 200k:| North Salem: | 7.7% (37) |
| State: | 8.3% (69,877) |
Number of families with income > $200k:| North Salem: | 12.8% (62) |
| State: | 9.3% (78,555) |
Median per capita income in North Salem in 2022:| North Salem: | $77,123 |
| State: | $29,761 |
Change in median per capita income between 2000 and 2022:| North Salem, New York: | +126.5% |
| State: | +132.7% |
Income statistics for Multirace residents
Median household income in North Salem, NY in 2022:| North Salem: | $192,600 |
| State: | $73,557 |
Change in median household income between 2000 and 2022:| North Salem, New York: | +105.9% |
| State: | +123.9% |
Number of households with income < $10k:| North Salem: | 6.8% (5,961) |
| State: | 8.9% (57,924) |
Number of households with income $10k - 20k:| North Salem: | 7.8% (6,778) |
| New York: | 8.7% (56,590) |
Number of households with income $20k - 30k:| North Salem: | 6.2% (5,395) |
| New York: | 7.1% (46,287) |
Number of households with income $30k - 40k:| North Salem: | 4.4% (3,869) |
| State: | 6.9% (45,132) |
Number of households with income $40k - 50k:| North Salem: | 5.3% (4,617) |
| State: | 5.8% (37,946) |
Number of households with income $50k - 60k:| North Salem: | 8.9% (7,752) |
| State: | 5.6% (36,410) |
Number of households with income $60k - 75k:| North Salem: | 6.9% (5,993) |
| State: | 7.8% (50,819) |
Number of households with income $75k - 100k:| North Salem: | 10.5% (9,169) |
| State: | 11.7% (76,024) |
Number of households with income $100k - 125k:| North Salem: | 8.4% (7,313) |
| New York: | 9.3% (60,635) |
Number of households with income $125k - 150k:| North Salem: | 6.9% (6,016) |
| State: | 6.2% (40,533) |
Number of households with income $150k - 200k:| North Salem: | 7.7% (6,755) |
| New York: | 8.6% (56,409) |
Number of households with income > $200k:| North Salem: | 20.2% (17,595) |
| New York: | 13.4% (87,442) |
Aggregate household income in North Salem in 2022: $29,874,096
Median family income in North Salem in 2022:| North Salem: | $207,064 |
| New York: | $85,788 |
Number of families with income $75k - 100k:| North Salem: | 50.9% (81) |
| State: | 12.9% (51,995) |
Number of families with income $125k - 150k:| North Salem: | 49.1% (78) |
| State: | 7.1% (28,583) |
Median per capita income in North Salem in 2022:| North Salem: | $72,482 |
| New York: | $36,931 |
Change in median per capita income between 2000 and 2022:| North Salem, New York: | +146.4% |
| New York: | +158.8% |
Income statistics for other residents
Number of households with income < $10k:| North Salem: | 8.0% (7) |
| New York: | 10.3% (69,252) |
Number of households with income $10k - 20k:| North Salem: | 5.7% (5) |
| State: | 11.0% (73,890) |
Number of households with income $20k - 30k:| North Salem: | 8.0% (7) |
| New York: | 8.8% (59,096) |
Number of households with income $30k - 40k:| North Salem: | 5.7% (5) |
| State: | 8.1% (54,418) |
Number of households with income $40k - 50k:| North Salem: | 9.2% (8) |
| New York: | 7.3% (49,042) |
Number of households with income $50k - 60k:| North Salem: | 5.7% (5) |
| New York: | 6.5% (43,945) |
Number of households with income $60k - 75k:| North Salem: | 10.3% (9) |
| New York: | 9.5% (64,087) |
Number of households with income $75k - 100k:| North Salem: | 13.8% (12) |
| State: | 10.9% (73,094) |
Number of households with income $100k - 125k:| North Salem: | 6.9% (6) |
| New York: | 7.9% (53,055) |
Number of households with income $125k - 150k:| North Salem: | 9.2% (8) |
| State: | 5.9% (39,446) |
Number of households with income $150k - 200k:| North Salem: | 6.9% (6) |
| New York: | 7.2% (48,653) |
Number of households with income > $200k:| North Salem: | 10.3% (9) |
| State: | 6.6% (44,703) |
Aggregate household income in North Salem in 2022: $8,436,252
Median family income in North Salem in 2022:| North Salem: | $229,471 |
| New York: | $63,465 |
Number of families with income $50k - 60k:| North Salem: | 10.1% (10) |
| State: | 7.1% (33,324) |
Number of families with income $150k - 200k:| North Salem: | 89.9% (92) |
| New York: | 7.9% (37,167) |
Median per capita income in North Salem in 2022:| North Salem: | $58,330 |
| State: | $26,975 |
Change in median per capita income between 2000 and 2022:| North Salem, New York: | +147.6% |
| State: | +144.6% |