The median household income in North Tonawanda, NY in 2022 was $64,359, which was 23.6% less than the median annual income of $79,557 across the entire state of New York. Compared to the median income of $39,154 in 2000 this represents an increase of 39.2%. The per capita income in 2022 was $37,693, which means an increase of 48.9% compared to 2000 when it was $19,264.
Whole page based on the data from 2000 / 2022 when the population of North Tonawanda, New York was 33,262 / 30,285
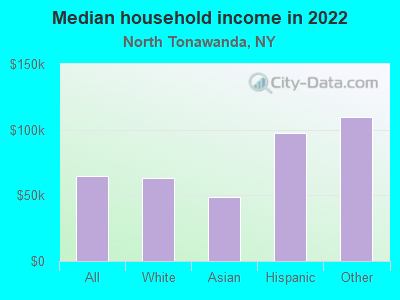
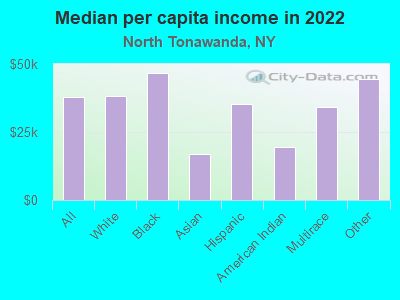
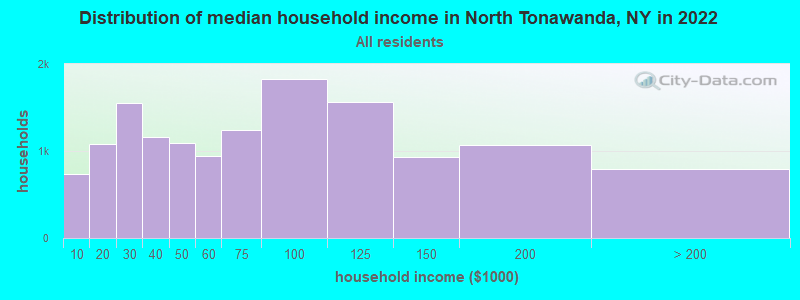
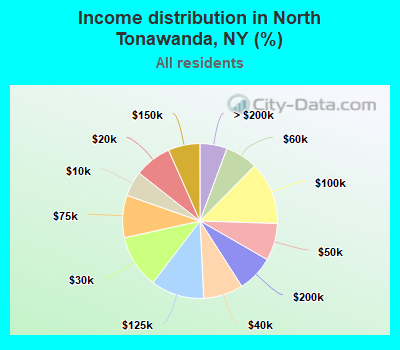
Income statistics for all residents
Median household income in North Tonawanda, NY in 2022:
North Tonawanda:
$64,360
New York:
$79,557
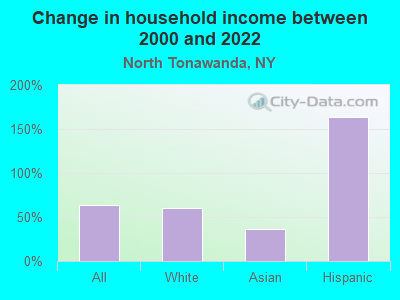
Change in median household income between 2000 and 2022:
North Tonawanda, New York:
+64.4%
New York:
+83.3%
Number of households with income < $10k:
North Tonawanda:
5.2% (734)
State:
6.8% (527,598)
Number of households with income $10k - 20k:
North Tonawanda:
7.8% (1,084)
State:
7.4% (574,940)
Number of households with income $20k - 30k:
North Tonawanda:
11.1% (1,557)
New York:
6.7% (517,718)
Number of households with income $30k - 40k:
North Tonawanda:
8.3% (1,160)
State:
6.5% (506,674)
Number of households with income $40k - 50k:
North Tonawanda:
7.8% (1,088)
State:
6.1% (470,439)
Number of households with income $50k - 60k:
North Tonawanda:
6.8% (946)
State:
5.8% (454,042)
Number of households with income $60k - 75k:
North Tonawanda:
8.9% (1,238)
State:
8.5% (657,508)
Number of households with income $75k - 100k:
North Tonawanda:
13.1% (1,830)
State:
11.6% (899,824)
Number of households with income $100k - 125k:
North Tonawanda:
11.1% (1,559)
State:
9.3% (723,825)
Number of households with income $125k - 150k:
North Tonawanda:
6.6% (926)
State:
7.1% (552,420)
Number of households with income $150k - 200k:
North Tonawanda:
7.6% (1,069)
State:
9.4% (727,051)
Number of households with income > $200k:
North Tonawanda:
5.7% (795)
New York:
15.0% (1,162,269)
Aggregate household income in North Tonawanda in 2022: $1,157,065,254
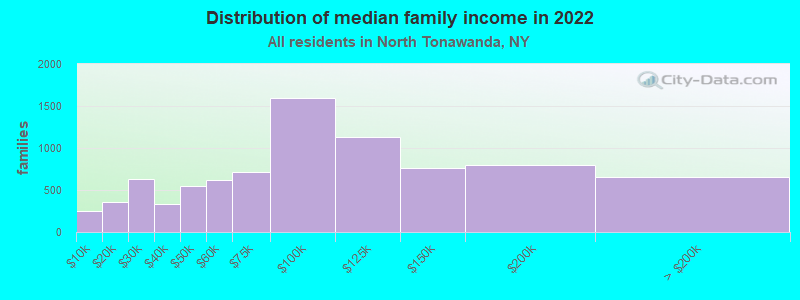
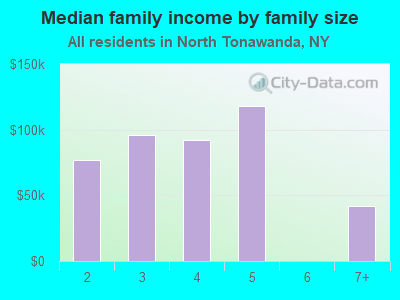
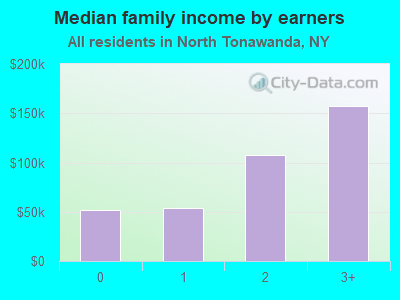
Median family income in North Tonawanda in 2022:
North Tonawanda:
$86,728
New York:
$99,066
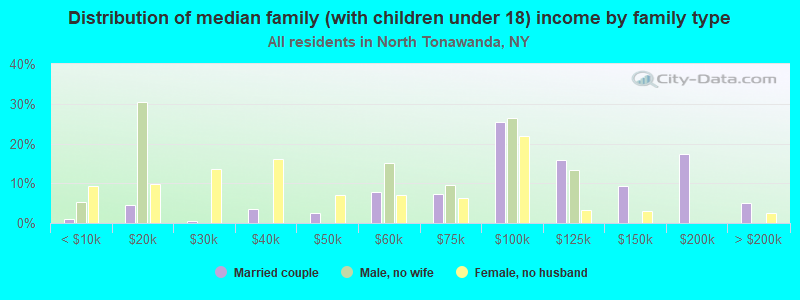
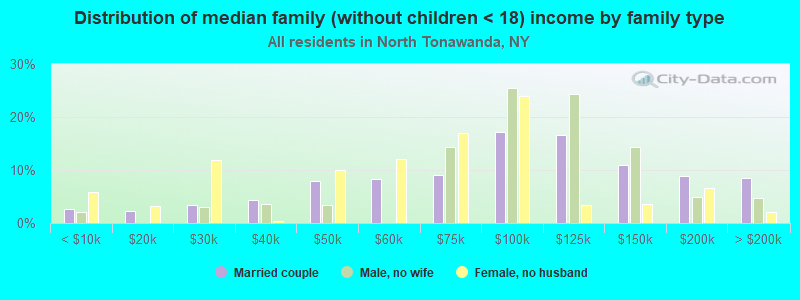
Number of families with income < $10k:
North Tonawanda:
3.0% (255)
State:
4.2% (197,409)
Number of families with income $10k - 20k:
North Tonawanda:
4.2% (352)
State:
4.3% (205,373)
Number of families with income $20k - 30k:
North Tonawanda:
7.5% (631)
State:
5.1% (241,229)
Number of families with income $30k - 40k:
North Tonawanda:
4.0% (332)
State:
5.5% (259,233)
Number of families with income $40k - 50k:
North Tonawanda:
6.5% (547)
State:
5.5% (259,113)
Number of families with income $50k - 60k:
North Tonawanda:
7.4% (621)
New York:
5.4% (255,320)
Number of families with income $60k - 75k:
North Tonawanda:
8.5% (711)
State:
8.2% (388,624)
Number of families with income $75k - 100k:
North Tonawanda:
19.0% (1,597)
New York:
12.3% (583,110)
Number of families with income $100k - 125k:
North Tonawanda:
13.5% (1,134)
New York:
10.6% (500,579)
Number of families with income $125k - 150k:
North Tonawanda:
9.0% (757)
New York:
8.5% (400,594)
Number of families with income $150k - 200k:
North Tonawanda:
9.6% (802)
State:
11.6% (551,650)
Number of families with income > $200k:
North Tonawanda:
7.8% (654)
State:
18.9% (895,998)
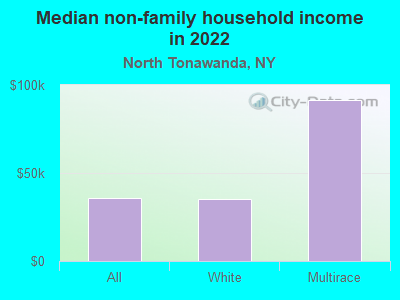
Median non-family income in North Tonawanda in 2022:
North Tonawanda:
$35,528
State:
$50,181
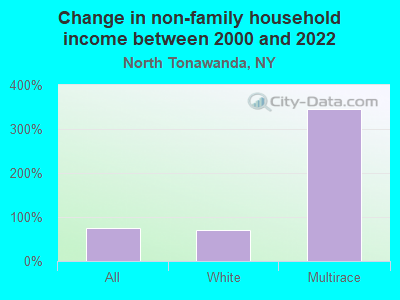
Change in median non-family income between 2000 and 2022:
North Tonawanda, New York:
+73.9%
New York:
+85.4%
Median per capita income in North Tonawanda in 2022:
North Tonawanda:
$37,693
State:
$47,421
Change in median per capita income between 2000 and 2022:
North Tonawanda, New York:
+95.7%
New York:
+102.7%
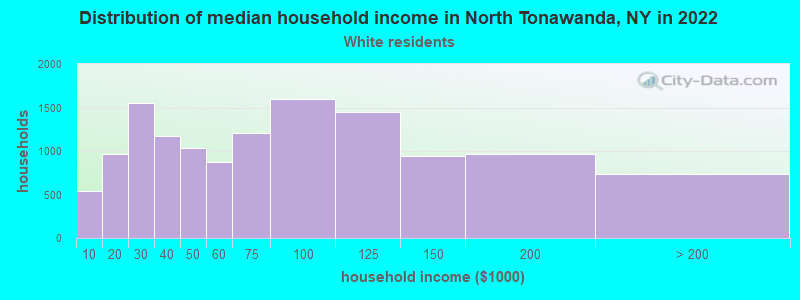
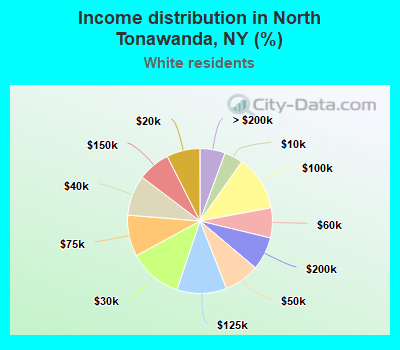
Income statistics for White residents
Median household income in North Tonawanda, NY in 2022:
North Tonawanda:
$63,300
State:
$89,408
Change in median household income between 2000 and 2022:
North Tonawanda, New York:
+60.3%
New York:
+85.5%
Number of households with income < $10k:
North Tonawanda:
4.2% (541)
State:
4.8% (225,550)
Number of households with income $10k - 20k:
North Tonawanda:
7.4% (970)
New York:
6.1% (289,425)
Number of households with income $20k - 30k:
North Tonawanda:
11.9% (1,550)
State:
5.9% (280,254)
Number of households with income $30k - 40k:
North Tonawanda:
9.0% (1,174)
State:
6.1% (288,263)
Number of households with income $40k - 50k:
North Tonawanda:
7.9% (1,031)
New York:
5.9% (278,079)
Number of households with income $50k - 60k:
North Tonawanda:
6.7% (870)
New York:
5.7% (267,554)
Number of households with income $60k - 75k:
North Tonawanda:
9.2% (1,204)
New York:
8.4% (398,344)
Number of households with income $75k - 100k:
North Tonawanda:
12.3% (1,601)
State:
11.8% (554,841)
Number of households with income $100k - 125k:
North Tonawanda:
11.1% (1,444)
State:
10.0% (469,794)
Number of households with income $125k - 150k:
North Tonawanda:
7.2% (941)
New York:
7.6% (360,467)
Number of households with income $150k - 200k:
North Tonawanda:
7.4% (960)
State:
10.1% (477,078)
Number of households with income > $200k:
North Tonawanda:
5.6% (735)
State:
17.6% (829,233)
Aggregate household income in North Tonawanda in 2022: $1,079,789,424
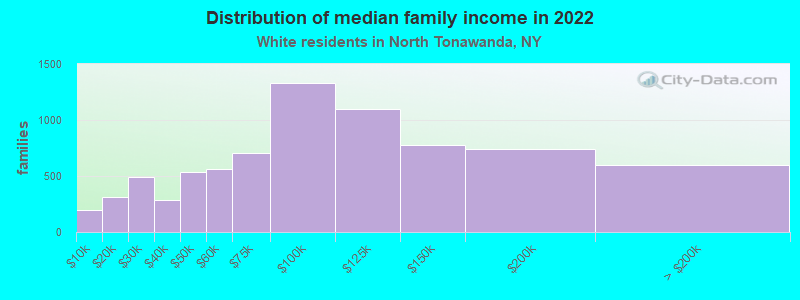
Median family income in North Tonawanda in 2022:
North Tonawanda:
$88,836
State:
$115,170
Number of families with income < $10k:
North Tonawanda:
2.5% (195)
State:
2.5% (68,851)
Number of families with income $10k - 20k:
North Tonawanda:
4.1% (310)
State:
3.0% (83,127)
Number of families with income $20k - 30k:
North Tonawanda:
6.5% (495)
New York:
3.5% (97,578)
Number of families with income $30k - 40k:
North Tonawanda:
3.8% (287)
State:
4.1% (114,108)
Number of families with income $40k - 50k:
North Tonawanda:
7.1% (540)
State:
4.7% (130,902)
Number of families with income $50k - 60k:
North Tonawanda:
7.4% (566)
State:
4.9% (135,118)
Number of families with income $60k - 75k:
North Tonawanda:
9.2% (701)
State:
7.8% (216,254)
Number of families with income $75k - 100k:
North Tonawanda:
17.4% (1,332)
State:
12.4% (342,382)
Number of families with income $100k - 125k:
North Tonawanda:
14.4% (1,102)
State:
11.4% (314,917)
Number of families with income $125k - 150k:
North Tonawanda:
10.2% (777)
State:
9.4% (260,489)
Number of families with income $150k - 200k:
North Tonawanda:
9.7% (738)
State:
13.2% (365,586)
Number of families with income > $200k:
North Tonawanda:
7.8% (598)
State:
23.2% (642,319)
Median non-family income in North Tonawanda in 2022:
North Tonawanda:
$34,966
State:
$54,783
Change in median non-family income between 2000 and 2022:
North Tonawanda, New York:
+70.2%
State:
+87.9%
Median per capita income in North Tonawanda in 2022:
North Tonawanda:
$38,273
New York:
$57,640
Change in median per capita income between 2000 and 2022:
North Tonawanda, New York:
+97.0%
State:
+111.6%
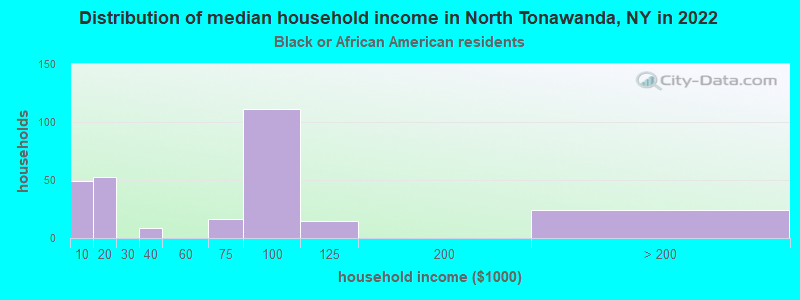
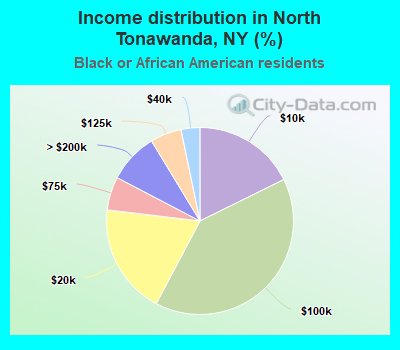
Income statistics for Black or African American residents
Number of households with income < $10k:
North Tonawanda:
17.7% (49)
New York:
12.0% (128,500)
Number of households with income $10k - 20k:
North Tonawanda:
19.1% (53)
State:
10.0% (107,541)
Number of households with income $20k - 30k:
North Tonawanda:
0.0% (0)
State:
8.4% (90,192)
Number of households with income $30k - 40k:
North Tonawanda:
3.2% (9)
State:
7.4% (79,579)
Number of households with income $40k - 50k:
North Tonawanda:
0.0% (0)
State:
6.8% (72,491)
Number of households with income $50k - 60k:
North Tonawanda:
0.0% (0)
State:
6.7% (71,309)
Number of households with income $60k - 75k:
North Tonawanda:
5.8% (16)
State:
8.9% (95,050)
Number of households with income $75k - 100k:
North Tonawanda:
40.1% (111)
State:
11.5% (123,569)
Number of households with income $100k - 125k:
North Tonawanda:
5.4% (15)
State:
8.1% (86,632)
Number of households with income $125k - 150k:
North Tonawanda:
0.0% (0)
State:
6.0% (64,788)
Number of households with income $150k - 200k:
North Tonawanda:
0.0% (0)
State:
7.2% (76,644)
Number of households with income > $200k:
North Tonawanda:
8.7% (24)
State:
7.0% (75,062)
Aggregate household income in North Tonawanda in 2022: $22,365,420
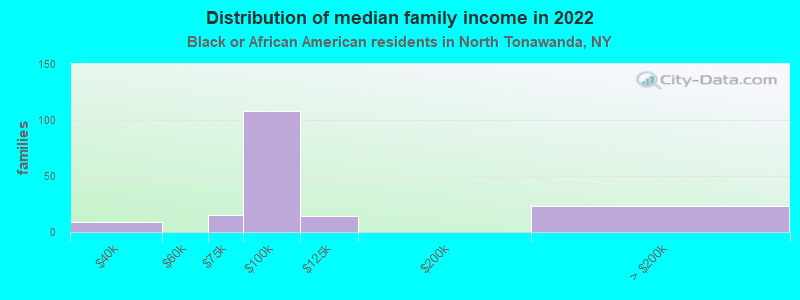
Median family income in North Tonawanda in 2022:
North Tonawanda:
$55,754
State:
$72,528
Number of families with income $30k - 40k:
North Tonawanda:
5.5% (9)
State:
6.9% (43,353)
Number of families with income $60k - 75k:
North Tonawanda:
8.7% (15)
New York:
9.2% (57,626)
Number of families with income $75k - 100k:
North Tonawanda:
63.7% (108)
State:
12.6% (78,986)
Number of families with income $100k - 125k:
North Tonawanda:
8.4% (14)
New York:
9.8% (61,670)
Number of families with income > $200k:
North Tonawanda:
13.7% (23)
State:
9.3% (58,575)
Median per capita income in North Tonawanda in 2022:
North Tonawanda:
$46,700
State:
$31,947
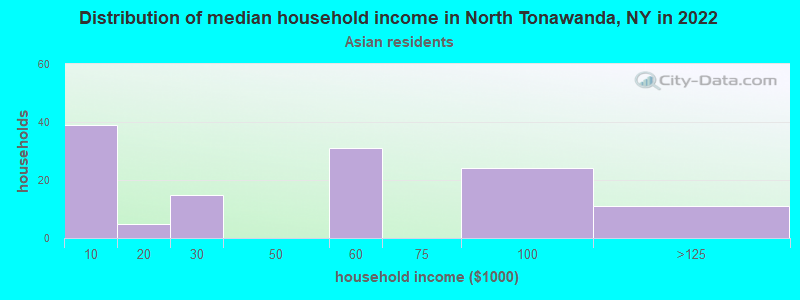
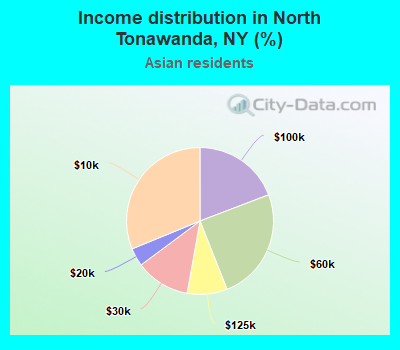
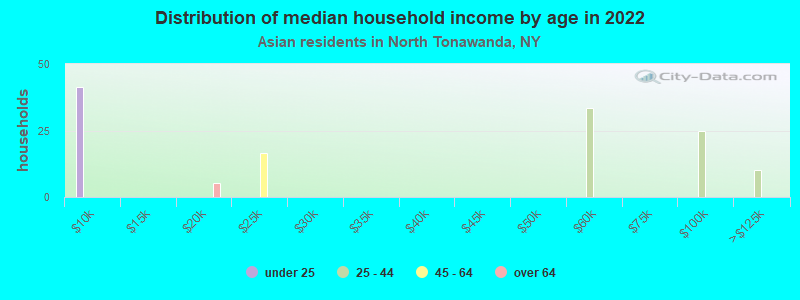
Income statistics for Asian residents
Median household income in North Tonawanda, NY in 2022:
North Tonawanda:
$48,444
New York:
$89,947
Change in median household income between 2000 and 2022:
North Tonawanda, New York:
+35.5%
State:
+98.1%
Number of households with income < $10k:
North Tonawanda:
31.2% (39)
State:
6.9% (42,537)
Number of households with income $10k - 20k:
North Tonawanda:
4.0% (5)
State:
7.3% (44,745)
Number of households with income $20k - 30k:
North Tonawanda:
12.0% (15)
State:
6.2% (38,249)
Number of households with income $30k - 40k:
North Tonawanda:
0.0% (0)
State:
5.5% (33,993)
Number of households with income $40k - 50k:
North Tonawanda:
0.0% (0)
New York:
4.8% (29,795)
Number of households with income $50k - 60k:
North Tonawanda:
24.8% (31)
New York:
5.2% (32,100)
Number of households with income $60k - 75k:
North Tonawanda:
0.0% (0)
State:
7.3% (44,615)
Number of households with income $75k - 100k:
North Tonawanda:
19.2% (24)
New York:
10.8% (66,687)
Number of households with income $100k - 125k:
North Tonawanda:
8.8% (11)
New York:
8.2% (50,233)
Number of households with income $125k - 150k:
North Tonawanda:
0.0% (0)
State:
7.2% (44,299)
Number of households with income $150k - 200k:
North Tonawanda:
0.0% (0)
State:
10.4% (63,837)
Number of households with income > $200k:
North Tonawanda:
0.0% (0)
New York:
20.1% (123,891)
Aggregate household income in North Tonawanda in 2022: $5,955,168
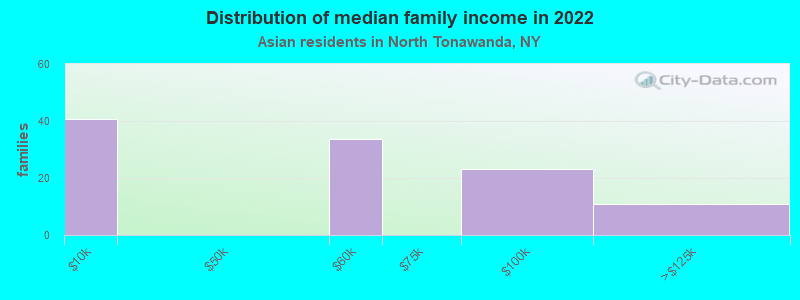
Median family income in North Tonawanda in 2022:
North Tonawanda:
$58,733
State:
$98,136
Number of families with income < $10k:
North Tonawanda:
37.4% (41)
State:
4.1% (18,020)
Number of families with income $50k - 60k:
North Tonawanda:
31.0% (34)
State:
5.5% (24,015)
Number of families with income $75k - 100k:
North Tonawanda:
21.4% (23)
State:
10.7% (46,726)
Number of families with income $100k - 125k:
North Tonawanda:
10.1% (11)
State:
8.6% (37,796)
Median per capita income in North Tonawanda in 2022:
North Tonawanda:
$16,982
New York:
$46,726
Change in median per capita income between 2000 and 2022:
North Tonawanda, New York:
+5.2%
State:
+126.6%
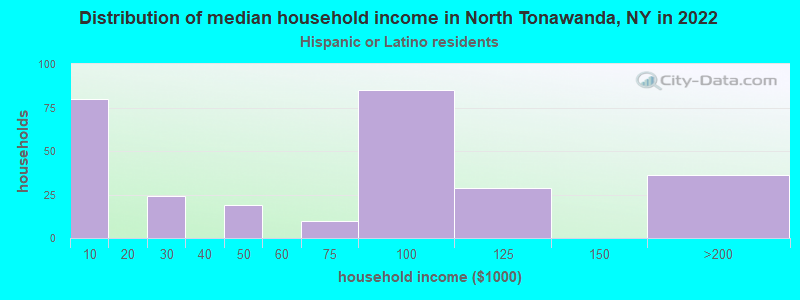
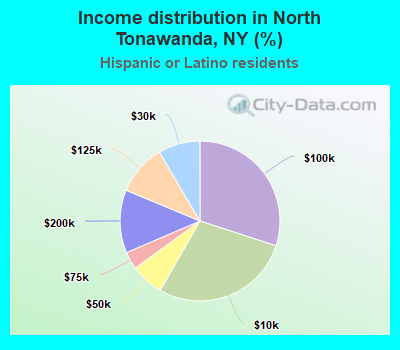
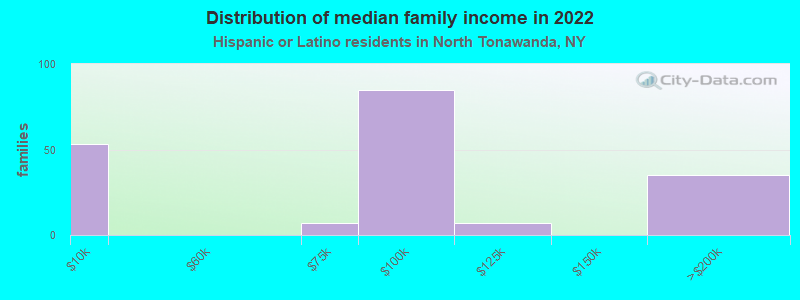
Income statistics for Hispanic or Latino residents
Median household income in North Tonawanda, NY in 2022:
North Tonawanda:
$97,678
State:
$60,468
Number of households with income < $10k:
North Tonawanda:
28.3% (80)
State:
9.9% (127,185)
Number of households with income $10k - 20k:
North Tonawanda:
0.0% (0)
State:
10.7% (136,699)
Number of households with income $20k - 30k:
North Tonawanda:
8.5% (24)
State:
8.1% (102,991)
Number of households with income $30k - 40k:
North Tonawanda:
0.0% (0)
State:
7.8% (100,149)
Number of households with income $40k - 50k:
North Tonawanda:
6.7% (19)
State:
6.9% (87,760)
Number of households with income $50k - 60k:
North Tonawanda:
0.0% (0)
State:
6.3% (80,968)
Number of households with income $60k - 75k:
North Tonawanda:
3.5% (10)
State:
8.7% (110,631)
Number of households with income $75k - 100k:
North Tonawanda:
30.0% (85)
State:
11.2% (142,787)
Number of households with income $100k - 125k:
North Tonawanda:
10.2% (29)
New York:
8.2% (104,850)
Number of households with income $125k - 150k:
North Tonawanda:
0.0% (0)
State:
6.3% (80,274)
Number of households with income $150k - 200k:
North Tonawanda:
12.7% (36)
New York:
7.4% (95,117)
Number of households with income > $200k:
North Tonawanda:
0.0% (0)
State:
8.6% (109,514)
Aggregate household income in North Tonawanda in 2022: $23,587,937
Median family income in North Tonawanda in 2022:
North Tonawanda:
$91,018
State:
$68,770
Number of families with income < $10k:
North Tonawanda:
28.4% (53)
State:
6.9% (58,565)
Number of families with income $60k - 75k:
North Tonawanda:
3.8% (7)
State:
9.3% (78,564)
Number of families with income $75k - 100k:
North Tonawanda:
45.3% (85)
New York:
12.6% (106,685)
Number of families with income $100k - 125k:
North Tonawanda:
3.8% (7)
State:
9.4% (79,139)
Number of families with income $150k - 200k:
North Tonawanda:
18.7% (35)
State:
8.3% (69,877)
Median per capita income in North Tonawanda in 2022:
North Tonawanda:
$35,453
State:
$29,761
Income statistics for American Indian and Alaska Native residents
Median per capita income in North Tonawanda in 2022:
North Tonawanda:
$19,669
New York:
$25,837
Change in median per capita income between 2000 and 2022:
North Tonawanda, New York:
+3.0%
State:
+99.6%
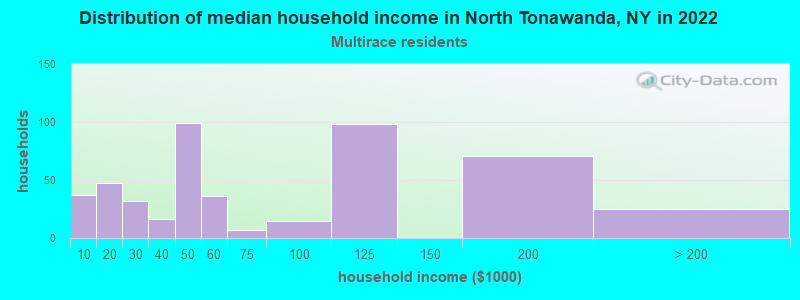
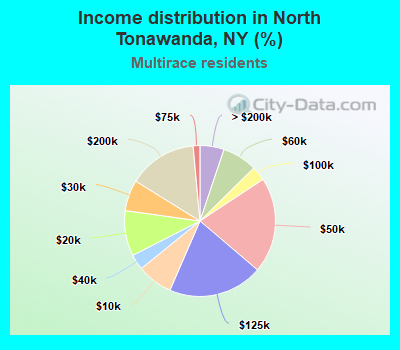
Income statistics for Multirace residents
Number of households with income < $10k:
North Tonawanda:
7.7% (37)
New York:
8.9% (57,924)
Number of households with income $10k - 20k:
North Tonawanda:
9.7% (47)
State:
8.7% (56,590)
Number of households with income $20k - 30k:
North Tonawanda:
6.6% (32)
State:
7.1% (46,287)
Number of households with income $30k - 40k:
North Tonawanda:
3.3% (16)
State:
6.9% (45,132)
Number of households with income $40k - 50k:
North Tonawanda:
20.5% (99)
State:
5.8% (37,946)
Number of households with income $50k - 60k:
North Tonawanda:
7.5% (36)
State:
5.6% (36,410)
Number of households with income $60k - 75k:
North Tonawanda:
1.4% (7)
New York:
7.8% (50,819)
Number of households with income $75k - 100k:
North Tonawanda:
3.1% (15)
State:
11.7% (76,024)
Number of households with income $100k - 125k:
North Tonawanda:
20.3% (98)
New York:
9.3% (60,635)
Number of households with income $125k - 150k:
North Tonawanda:
0.0% (0)
State:
6.2% (40,533)
Number of households with income $150k - 200k:
North Tonawanda:
14.7% (71)
State:
8.6% (56,409)
Number of households with income > $200k:
North Tonawanda:
5.2% (25)
State:
13.4% (87,442)
Aggregate household income in North Tonawanda in 2022: $38,023,047
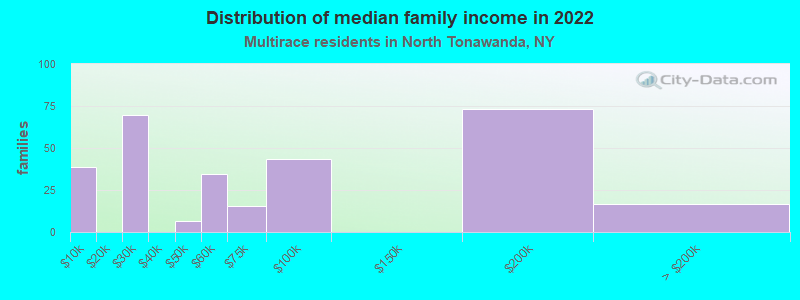
Median family income in North Tonawanda in 2022:
North Tonawanda:
$53,670
New York:
$85,788
Number of families with income < $10k:
North Tonawanda:
12.9% (38)
State:
6.2% (24,976)
Number of families with income $20k - 30k:
North Tonawanda:
23.4% (70)
State:
6.6% (26,534)
Number of families with income $40k - 50k:
North Tonawanda:
2.1% (6)
New York:
6.1% (24,694)
Number of families with income $50k - 60k:
North Tonawanda:
11.6% (34)
State:
5.5% (22,002)
Number of families with income $60k - 75k:
North Tonawanda:
5.2% (15)
State:
7.6% (30,653)
Number of families with income $75k - 100k:
North Tonawanda:
14.6% (43)
State:
12.9% (51,995)
Number of families with income $150k - 200k:
North Tonawanda:
24.6% (73)
State:
9.4% (37,771)
Number of families with income > $200k:
North Tonawanda:
5.6% (17)
State:
15.7% (62,951)
Median non-family income in North Tonawanda in 2022:
North Tonawanda:
$91,338
State:
$46,403
Median per capita income in North Tonawanda in 2022:
North Tonawanda:
$34,344
New York:
$36,931
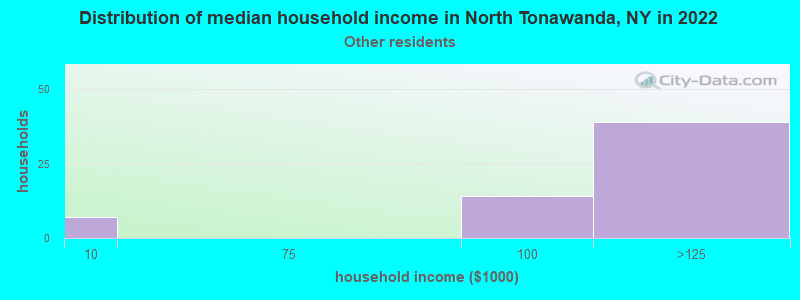
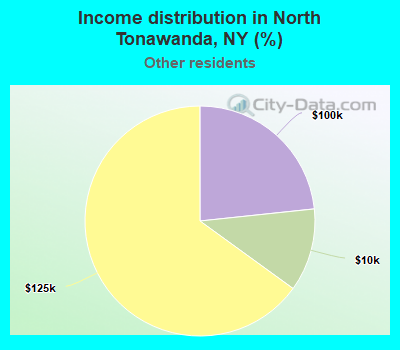
Income statistics for other residents
Median household income in North Tonawanda, NY in 2022:
North Tonawanda:
$109,664
New York:
$56,210
Number of households with income < $10k:
North Tonawanda:
11.7% (7)
State:
10.3% (69,252)
Number of households with income $10k - 20k:
North Tonawanda:
0.0% (0)
State:
11.0% (73,890)
Number of households with income $20k - 30k:
North Tonawanda:
0.0% (0)
New York:
8.8% (59,096)
Number of households with income $30k - 40k:
North Tonawanda:
0.0% (0)
State:
8.1% (54,418)
Number of households with income $40k - 50k:
North Tonawanda:
0.0% (0)
New York:
7.3% (49,042)
Number of households with income $50k - 60k:
North Tonawanda:
0.0% (0)
State:
6.5% (43,945)
Number of households with income $60k - 75k:
North Tonawanda:
0.0% (0)
New York:
9.5% (64,087)
Number of households with income $75k - 100k:
North Tonawanda:
23.3% (14)
State:
10.9% (73,094)
Number of households with income $100k - 125k:
North Tonawanda:
65.0% (39)
State:
7.9% (53,055)
Number of households with income $125k - 150k:
North Tonawanda:
0.0% (0)
New York:
5.9% (39,446)
Number of households with income $150k - 200k:
North Tonawanda:
0.0% (0)
State:
7.2% (48,653)
Number of households with income > $200k:
North Tonawanda:
0.0% (0)
New York:
6.6% (44,703)
Aggregate household income in North Tonawanda in 2022: $6,880,876
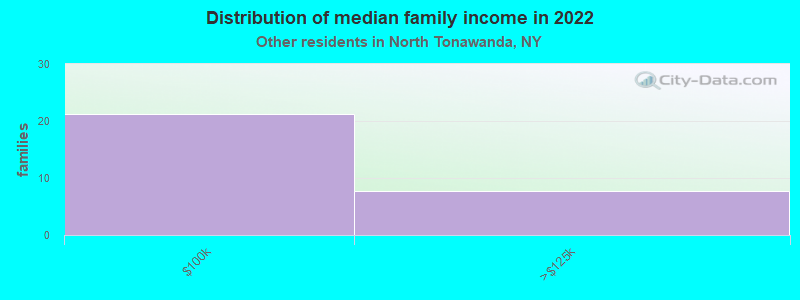
Median family income in North Tonawanda in 2022:
North Tonawanda:
$102,102
State:
$63,465
Number of families with income $75k - 100k:
North Tonawanda:
73.2% (21)
State:
12.5% (58,659)
Number of families with income $100k - 125k:
North Tonawanda:
26.8% (8)
New York:
8.6% (40,211)
Median per capita income in North Tonawanda in 2022:
North Tonawanda:
$44,631
State:
$26,975
Discuss North Tonawanda, New York (NY) on our hugely popular New York forum.