Northeast Rockwall, Texas (TX) income map, earnings map, and wages data
The median household income in Northeast Rockwall, TX in 2022 was $89,659, which was 19.4% greater than the median annual income of $72,284 across the entire state of Texas. Compared to the median income of $47,206 in 2000 this represents an increase of 47.3%. The per capita income in 2022 was $32,252, which means an increase of 44.1% compared to 2000 when it was $18,045.
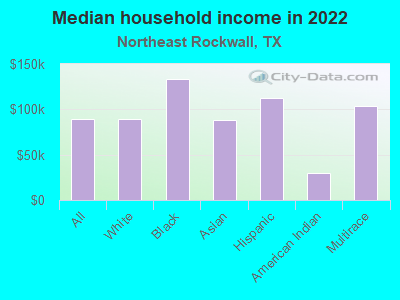
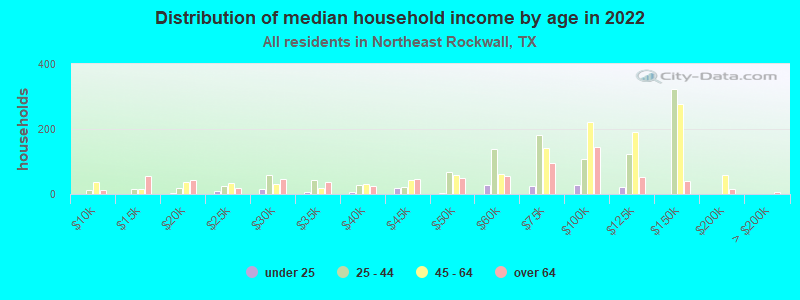
Income statistics for all residents
Median household income in Northeast Rockwall, TX in 2022:| Northeast Rockwall: | $89,659 |
| State: | $72,284 |
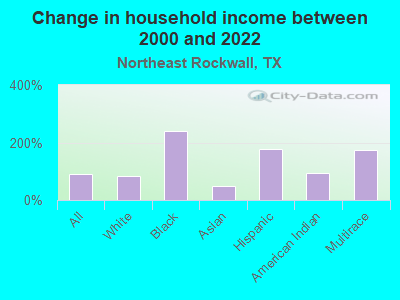
Change in median household income between 2000 and 2022:| Northeast Rockwall, Texas: | +89.9% |
| State: | +81.0% |
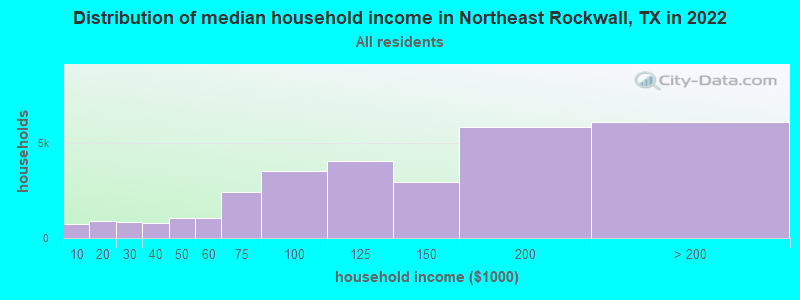
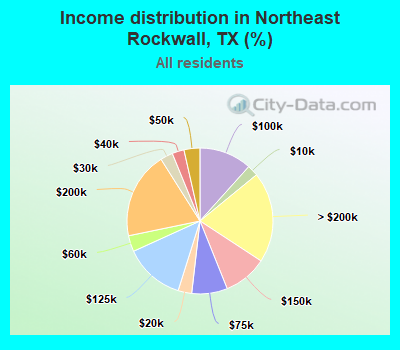
Number of households with income < $10k:| Northeast Rockwall: | 2.5% (748) |
| Texas: | 5.5% (611,011) |
Number of households with income $10k - 20k:| Northeast Rockwall: | 3.0% (917) |
| State: | 6.7% (743,157) |
Number of households with income $20k - 30k:| Northeast Rockwall: | 2.8% (843) |
| State: | 7.2% (803,381) |
Number of households with income $30k - 40k:| Northeast Rockwall: | 2.7% (808) |
| Texas: | 7.8% (866,080) |
Number of households with income $40k - 50k:| Northeast Rockwall: | 3.5% (1,069) |
| Texas: | 7.3% (810,440) |
Number of households with income $50k - 60k:| Northeast Rockwall: | 3.5% (1,076) |
| State: | 7.2% (799,783) |
Number of households with income $60k - 75k:| Northeast Rockwall: | 7.9% (2,404) |
| State: | 9.9% (1,095,384) |
Number of households with income $75k - 100k:| Northeast Rockwall: | 11.6% (3,539) |
| State: | 12.8% (1,419,057) |
Number of households with income $100k - 125k:| Northeast Rockwall: | 13.4% (4,061) |
| State: | 9.5% (1,054,577) |
Number of households with income $125k - 150k:| Northeast Rockwall: | 9.7% (2,949) |
| Texas: | 6.7% (741,518) |
Number of households with income $150k - 200k:| Northeast Rockwall: | 19.3% (5,865) |
| Texas: | 8.7% (961,776) |
Number of households with income > $200k:| Northeast Rockwall: | 20.1% (6,116) |
| State: | 10.7% (1,181,544) |
Aggregate household income in Northeast Rockwall in 2022: $590,157,309
Median family income in Northeast Rockwall in 2022:| Northeast Rockwall: | $100,207 |
| Texas: | $86,267 |
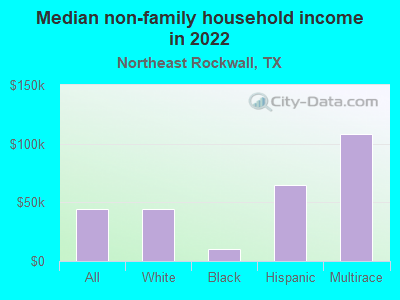
Median non-family income in Northeast Rockwall in 2022:| Northeast Rockwall: | $44,668 |
| State: | $45,999 |
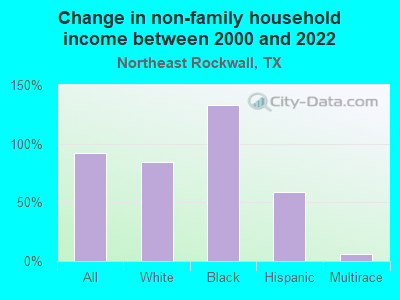
Change in median non-family income between 2000 and 2022:| Northeast Rockwall, Texas: | +92.4% |
| State: | +79.5% |
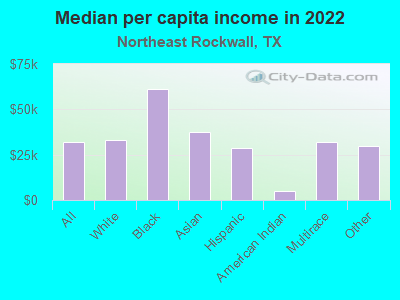
Median per capita income in Northeast Rockwall in 2022:| Northeast Rockwall: | $32,252 |
| Texas: | $38,123 |
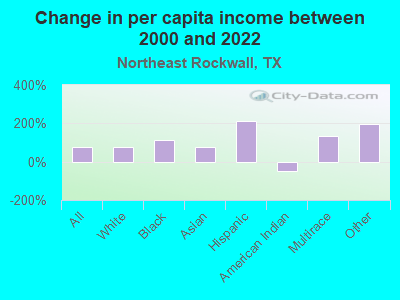
Change in median per capita income between 2000 and 2022:| Northeast Rockwall, Texas: | +78.7% |
| State: | +94.3% |
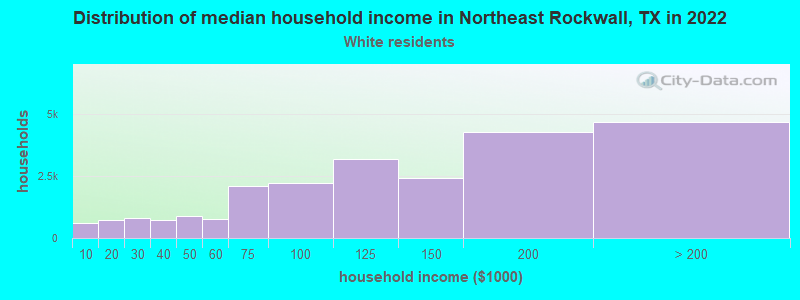
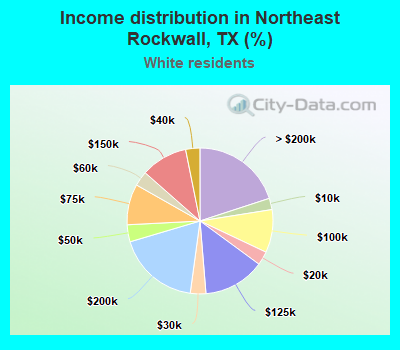
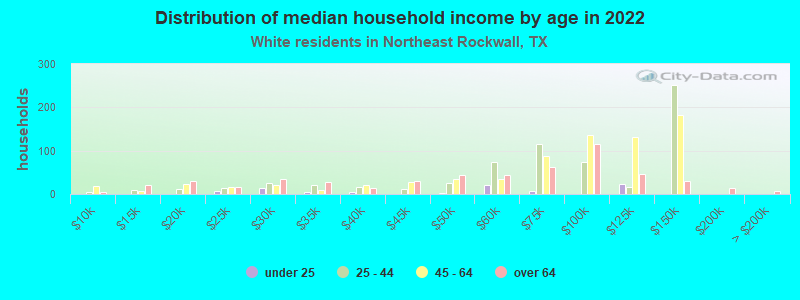
Income statistics for White residents
Median household income in Northeast Rockwall, TX in 2022:| Northeast Rockwall: | $89,673 |
| State: | $82,032 |
Change in median household income between 2000 and 2022:| Northeast Rockwall, Texas: | +84.2% |
| State: | +91.0% |
Number of households with income < $10k:| Northeast Rockwall: | 2.5% (590) |
| State: | 4.7% (273,716) |
Number of households with income $10k - 20k:| Northeast Rockwall: | 3.0% (713) |
| State: | 5.5% (322,702) |
Number of households with income $20k - 30k:| Northeast Rockwall: | 3.4% (809) |
| State: | 6.2% (363,947) |
Number of households with income $30k - 40k:| Northeast Rockwall: | 3.2% (740) |
| State: | 6.8% (399,275) |
Number of households with income $40k - 50k:| Northeast Rockwall: | 3.8% (888) |
| State: | 6.5% (383,417) |
Number of households with income $50k - 60k:| Northeast Rockwall: | 3.3% (767) |
| State: | 6.6% (388,535) |
Number of households with income $60k - 75k:| Northeast Rockwall: | 9.0% (2,122) |
| State: | 9.7% (566,295) |
Number of households with income $75k - 100k:| Northeast Rockwall: | 9.5% (2,237) |
| State: | 13.0% (760,276) |
Number of households with income $100k - 125k:| Northeast Rockwall: | 13.6% (3,199) |
| Texas: | 10.2% (597,596) |
Number of households with income $125k - 150k:| Northeast Rockwall: | 10.4% (2,430) |
| State: | 7.4% (436,830) |
Number of households with income $150k - 200k:| Northeast Rockwall: | 18.2% (4,283) |
| Texas: | 9.9% (583,067) |
Number of households with income > $200k:| Northeast Rockwall: | 20.0% (4,691) |
| State: | 13.5% (792,647) |
Aggregate household income in Northeast Rockwall in 2022: $412,728,156
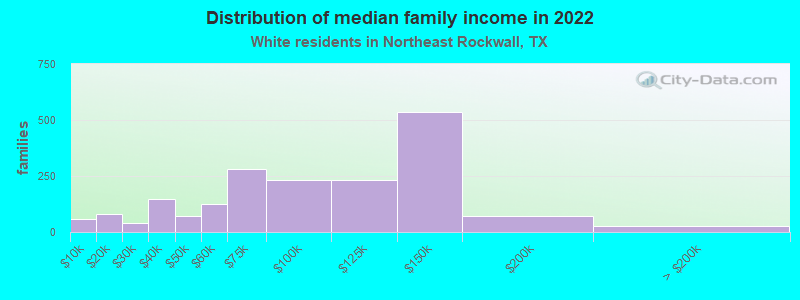
Median family income in Northeast Rockwall in 2022:| Northeast Rockwall: | $104,225 |
| Texas: | $101,788 |
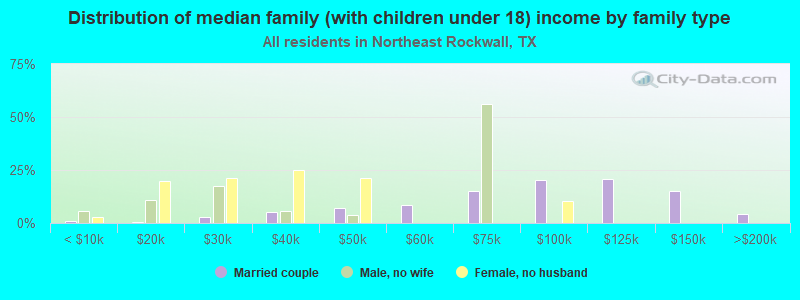
Number of families with income < $10k:| Northeast Rockwall: | 3.1% (59) |
| State: | 2.8% (108,142) |
Number of families with income $10k - 20k:| Northeast Rockwall: | 4.3% (82) |
| State: | 2.9% (113,421) |
Number of families with income $20k - 30k:| Northeast Rockwall: | 2.0% (39) |
| State: | 4.1% (157,688) |
Number of families with income $30k - 40k:| Northeast Rockwall: | 7.7% (147) |
| State: | 5.2% (198,847) |
Number of families with income $40k - 50k:| Northeast Rockwall: | 3.7% (70) |
| State: | 5.6% (216,490) |
Number of families with income $50k - 60k:| Northeast Rockwall: | 6.7% (127) |
| State: | 5.7% (220,689) |
Number of families with income $60k - 75k:| Northeast Rockwall: | 14.9% (283) |
| Texas: | 9.0% (346,106) |
Number of families with income $75k - 100k:| Northeast Rockwall: | 12.1% (231) |
| State: | 13.7% (527,363) |
Number of families with income $100k - 125k:| Northeast Rockwall: | 12.2% (233) |
| State: | 11.6% (448,411) |
Number of families with income $125k - 150k:| Northeast Rockwall: | 28.0% (534) |
| State: | 9.2% (355,798) |
Number of families with income $150k - 200k:| Northeast Rockwall: | 3.8% (73) |
| State: | 12.5% (480,185) |
Number of families with income > $200k:| Northeast Rockwall: | 1.4% (27) |
| State: | 17.6% (677,490) |
Median non-family income in Northeast Rockwall in 2022:| Northeast Rockwall: | $44,610 |
| State: | $50,587 |
Change in median non-family income between 2000 and 2022:| Northeast Rockwall, Texas: | +83.6% |
| Texas: | +87.7% |
Median per capita income in Northeast Rockwall in 2022:| Northeast Rockwall: | $33,163 |
| State: | $47,740 |
Change in median per capita income between 2000 and 2022:| Northeast Rockwall, Texas: | +79.1% |
| State: | +114.3% |
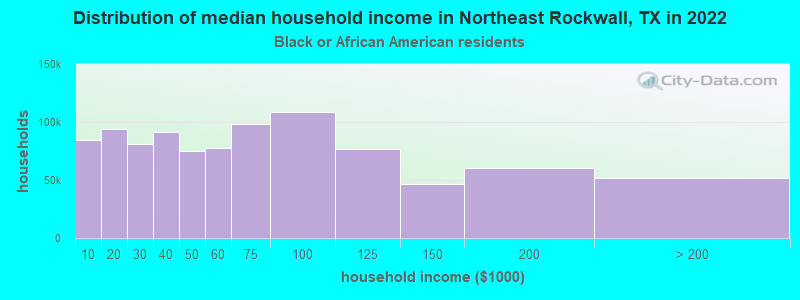
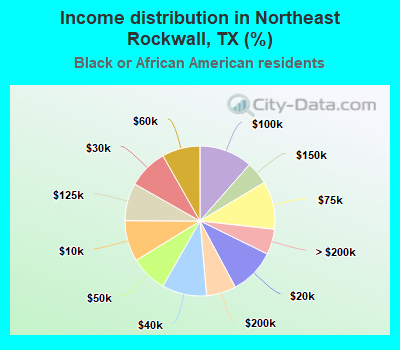
Income statistics for Black or African American residents
Median household income in Northeast Rockwall, TX in 2022:| Northeast Rockwall: | $133,066 |
| State: | $55,759 |
Number of households with income < $10k:| Northeast Rockwall: | 8.9% (84,145) |
| State: | 8.9% (126,378) |
Number of households with income $10k - 20k:| Northeast Rockwall: | 9.9% (94,073) |
| State: | 9.9% (140,369) |
Number of households with income $20k - 30k:| Northeast Rockwall: | 8.5% (80,935) |
| Texas: | 8.5% (120,639) |
Number of households with income $30k - 40k:| Northeast Rockwall: | 9.7% (91,506) |
| State: | 9.7% (137,517) |
Number of households with income $40k - 50k:| Northeast Rockwall: | 7.9% (75,174) |
| State: | 8.0% (112,973) |
Number of households with income $50k - 60k:| Northeast Rockwall: | 8.2% (77,894) |
| State: | 8.3% (117,156) |
Number of households with income $60k - 75k:| Northeast Rockwall: | 10.4% (98,330) |
| State: | 10.4% (147,462) |
Number of households with income $75k - 100k:| Northeast Rockwall: | 11.5% (108,573) |
| State: | 11.5% (162,718) |
Number of households with income $100k - 125k:| Northeast Rockwall: | 8.1% (77,088) |
| Texas: | 8.2% (115,829) |
Number of households with income $125k - 150k:| Northeast Rockwall: | 4.9% (46,714) |
| Texas: | 4.9% (69,556) |
Number of households with income $150k - 200k:| Northeast Rockwall: | 6.4% (60,502) |
| State: | 6.4% (90,701) |
Number of households with income > $200k:| Northeast Rockwall: | 5.5% (51,979) |
| Texas: | 5.5% (77,988) |
Aggregate household income in Northeast Rockwall in 2022: $130,504,079
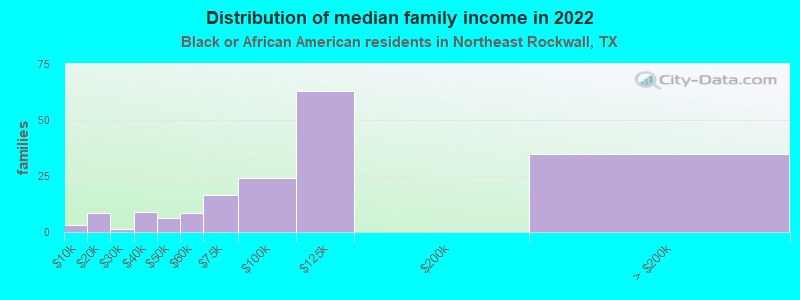
Median family income in Northeast Rockwall in 2022:| Northeast Rockwall: | $129,101 |
| State: | $69,134 |
Number of families with income < $10k:| Northeast Rockwall: | 1.9% (3) |
| Texas: | 6.8% (55,625) |
Number of families with income $10k - 20k:| Northeast Rockwall: | 4.9% (9) |
| State: | 6.8% (55,300) |
Number of families with income $20k - 30k:| Northeast Rockwall: | 0.8% (1) |
| State: | 7.1% (57,877) |
Number of families with income $30k - 40k:| Northeast Rockwall: | 5.0% (9) |
| State: | 8.5% (68,776) |
Number of families with income $40k - 50k:| Northeast Rockwall: | 3.5% (6) |
| Texas: | 7.1% (57,907) |
Number of families with income $50k - 60k:| Northeast Rockwall: | 4.8% (8) |
| State: | 7.3% (59,511) |
Number of families with income $60k - 75k:| Northeast Rockwall: | 9.4% (16) |
| State: | 10.1% (81,994) |
Number of families with income $75k - 100k:| Northeast Rockwall: | 13.7% (24) |
| Texas: | 12.7% (103,723) |
Number of families with income $100k - 125k:| Northeast Rockwall: | 36.0% (63) |
| State: | 9.4% (76,609) |
Number of families with income > $200k:| Northeast Rockwall: | 19.9% (35) |
| State: | 7.9% (64,439) |
Median non-family income in Northeast Rockwall in 2022:| Northeast Rockwall: | $10,403 |
| State: | $40,133 |
Change in median non-family income between 2000 and 2022:| Northeast Rockwall, Texas: | +133.0% |
| State: | +102.2% |
Median per capita income in Northeast Rockwall in 2022:| Northeast Rockwall: | $61,298 |
| State: | $30,490 |
Change in median per capita income between 2000 and 2022:| Northeast Rockwall, Texas: | +115.3% |
| State: | +113.9% |
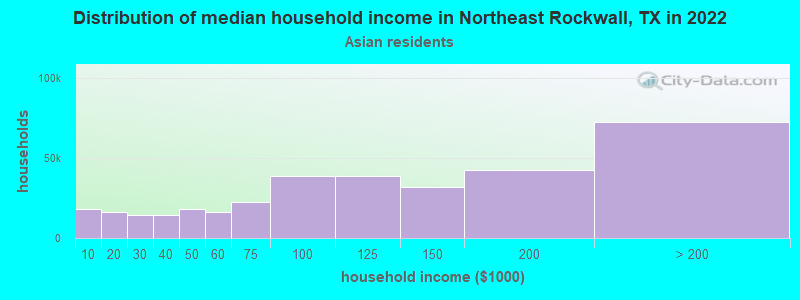
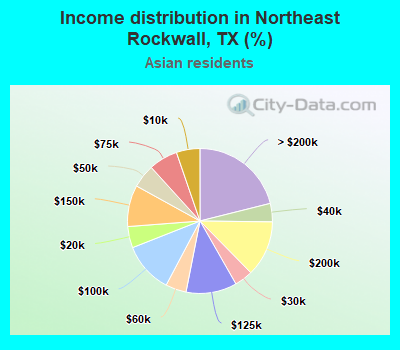
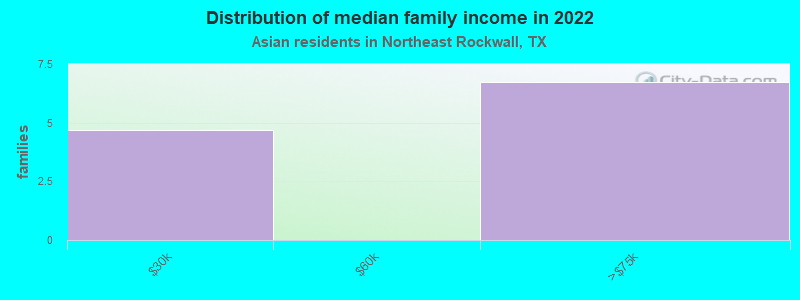
Income statistics for Asian residents
Median household income in Northeast Rockwall, TX in 2022:| Northeast Rockwall: | $88,345 |
| State: | $107,673 |
Change in median household income between 2000 and 2022:| Northeast Rockwall, Texas: | +46.6% |
| State: | +115.1% |
Number of households with income < $10k:| Northeast Rockwall: | 5.3% (18,012) |
| State: | 5.2% (29,885) |
Number of households with income $10k - 20k:| Northeast Rockwall: | 4.8% (16,298) |
| Texas: | 4.7% (27,044) |
Number of households with income $20k - 30k:| Northeast Rockwall: | 4.1% (14,046) |
| State: | 4.1% (23,363) |
Number of households with income $30k - 40k:| Northeast Rockwall: | 4.1% (14,041) |
| State: | 4.1% (23,309) |
Number of households with income $40k - 50k:| Northeast Rockwall: | 5.2% (17,951) |
| State: | 5.2% (29,826) |
Number of households with income $50k - 60k:| Northeast Rockwall: | 4.6% (15,923) |
| State: | 4.7% (26,512) |
Number of households with income $60k - 75k:| Northeast Rockwall: | 6.5% (22,239) |
| Texas: | 6.5% (36,905) |
Number of households with income $75k - 100k:| Northeast Rockwall: | 11.3% (38,672) |
| State: | 11.3% (64,350) |
Number of households with income $100k - 125k:| Northeast Rockwall: | 11.3% (38,919) |
| State: | 11.4% (64,714) |
Number of households with income $125k - 150k:| Northeast Rockwall: | 9.3% (31,728) |
| Texas: | 9.3% (52,719) |
Number of households with income $150k - 200k:| Northeast Rockwall: | 12.5% (42,709) |
| State: | 12.5% (70,953) |
Number of households with income > $200k:| Northeast Rockwall: | 21.1% (72,384) |
| State: | 21.1% (120,260) |
Aggregate household income in Northeast Rockwall in 2022: $4,480,655
Median family income in Northeast Rockwall in 2022:| Northeast Rockwall: | $67,776 |
| Texas: | $123,328 |
Median per capita income in Northeast Rockwall in 2022:| Northeast Rockwall: | $37,600 |
| Texas: | $48,626 |
Change in median per capita income between 2000 and 2022:| Northeast Rockwall, Texas: | +75.5% |
| State: | +132.0% |
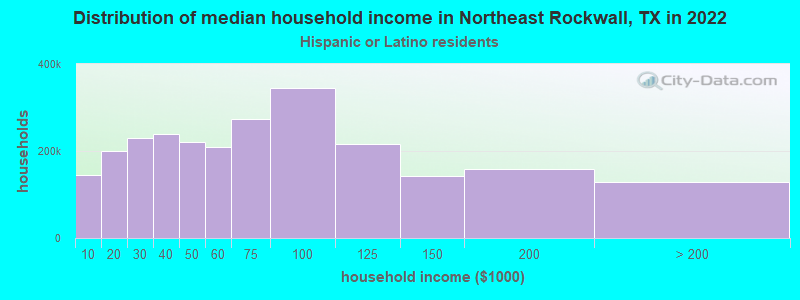
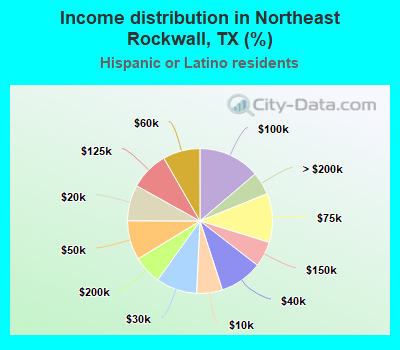
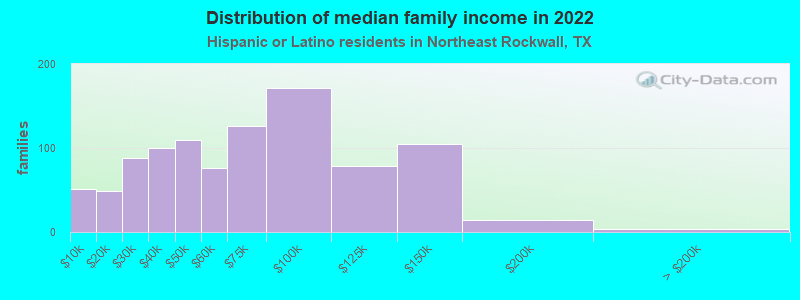
Income statistics for Hispanic or Latino residents
Median household income in Northeast Rockwall, TX in 2022:| Northeast Rockwall: | $112,376 |
| Texas: | $60,504 |
Number of households with income < $10k:| Northeast Rockwall: | 5.8% (144,419) |
| Texas: | 5.8% (213,953) |
Number of households with income $10k - 20k:| Northeast Rockwall: | 8.0% (200,852) |
| State: | 8.0% (297,456) |
Number of households with income $20k - 30k:| Northeast Rockwall: | 9.2% (229,487) |
| State: | 9.2% (340,166) |
Number of households with income $30k - 40k:| Northeast Rockwall: | 9.5% (239,263) |
| Texas: | 9.5% (354,336) |
Number of households with income $40k - 50k:| Northeast Rockwall: | 8.8% (220,664) |
| State: | 8.8% (327,013) |
Number of households with income $50k - 60k:| Northeast Rockwall: | 8.3% (208,264) |
| State: | 8.3% (308,818) |
Number of households with income $60k - 75k:| Northeast Rockwall: | 10.9% (273,442) |
| State: | 10.9% (405,109) |
Number of households with income $75k - 100k:| Northeast Rockwall: | 13.8% (345,502) |
| State: | 13.8% (511,639) |
Number of households with income $100k - 125k:| Northeast Rockwall: | 8.6% (215,922) |
| State: | 8.6% (319,728) |
Number of households with income $125k - 150k:| Northeast Rockwall: | 5.7% (142,572) |
| State: | 5.7% (210,932) |
Number of households with income $150k - 200k:| Northeast Rockwall: | 6.4% (159,226) |
| State: | 6.4% (236,055) |
Number of households with income > $200k:| Northeast Rockwall: | 5.1% (127,836) |
| State: | 5.1% (189,259) |
Aggregate household income in Northeast Rockwall in 2022: $185,933,871
Median family income in Northeast Rockwall in 2022:| Northeast Rockwall: | $100,610 |
| Texas: | $65,080 |
Number of families with income < $10k:| Northeast Rockwall: | 5.3% (51) |
| Texas: | 5.3% (147,493) |
Number of families with income $10k - 20k:| Northeast Rockwall: | 5.0% (49) |
| State: | 6.3% (174,531) |
Number of families with income $20k - 30k:| Northeast Rockwall: | 9.0% (88) |
| State: | 8.6% (238,528) |
Number of families with income $30k - 40k:| Northeast Rockwall: | 10.3% (100) |
| State: | 9.1% (251,999) |
Number of families with income $40k - 50k:| Northeast Rockwall: | 11.2% (109) |
| State: | 8.6% (240,188) |
Number of families with income $50k - 60k:| Northeast Rockwall: | 7.8% (76) |
| State: | 8.0% (223,566) |
Number of families with income $60k - 75k:| Northeast Rockwall: | 13.0% (126) |
| Texas: | 10.9% (302,688) |
Number of families with income $75k - 100k:| Northeast Rockwall: | 17.7% (172) |
| State: | 14.3% (398,554) |
Number of families with income $100k - 125k:| Northeast Rockwall: | 8.1% (79) |
| Texas: | 9.5% (264,007) |
Number of families with income $125k - 150k:| Northeast Rockwall: | 10.8% (105) |
| Texas: | 6.2% (171,274) |
Number of families with income $150k - 200k:| Northeast Rockwall: | 1.4% (14) |
| Texas: | 7.3% (202,259) |
Number of families with income > $200k:| Northeast Rockwall: | 0.4% (4) |
| State: | 5.9% (165,129) |
Median non-family income in Northeast Rockwall in 2022:| Northeast Rockwall: | $64,497 |
| State: | $39,934 |
Change in median non-family income between 2000 and 2022:| Northeast Rockwall, Texas: | +58.8% |
| Texas: | +109.1% |
Median per capita income in Northeast Rockwall in 2022:| Northeast Rockwall: | $28,705 |
| Texas: | $24,862 |
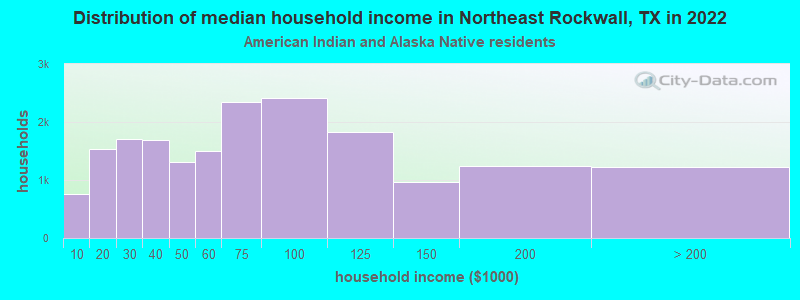
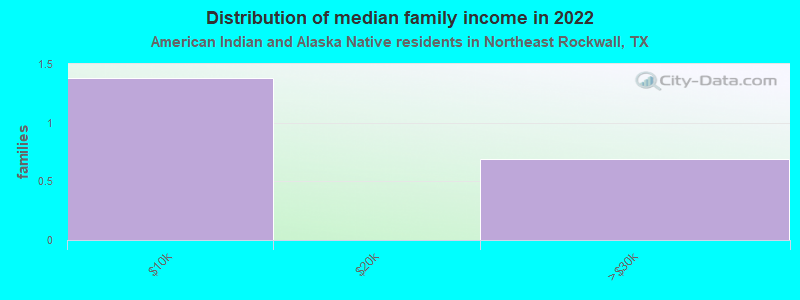
Income statistics for American Indian and Alaska Native residents
Median household income in Northeast Rockwall, TX in 2022:| Northeast Rockwall: | $29,866 |
| Texas: | $65,765 |
Change in median household income between 2000 and 2022:| Northeast Rockwall, Texas: | +93.7% |
| State: | +88.3% |
Number of households with income < $10k:| Northeast Rockwall: | 4.1% (751) |
| Texas: | 4.1% (3,398) |
Number of households with income $10k - 20k:| Northeast Rockwall: | 8.3% (1,536) |
| State: | 8.3% (6,949) |
Number of households with income $20k - 30k:| Northeast Rockwall: | 9.3% (1,712) |
| Texas: | 9.3% (7,742) |
Number of households with income $30k - 40k:| Northeast Rockwall: | 9.1% (1,684) |
| Texas: | 9.1% (7,627) |
Number of households with income $40k - 50k:| Northeast Rockwall: | 7.1% (1,311) |
| Texas: | 7.1% (5,922) |
Number of households with income $50k - 60k:| Northeast Rockwall: | 8.1% (1,495) |
| State: | 8.1% (6,761) |
Number of households with income $60k - 75k:| Northeast Rockwall: | 12.7% (2,340) |
| Texas: | 12.7% (10,588) |
Number of households with income $75k - 100k:| Northeast Rockwall: | 13.0% (2,411) |
| State: | 13.0% (10,903) |
Number of households with income $100k - 125k:| Northeast Rockwall: | 9.9% (1,826) |
| Texas: | 9.9% (8,256) |
Number of households with income $125k - 150k:| Northeast Rockwall: | 5.2% (962) |
| State: | 5.2% (4,355) |
Number of households with income $150k - 200k:| Northeast Rockwall: | 6.7% (1,242) |
| Texas: | 6.7% (5,623) |
Number of households with income > $200k:| Northeast Rockwall: | 6.6% (1,219) |
| State: | 6.6% (5,522) |
Aggregate household income in Northeast Rockwall in 2022: $332,331
Median family income in Northeast Rockwall in 2022:| Northeast Rockwall: | $7,946 |
| Texas: | $72,369 |
Median per capita income in Northeast Rockwall in 2022:| Northeast Rockwall: | $5,151 |
| State: | $28,166 |
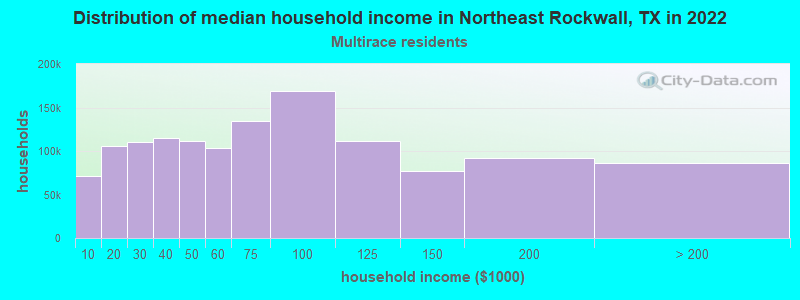
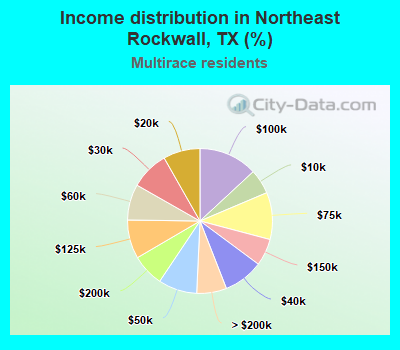
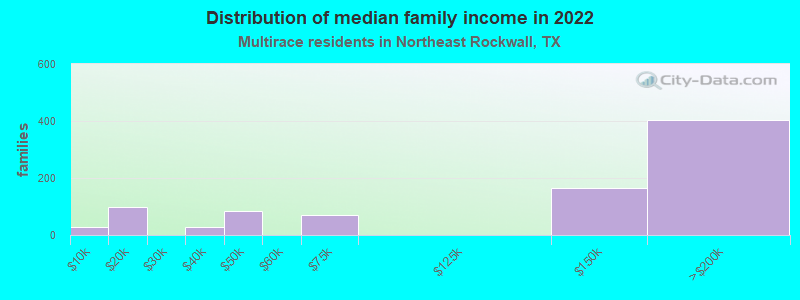
Income statistics for Multirace residents
Median household income in Northeast Rockwall, TX in 2022:| Northeast Rockwall: | $103,851 |
| Texas: | $62,748 |
Number of households with income < $10k:| Northeast Rockwall: | 5.5% (71,001) |
| Texas: | 5.5% (122,324) |
Number of households with income $10k - 20k:| Northeast Rockwall: | 8.2% (105,775) |
| Texas: | 8.2% (182,232) |
Number of households with income $20k - 30k:| Northeast Rockwall: | 8.5% (109,854) |
| State: | 8.5% (189,456) |
Number of households with income $30k - 40k:| Northeast Rockwall: | 8.9% (114,606) |
| State: | 8.9% (197,499) |
Number of households with income $40k - 50k:| Northeast Rockwall: | 8.7% (111,320) |
| Texas: | 8.7% (191,735) |
Number of households with income $50k - 60k:| Northeast Rockwall: | 8.0% (102,961) |
| State: | 8.0% (177,535) |
Number of households with income $60k - 75k:| Northeast Rockwall: | 10.5% (134,952) |
| State: | 10.5% (232,479) |
Number of households with income $75k - 100k:| Northeast Rockwall: | 13.1% (168,547) |
| State: | 13.1% (290,448) |
Number of households with income $100k - 125k:| Northeast Rockwall: | 8.7% (111,232) |
| State: | 8.6% (191,595) |
Number of households with income $125k - 150k:| Northeast Rockwall: | 6.0% (77,476) |
| State: | 6.0% (133,361) |
Number of households with income $150k - 200k:| Northeast Rockwall: | 7.2% (92,278) |
| Texas: | 7.2% (159,195) |
Number of households with income > $200k:| Northeast Rockwall: | 6.7% (85,917) |
| State: | 6.7% (148,064) |
Aggregate household income in Northeast Rockwall in 2022: $165,323,652
Median family income in Northeast Rockwall in 2022:| Northeast Rockwall: | $129,272 |
| State: | $69,780 |
Number of families with income < $10k:| Northeast Rockwall: | 3.1% (27) |
| State: | 4.4% (70,825) |
Number of families with income $10k - 20k:| Northeast Rockwall: | 11.4% (99) |
| State: | 5.9% (95,279) |
Number of families with income $30k - 40k:| Northeast Rockwall: | 3.1% (27) |
| State: | 8.5% (137,626) |
Number of families with income $40k - 50k:| Northeast Rockwall: | 9.5% (83) |
| State: | 8.4% (135,809) |
Number of families with income $60k - 75k:| Northeast Rockwall: | 8.0% (69) |
| State: | 10.5% (169,549) |
Number of families with income $125k - 150k:| Northeast Rockwall: | 18.9% (165) |
| State: | 6.7% (107,900) |
Number of families with income $150k - 200k:| Northeast Rockwall: | 46.1% (402) |
| State: | 8.5% (137,607) |
Median non-family income in Northeast Rockwall in 2022:| Northeast Rockwall: | $107,903 |
| State: | $40,634 |
Change in median non-family income between 2000 and 2022:| Northeast Rockwall, Texas: | +5.5% |
| State: | +77.2% |
Median per capita income in Northeast Rockwall in 2022:| Northeast Rockwall: | $31,906 |
| Texas: | $26,785 |
Change in median per capita income between 2000 and 2022:| Northeast Rockwall, Texas: | +135.7% |
| State: | +110.9% |
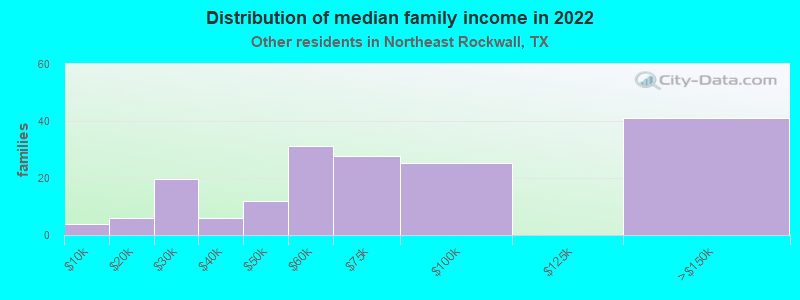
Income statistics for other residents
Number of households with income < $10k:| Northeast Rockwall: | 5.9% (66) |
| Texas: | 5.9% (54,162) |
Number of households with income $10k - 20k:| Northeast Rockwall: | 6.8% (76) |
| State: | 6.8% (62,891) |
Number of households with income $20k - 30k:| Northeast Rockwall: | 10.6% (118) |
| State: | 10.6% (97,294) |
Number of households with income $30k - 40k:| Northeast Rockwall: | 10.9% (121) |
| State: | 10.8% (99,670) |
Number of households with income $40k - 50k:| Northeast Rockwall: | 9.3% (104) |
| State: | 9.3% (85,548) |
Number of households with income $50k - 60k:| Northeast Rockwall: | 9.0% (100) |
| State: | 9.0% (82,757) |
Number of households with income $60k - 75k:| Northeast Rockwall: | 11.0% (122) |
| State: | 10.9% (100,326) |
Number of households with income $75k - 100k:| Northeast Rockwall: | 14.0% (156) |
| State: | 14.0% (128,767) |
Number of households with income $100k - 125k:| Northeast Rockwall: | 8.2% (91) |
| State: | 8.2% (75,218) |
Number of households with income $125k - 150k:| Northeast Rockwall: | 4.8% (54) |
| State: | 4.8% (44,223) |
Number of households with income $150k - 200k:| Northeast Rockwall: | 5.6% (62) |
| State: | 5.6% (51,376) |
Number of households with income > $200k:| Northeast Rockwall: | 3.9% (44) |
| State: | 4.0% (36,393) |
Aggregate household income in Northeast Rockwall in 2022: $36,997,607
Median family income in Northeast Rockwall in 2022:| Northeast Rockwall: | $94,133 |
| State: | $60,064 |
Number of families with income < $10k:| Northeast Rockwall: | 2.3% (4) |
| State: | 6.8% (47,502) |
Number of families with income $10k - 20k:| Northeast Rockwall: | 3.4% (6) |
| Texas: | 6.0% (41,763) |
Number of families with income $20k - 30k:| Northeast Rockwall: | 11.4% (20) |
| State: | 9.9% (68,761) |
Number of families with income $30k - 40k:| Northeast Rockwall: | 3.4% (6) |
| Texas: | 9.7% (67,685) |
Number of families with income $40k - 50k:| Northeast Rockwall: | 7.0% (12) |
| State: | 9.0% (62,441) |
Number of families with income $50k - 60k:| Northeast Rockwall: | 18.2% (31) |
| State: | 8.5% (59,321) |
Number of families with income $60k - 75k:| Northeast Rockwall: | 16.0% (28) |
| Texas: | 11.2% (77,588) |
Number of families with income $75k - 100k:| Northeast Rockwall: | 14.7% (25) |
| State: | 14.5% (101,032) |
Number of families with income $125k - 150k:| Northeast Rockwall: | 23.8% (41) |
| State: | 5.1% (35,727) |
Median per capita income in Northeast Rockwall in 2022:| Northeast Rockwall: | $29,640 |
| State: | $23,899 |