Northeast Umatilla, Oregon (OR) income map, earnings map, and wages data
The median household income in Northeast Umatilla, OR in 2022 was $63,694, which was 18.8% less than the median annual income of $75,657 across the entire state of Oregon. Compared to the median income of $29,983 in 2000 this represents an increase of 52.9%. The per capita income in 2022 was $28,091, which means an increase of 49.3% compared to 2000 when it was $14,233.
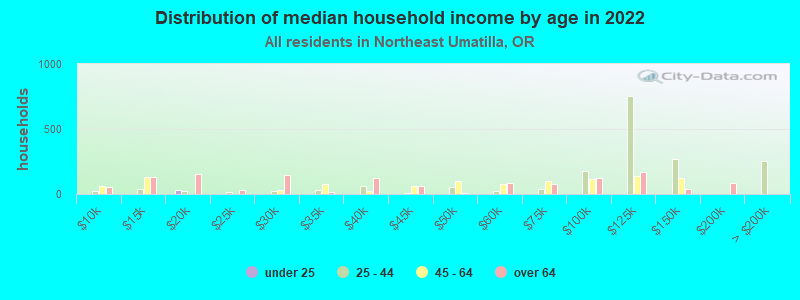
Income statistics for all residents
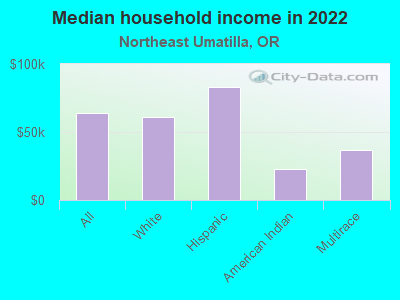
Median household income in Northeast Umatilla, OR in 2022:| Northeast Umatilla: | $63,695 |
| State: | $75,657 |
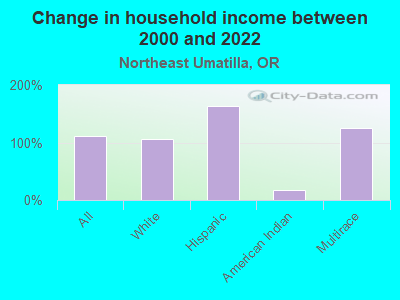
Change in median household income between 2000 and 2022:| Northeast Umatilla, Oregon: | +112.4% |
| State: | +84.9% |
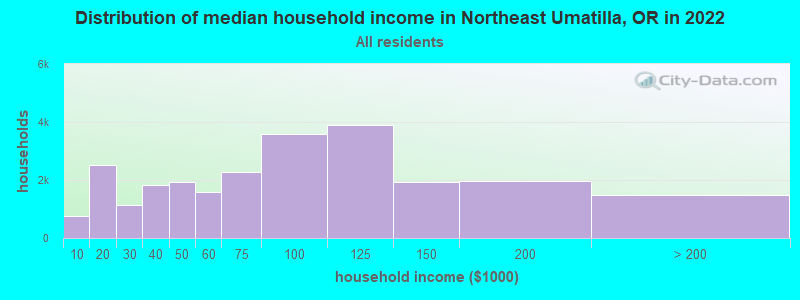
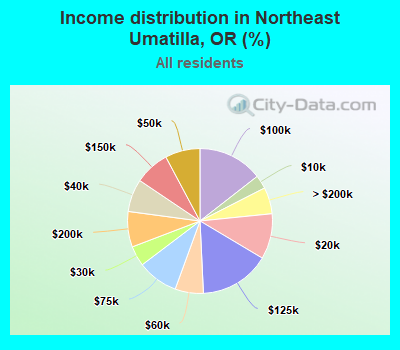
Number of households with income < $10k:| Northeast Umatilla: | 3.0% (751) |
| Oregon: | 5.1% (87,297) |
Number of households with income $10k - 20k:| Northeast Umatilla: | 10.2% (2,526) |
| Oregon: | 6.7% (115,299) |
Number of households with income $20k - 30k:| Northeast Umatilla: | 4.5% (1,123) |
| State: | 6.9% (119,114) |
Number of households with income $30k - 40k:| Northeast Umatilla: | 7.3% (1,819) |
| Oregon: | 7.1% (122,333) |
Number of households with income $40k - 50k:| Northeast Umatilla: | 7.8% (1,938) |
| State: | 7.2% (124,562) |
Number of households with income $50k - 60k:| Northeast Umatilla: | 6.3% (1,570) |
| State: | 6.9% (118,435) |
Number of households with income $60k - 75k:| Northeast Umatilla: | 9.1% (2,270) |
| State: | 9.8% (168,926) |
Number of households with income $75k - 100k:| Northeast Umatilla: | 14.5% (3,601) |
| Oregon: | 13.3% (229,104) |
Number of households with income $100k - 125k:| Northeast Umatilla: | 15.7% (3,907) |
| State: | 10.5% (181,787) |
Number of households with income $125k - 150k:| Northeast Umatilla: | 7.8% (1,936) |
| State: | 7.4% (127,392) |
Number of households with income $150k - 200k:| Northeast Umatilla: | 7.9% (1,970) |
| State: | 8.6% (148,614) |
Number of households with income > $200k:| Northeast Umatilla: | 5.9% (1,473) |
| Oregon: | 10.6% (183,477) |
Aggregate household income in Northeast Umatilla in 2022: $345,461,396
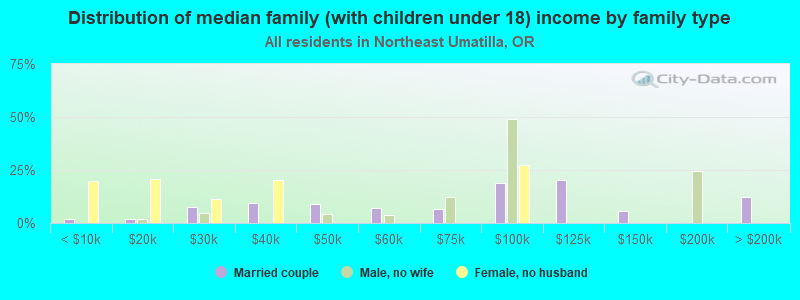
Median family income in Northeast Umatilla in 2022:| Northeast Umatilla: | $79,579 |
| State: | $93,384 |
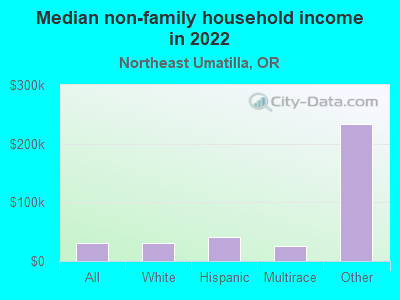
Median non-family income in Northeast Umatilla in 2022:| Northeast Umatilla: | $29,859 |
| State: | $48,114 |
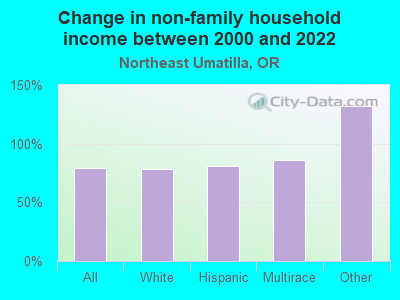
Change in median non-family income between 2000 and 2022:| Northeast Umatilla, Oregon: | +78.7% |
| Oregon: | +86.8% |
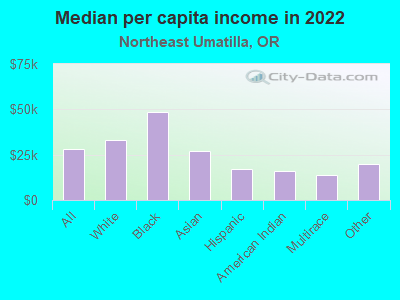
Median per capita income in Northeast Umatilla in 2022:| Northeast Umatilla: | $28,091 |
| State: | $42,474 |
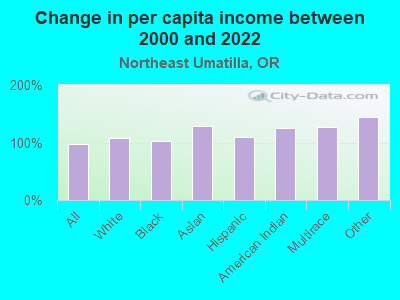
Change in median per capita income between 2000 and 2022:| Northeast Umatilla, Oregon: | +97.4% |
| State: | +102.8% |
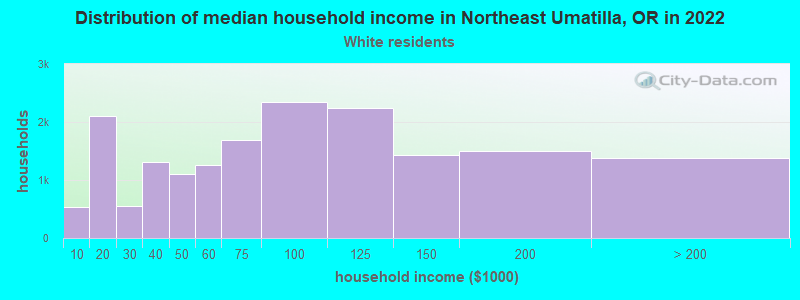
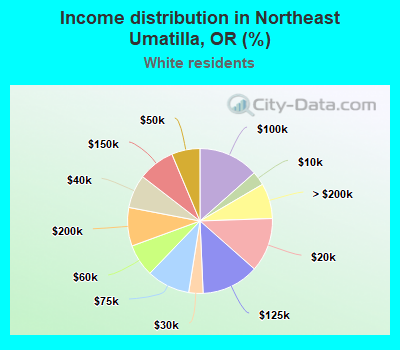
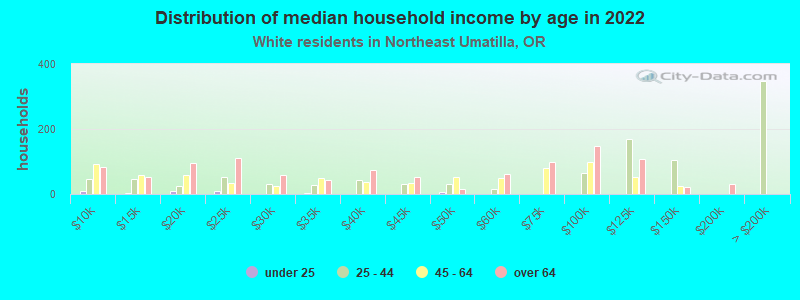
Income statistics for White residents
Median household income in Northeast Umatilla, OR in 2022:| Northeast Umatilla: | $60,723 |
| State: | $76,846 |
Change in median household income between 2000 and 2022:| Northeast Umatilla, Oregon: | +106.2% |
| State: | +84.8% |
Number of households with income < $10k:| Northeast Umatilla: | 3.1% (542) |
| State: | 4.9% (67,757) |
Number of households with income $10k - 20k:| Northeast Umatilla: | 12.1% (2,105) |
| State: | 6.6% (91,229) |
Number of households with income $20k - 30k:| Northeast Umatilla: | 3.2% (559) |
| State: | 6.8% (93,981) |
Number of households with income $30k - 40k:| Northeast Umatilla: | 7.5% (1,303) |
| State: | 6.9% (95,328) |
Number of households with income $40k - 50k:| Northeast Umatilla: | 6.3% (1,103) |
| Oregon: | 7.2% (100,221) |
Number of households with income $50k - 60k:| Northeast Umatilla: | 7.2% (1,264) |
| State: | 6.9% (95,294) |
Number of households with income $60k - 75k:| Northeast Umatilla: | 9.6% (1,683) |
| State: | 9.5% (132,178) |
Number of households with income $75k - 100k:| Northeast Umatilla: | 13.5% (2,349) |
| Oregon: | 13.5% (187,105) |
Number of households with income $100k - 125k:| Northeast Umatilla: | 12.8% (2,233) |
| State: | 10.5% (145,264) |
Number of households with income $125k - 150k:| Northeast Umatilla: | 8.2% (1,430) |
| State: | 7.3% (101,755) |
Number of households with income $150k - 200k:| Northeast Umatilla: | 8.6% (1,504) |
| State: | 8.7% (121,099) |
Number of households with income > $200k:| Northeast Umatilla: | 7.9% (1,378) |
| State: | 11.1% (153,992) |
Aggregate household income in Northeast Umatilla in 2022: $258,116,359
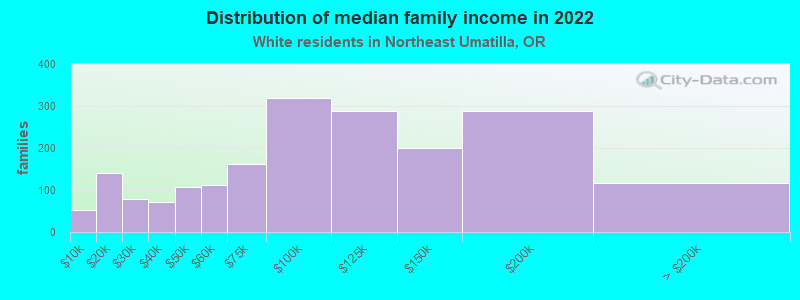
Median family income in Northeast Umatilla in 2022:| Northeast Umatilla: | $79,467 |
| State: | $95,912 |
Number of families with income < $10k:| Northeast Umatilla: | 2.7% (52) |
| State: | 2.8% (23,325) |
Number of families with income $10k - 20k:| Northeast Umatilla: | 7.3% (141) |
| Oregon: | 2.8% (23,464) |
Number of families with income $20k - 30k:| Northeast Umatilla: | 4.0% (78) |
| Oregon: | 4.1% (33,830) |
Number of families with income $30k - 40k:| Northeast Umatilla: | 3.7% (72) |
| State: | 5.6% (46,508) |
Number of families with income $40k - 50k:| Northeast Umatilla: | 5.6% (108) |
| State: | 6.4% (53,001) |
Number of families with income $50k - 60k:| Northeast Umatilla: | 5.8% (112) |
| Oregon: | 6.0% (49,589) |
Number of families with income $60k - 75k:| Northeast Umatilla: | 8.3% (161) |
| Oregon: | 9.4% (77,838) |
Number of families with income $75k - 100k:| Northeast Umatilla: | 16.5% (320) |
| State: | 14.7% (121,106) |
Number of families with income $100k - 125k:| Northeast Umatilla: | 14.9% (289) |
| State: | 12.3% (101,829) |
Number of families with income $125k - 150k:| Northeast Umatilla: | 10.4% (201) |
| State: | 8.9% (73,376) |
Number of families with income $150k - 200k:| Northeast Umatilla: | 14.8% (288) |
| State: | 11.7% (96,629) |
Number of families with income > $200k:| Northeast Umatilla: | 6.0% (116) |
| State: | 15.2% (125,084) |
Median non-family income in Northeast Umatilla in 2022:| Northeast Umatilla: | $30,045 |
| State: | $48,924 |
Change in median non-family income between 2000 and 2022:| Northeast Umatilla, Oregon: | +78.1% |
| State: | +88.0% |
Median per capita income in Northeast Umatilla in 2022:| Northeast Umatilla: | $32,926 |
| State: | $45,669 |
Change in median per capita income between 2000 and 2022:| Northeast Umatilla, Oregon: | +108.2% |
| Oregon: | +106.5% |
Income statistics for Black or African American residents
Aggregate household income in Northeast Umatilla in 2022: $558,755
Median per capita income in Northeast Umatilla in 2022:| Northeast Umatilla: | $48,784 |
| State: | $34,050 |
Change in median per capita income between 2000 and 2022:| Northeast Umatilla, Oregon: | +101.6% |
| State: | +128.9% |
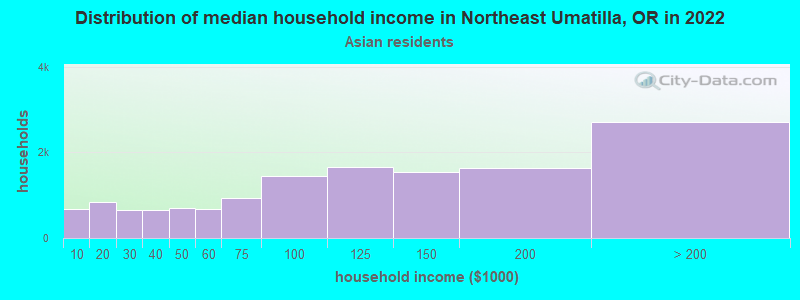
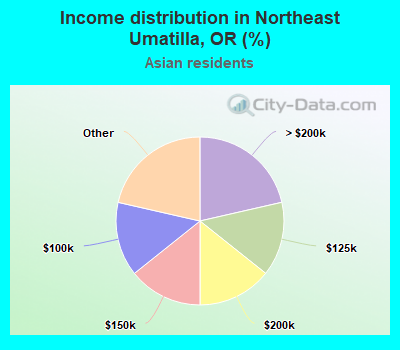
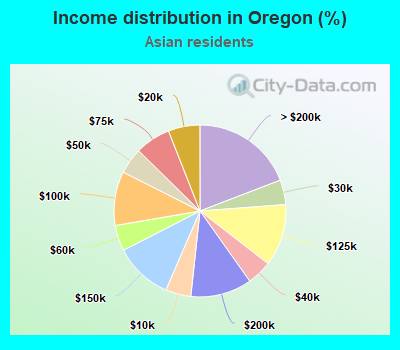
Income statistics for Asian residents
Number of households with income < $10k:| Northeast Umatilla: | 7.1% (1) |
| State: | 4.8% (3,402) |
Number of households with income $10k - 20k:| Northeast Umatilla: | 0.0% (0) |
| Oregon: | 6.0% (4,253) |
Number of households with income $20k - 30k:| Northeast Umatilla: | 0.0% (0) |
| State: | 4.6% (3,310) |
Number of households with income $30k - 40k:| Northeast Umatilla: | 0.0% (0) |
| State: | 4.7% (3,339) |
Number of households with income $40k - 50k:| Northeast Umatilla: | 0.0% (0) |
| Oregon: | 4.9% (3,495) |
Number of households with income $50k - 60k:| Northeast Umatilla: | 7.1% (1) |
| Oregon: | 4.8% (3,456) |
Number of households with income $60k - 75k:| Northeast Umatilla: | 7.1% (1) |
| State: | 6.7% (4,746) |
Number of households with income $75k - 100k:| Northeast Umatilla: | 14.3% (2) |
| Oregon: | 10.2% (7,251) |
Number of households with income $100k - 125k:| Northeast Umatilla: | 14.3% (2) |
| State: | 11.7% (8,327) |
Number of households with income $125k - 150k:| Northeast Umatilla: | 14.3% (2) |
| Oregon: | 11.0% (7,818) |
Number of households with income $150k - 200k:| Northeast Umatilla: | 14.3% (2) |
| Oregon: | 11.5% (8,235) |
Number of households with income > $200k:| Northeast Umatilla: | 21.4% (3) |
| State: | 19.2% (13,672) |
Aggregate household income in Northeast Umatilla in 2022: $2,000,847
Median per capita income in Northeast Umatilla in 2022:| Northeast Umatilla: | $26,904 |
| Oregon: | $52,607 |
Change in median per capita income between 2000 and 2022:| Northeast Umatilla, Oregon: | +128.6% |
| State: | +165.8% |
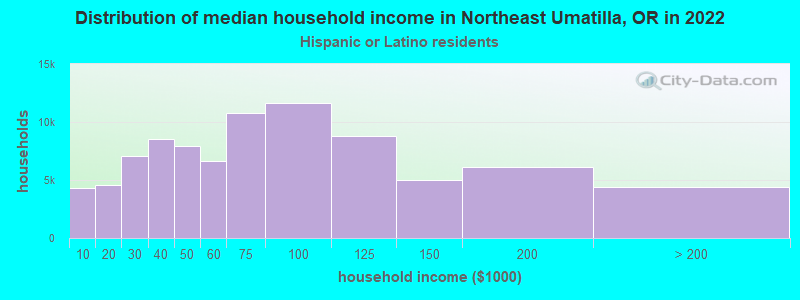
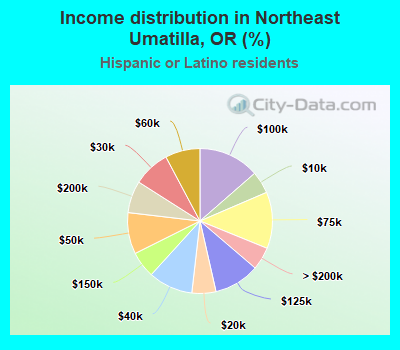
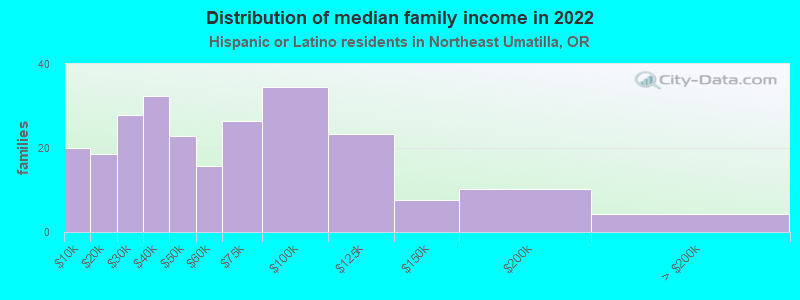
Income statistics for Hispanic or Latino residents
Median household income in Northeast Umatilla, OR in 2022:| Northeast Umatilla: | $82,984 |
| Oregon: | $65,081 |
Number of households with income < $10k:| Northeast Umatilla: | 5.0% (4,268) |
| State: | 5.0% (8,626) |
Number of households with income $10k - 20k:| Northeast Umatilla: | 5.4% (4,593) |
| Oregon: | 5.4% (9,284) |
Number of households with income $20k - 30k:| Northeast Umatilla: | 8.2% (7,044) |
| State: | 8.2% (14,265) |
Number of households with income $30k - 40k:| Northeast Umatilla: | 9.9% (8,522) |
| Oregon: | 9.9% (17,228) |
Number of households with income $40k - 50k:| Northeast Umatilla: | 9.2% (7,928) |
| State: | 9.2% (16,040) |
Number of households with income $50k - 60k:| Northeast Umatilla: | 7.8% (6,675) |
| State: | 7.8% (13,499) |
Number of households with income $60k - 75k:| Northeast Umatilla: | 12.6% (10,806) |
| State: | 12.6% (21,845) |
Number of households with income $75k - 100k:| Northeast Umatilla: | 13.6% (11,655) |
| State: | 13.6% (23,566) |
Number of households with income $100k - 125k:| Northeast Umatilla: | 10.2% (8,756) |
| State: | 10.2% (17,704) |
Number of households with income $125k - 150k:| Northeast Umatilla: | 5.9% (5,039) |
| Oregon: | 5.9% (10,188) |
Number of households with income $150k - 200k:| Northeast Umatilla: | 7.1% (6,133) |
| State: | 7.1% (12,405) |
Number of households with income > $200k:| Northeast Umatilla: | 5.1% (4,377) |
| State: | 5.1% (8,851) |
Aggregate household income in Northeast Umatilla in 2022: $91,070,512
Median family income in Northeast Umatilla in 2022:| Northeast Umatilla: | $84,237 |
| Oregon: | $70,541 |
Number of families with income < $10k:| Northeast Umatilla: | 8.2% (20) |
| State: | 4.3% (5,112) |
Number of families with income $10k - 20k:| Northeast Umatilla: | 7.6% (19) |
| State: | 3.1% (3,774) |
Number of families with income $20k - 30k:| Northeast Umatilla: | 11.4% (28) |
| State: | 7.8% (9,379) |
Number of families with income $30k - 40k:| Northeast Umatilla: | 13.3% (32) |
| State: | 8.8% (10,547) |
Number of families with income $40k - 50k:| Northeast Umatilla: | 9.4% (23) |
| State: | 8.9% (10,692) |
Number of families with income $50k - 60k:| Northeast Umatilla: | 6.4% (16) |
| State: | 7.0% (8,368) |
Number of families with income $60k - 75k:| Northeast Umatilla: | 10.8% (26) |
| Oregon: | 13.7% (16,446) |
Number of families with income $75k - 100k:| Northeast Umatilla: | 14.1% (34) |
| State: | 14.6% (17,572) |
Number of families with income $100k - 125k:| Northeast Umatilla: | 9.6% (23) |
| State: | 12.0% (14,418) |
Number of families with income $125k - 150k:| Northeast Umatilla: | 3.2% (8) |
| State: | 6.0% (7,198) |
Number of families with income $150k - 200k:| Northeast Umatilla: | 4.2% (10) |
| Oregon: | 8.1% (9,776) |
Number of families with income > $200k:| Northeast Umatilla: | 1.7% (4) |
| State: | 5.7% (6,869) |
Median non-family income in Northeast Umatilla in 2022:| Northeast Umatilla: | $41,439 |
| State: | $44,007 |
Change in median non-family income between 2000 and 2022:| Northeast Umatilla, Oregon: | +81.4% |
| Oregon: | +83.5% |
Median per capita income in Northeast Umatilla in 2022:| Northeast Umatilla: | $16,872 |
| State: | $25,274 |
Change in median per capita income between 2000 and 2022:| Northeast Umatilla, Oregon: | +109.1% |
| State: | +149.8% |
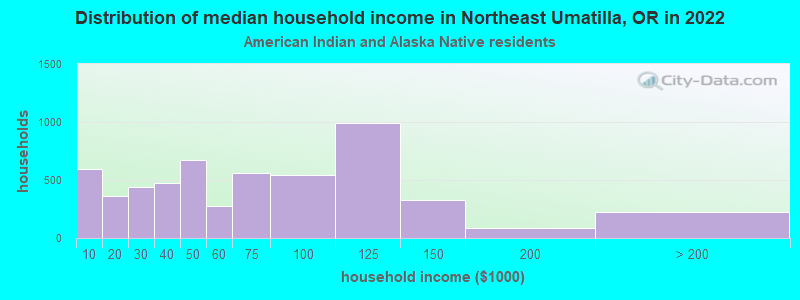
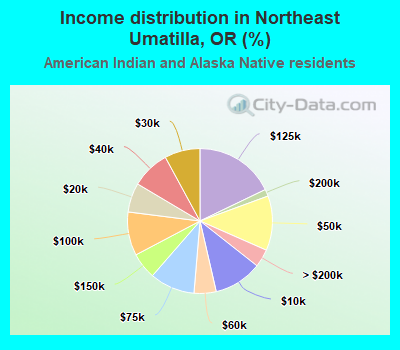
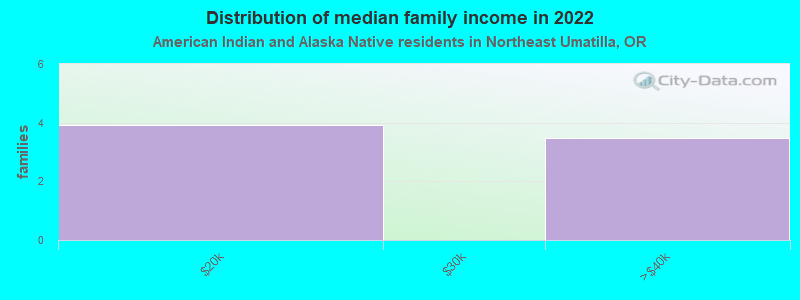
Income statistics for American Indian and Alaska Native residents
Median household income in Northeast Umatilla, OR in 2022:| Northeast Umatilla: | $23,141 |
| Oregon: | $57,280 |
Change in median household income between 2000 and 2022:| Northeast Umatilla, Oregon: | +17.8% |
| State: | +86.4% |
Number of households with income < $10k:| Northeast Umatilla: | 10.8% (597) |
| Oregon: | 11.0% (1,885) |
Number of households with income $10k - 20k:| Northeast Umatilla: | 6.5% (362) |
| State: | 6.6% (1,129) |
Number of households with income $20k - 30k:| Northeast Umatilla: | 7.9% (438) |
| Oregon: | 7.9% (1,360) |
Number of households with income $30k - 40k:| Northeast Umatilla: | 8.5% (473) |
| Oregon: | 8.6% (1,471) |
Number of households with income $40k - 50k:| Northeast Umatilla: | 12.2% (675) |
| State: | 12.1% (2,084) |
Number of households with income $50k - 60k:| Northeast Umatilla: | 4.9% (273) |
| State: | 5.0% (853) |
Number of households with income $60k - 75k:| Northeast Umatilla: | 10.1% (557) |
| State: | 10.1% (1,730) |
Number of households with income $75k - 100k:| Northeast Umatilla: | 9.7% (539) |
| Oregon: | 9.8% (1,679) |
Number of households with income $100k - 125k:| Northeast Umatilla: | 17.9% (989) |
| State: | 17.6% (3,026) |
Number of households with income $125k - 150k:| Northeast Umatilla: | 5.9% (325) |
| State: | 5.8% (1,002) |
Number of households with income $150k - 200k:| Northeast Umatilla: | 1.6% (86) |
| Oregon: | 1.5% (264) |
Number of households with income > $200k:| Northeast Umatilla: | 4.0% (222) |
| State: | 4.0% (681) |
Aggregate household income in Northeast Umatilla in 2022: $271,154
Median family income in Northeast Umatilla in 2022:| Northeast Umatilla: | $33,031 |
| State: | $73,395 |
Median per capita income in Northeast Umatilla in 2022:| Northeast Umatilla: | $15,918 |
| Oregon: | $28,382 |
Change in median per capita income between 2000 and 2022:| Northeast Umatilla, Oregon: | +124.7% |
| Oregon: | +111.1% |
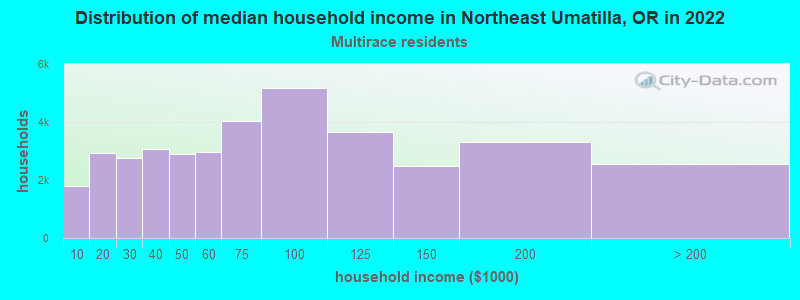
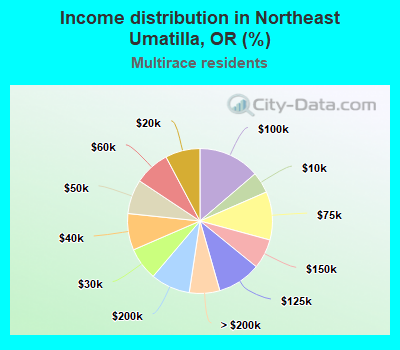
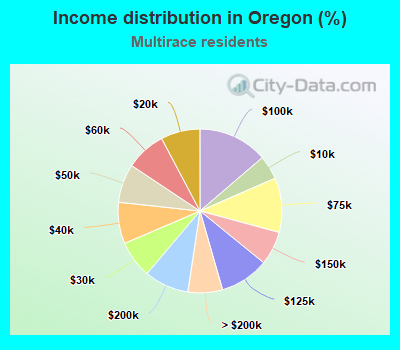
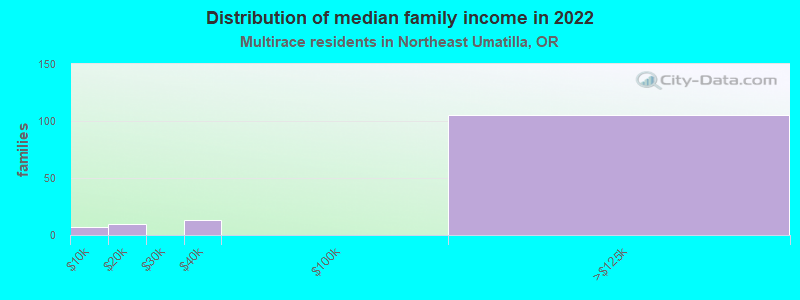
Income statistics for Multirace residents
Median household income in Northeast Umatilla, OR in 2022:| Northeast Umatilla: | $36,627 |
| State: | $68,947 |
Change in median household income between 2000 and 2022:| Northeast Umatilla, Oregon: | +125.4% |
| State: | +113.0% |
Number of households with income < $10k:| Northeast Umatilla: | 4.7% (1,779) |
| Oregon: | 4.7% (7,092) |
Number of households with income $10k - 20k:| Northeast Umatilla: | 7.8% (2,917) |
| Oregon: | 7.7% (11,619) |
Number of households with income $20k - 30k:| Northeast Umatilla: | 7.3% (2,747) |
| Oregon: | 7.4% (11,055) |
Number of households with income $30k - 40k:| Northeast Umatilla: | 8.2% (3,073) |
| Oregon: | 8.2% (12,256) |
Number of households with income $40k - 50k:| Northeast Umatilla: | 7.7% (2,880) |
| Oregon: | 7.6% (11,440) |
Number of households with income $50k - 60k:| Northeast Umatilla: | 7.9% (2,978) |
| State: | 7.9% (11,878) |
Number of households with income $60k - 75k:| Northeast Umatilla: | 10.8% (4,051) |
| State: | 10.8% (16,149) |
Number of households with income $75k - 100k:| Northeast Umatilla: | 13.7% (5,166) |
| State: | 13.7% (20,620) |
Number of households with income $100k - 125k:| Northeast Umatilla: | 9.7% (3,655) |
| Oregon: | 9.7% (14,562) |
Number of households with income $125k - 150k:| Northeast Umatilla: | 6.6% (2,495) |
| State: | 6.6% (9,976) |
Number of households with income $150k - 200k:| Northeast Umatilla: | 8.8% (3,309) |
| State: | 8.8% (13,229) |
Number of households with income > $200k:| Northeast Umatilla: | 6.8% (2,560) |
| Oregon: | 6.8% (10,234) |
Aggregate household income in Northeast Umatilla in 2022: $33,672,207
Median family income in Northeast Umatilla in 2022:| Northeast Umatilla: | $45,677 |
| Oregon: | $81,783 |
Number of families with income < $10k:| Northeast Umatilla: | 5.5% (7) |
| State: | 2.8% (2,525) |
Number of families with income $10k - 20k:| Northeast Umatilla: | 7.1% (10) |
| Oregon: | 3.9% (3,503) |
Number of families with income $30k - 40k:| Northeast Umatilla: | 9.6% (13) |
| Oregon: | 6.4% (5,825) |
Number of families with income $100k - 125k:| Northeast Umatilla: | 77.8% (105) |
| State: | 12.1% (11,019) |
Median non-family income in Northeast Umatilla in 2022:| Northeast Umatilla: | $25,519 |
| State: | $45,215 |
Change in median non-family income between 2000 and 2022:| Northeast Umatilla, Oregon: | +85.6% |
| State: | +107.2% |
Median per capita income in Northeast Umatilla in 2022:| Northeast Umatilla: | $13,847 |
| Oregon: | $29,750 |
Change in median per capita income between 2000 and 2022:| Northeast Umatilla, Oregon: | +127.1% |
| State: | +148.0% |
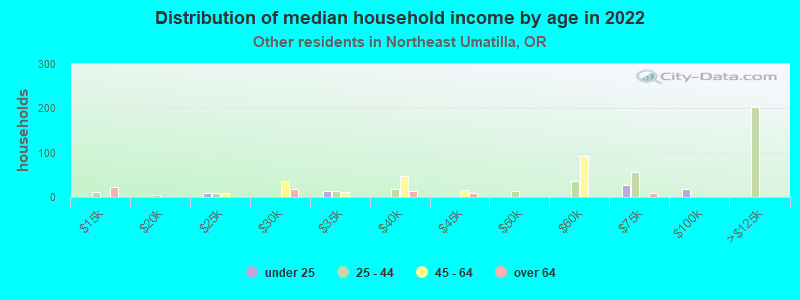
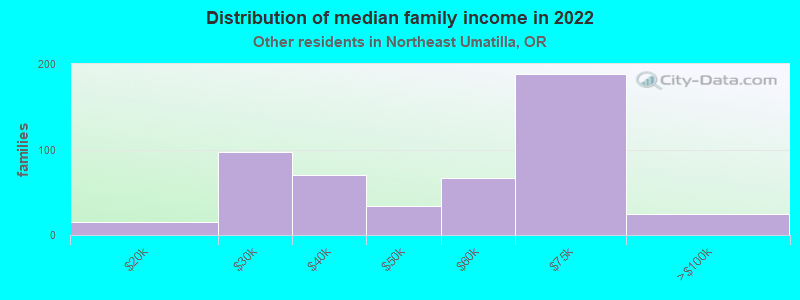
Income statistics for other residents
Number of households with income < $10k:| Northeast Umatilla: | 4.0% (30) |
| State: | 5.9% (3,904) |
Number of households with income $10k - 20k:| Northeast Umatilla: | 3.8% (29) |
| State: | 4.8% (3,221) |
Number of households with income $20k - 30k:| Northeast Umatilla: | 13.3% (101) |
| State: | 9.4% (6,245) |
Number of households with income $30k - 40k:| Northeast Umatilla: | 6.7% (51) |
| State: | 9.9% (6,579) |
Number of households with income $40k - 50k:| Northeast Umatilla: | 9.2% (70) |
| State: | 7.3% (4,871) |
Number of households with income $50k - 60k:| Northeast Umatilla: | 6.9% (52) |
| Oregon: | 8.2% (5,473) |
Number of households with income $60k - 75k:| Northeast Umatilla: | 16.4% (124) |
| State: | 13.7% (9,138) |
Number of households with income $75k - 100k:| Northeast Umatilla: | 14.2% (108) |
| Oregon: | 13.6% (9,057) |
Number of households with income $100k - 125k:| Northeast Umatilla: | 9.1% (69) |
| State: | 11.0% (7,344) |
Number of households with income $125k - 150k:| Northeast Umatilla: | 8.2% (62) |
| State: | 7.1% (4,713) |
Number of households with income $150k - 200k:| Northeast Umatilla: | 4.2% (32) |
| State: | 5.0% (3,350) |
Number of households with income > $200k:| Northeast Umatilla: | 4.0% (30) |
| State: | 4.0% (2,665) |
Aggregate household income in Northeast Umatilla in 2022: $72,403,762
Median family income in Northeast Umatilla in 2022:| Northeast Umatilla: | $97,223 |
| State: | $67,149 |
Number of families with income $10k - 20k:| Northeast Umatilla: | 3.1% (15) |
| Oregon: | 2.3% (1,138) |
Number of families with income $20k - 30k:| Northeast Umatilla: | 19.5% (97) |
| Oregon: | 10.1% (4,922) |
Number of families with income $30k - 40k:| Northeast Umatilla: | 14.2% (70) |
| State: | 9.6% (4,646) |
Number of families with income $40k - 50k:| Northeast Umatilla: | 6.8% (34) |
| Oregon: | 7.4% (3,579) |
Number of families with income $50k - 60k:| Northeast Umatilla: | 13.5% (67) |
| Oregon: | 7.1% (3,464) |
Number of families with income $60k - 75k:| Northeast Umatilla: | 37.8% (188) |
| Oregon: | 15.2% (7,392) |
Number of families with income $75k - 100k:| Northeast Umatilla: | 5.0% (25) |
| State: | 13.3% (6,454) |
Median non-family income in Northeast Umatilla in 2022:| Northeast Umatilla: | $233,032 |
| Oregon: | $45,585 |
Change in median non-family income between 2000 and 2022:| Northeast Umatilla, Oregon: | +132.1% |
| State: | +91.4% |
Median per capita income in Northeast Umatilla in 2022:| Northeast Umatilla: | $20,085 |
| State: | $25,226 |
Change in median per capita income between 2000 and 2022:| Northeast Umatilla, Oregon: | +145.4% |
| Oregon: | +162.2% |