The median household income in Northlake, IL in 2022 was $70,234, which was 9.2% less than the median annual income of $76,708 across the entire state of Illinois. Compared to the median income of $48,406 in 2000 this represents an increase of 31.1%. The per capita income in 2022 was $28,906, which means an increase of 37.3% compared to 2000 when it was $18,119.
Whole page based on the data from 2000 / 2022 when the population of Northlake, Illinois was 11,878 / 12,401
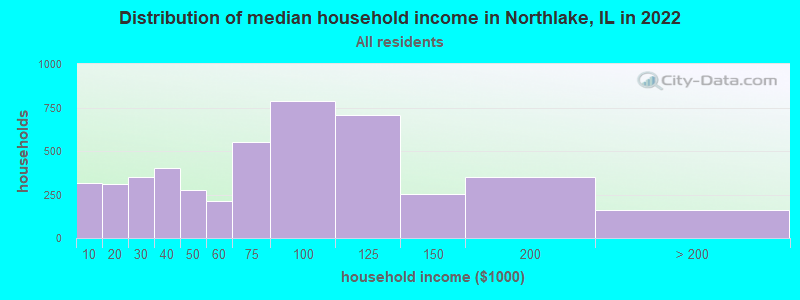
Income statistics for all residents
Median household income in Northlake, IL in 2022:
Northlake:
$70,235
State:
$76,708
Change in median household income between 2000 and 2022:
Northlake, Illinois:
+45.1%
Illinois:
+64.6%
Number of households with income < $10k:
Northlake:
6.8% (318)
Illinois:
5.9% (296,090)
Number of households with income $10k - 20k:
Northlake:
6.6% (309)
State:
6.6% (333,259)
Number of households with income $20k - 30k:
Northlake:
7.5% (350)
Illinois:
6.8% (342,921)
Number of households with income $30k - 40k:
Northlake:
8.6% (402)
State:
7.0% (355,254)
Number of households with income $40k - 50k:
Northlake:
5.9% (274)
Illinois:
6.7% (340,678)
Number of households with income $50k - 60k:
Northlake:
4.5% (210)
Illinois:
6.7% (339,405)
Number of households with income $60k - 75k:
Northlake:
11.8% (552)
Illinois:
9.2% (465,709)
Number of households with income $75k - 100k:
Northlake:
16.9% (788)
State:
12.9% (651,353)
Number of households with income $100k - 125k:
Northlake:
15.1% (705)
State:
10.3% (522,359)
Number of households with income $125k - 150k:
Northlake:
5.4% (253)
State:
7.3% (367,136)
Number of households with income $150k - 200k:
Northlake:
7.5% (352)
Illinois:
9.0% (455,249)
Number of households with income > $200k:
Northlake:
3.4% (160)
State:
11.6% (586,947)
Aggregate household income in Northlake in 2022: $358,398,363
Median family income in Northlake in 2022:
Northlake:
$85,596
Illinois:
$96,948
Number of families with income < $10k:
Northlake:
3.6% (112)
State:
3.4% (105,875)
Number of families with income $10k - 20k:
Northlake:
2.1% (65)
Illinois:
3.3% (105,017)
Number of families with income $20k - 30k:
Northlake:
6.1% (194)
Illinois:
4.7% (146,403)
Number of families with income $30k - 40k:
Northlake:
6.4% (202)
State:
5.3% (167,069)
Number of families with income $40k - 50k:
Northlake:
4.8% (151)
State:
5.8% (181,164)
Number of families with income $50k - 60k:
Northlake:
7.3% (229)
Illinois:
6.1% (191,561)
Number of families with income $60k - 75k:
Northlake:
10.4% (327)
Illinois:
9.0% (282,985)
Number of families with income $75k - 100k:
Northlake:
22.3% (702)
Illinois:
13.8% (432,725)
Number of families with income $100k - 125k:
Northlake:
15.3% (483)
State:
11.9% (373,296)
Number of families with income $125k - 150k:
Northlake:
8.0% (252)
State:
8.9% (279,791)
Number of families with income $150k - 200k:
Northlake:
8.8% (276)
State:
11.9% (372,004)
Number of families with income > $200k:
Northlake:
5.0% (159)
State:
15.9% (500,033)
Median non-family income in Northlake in 2022:
Northlake:
$36,950
State:
$46,533
Change in median non-family income between 2000 and 2022:
Northlake, Illinois:
+32.9%
State:
+64.0%
Median per capita income in Northlake in 2022:
Northlake:
$28,907
State:
$43,317
Change in median per capita income between 2000 and 2022:
Northlake, Illinois:
+59.5%
State:
+87.5%
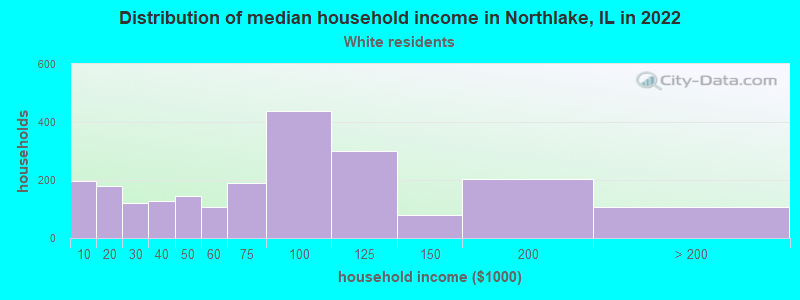
Income statistics for White residents
Median household income in Northlake, IL in 2022:
Northlake:
$76,097
State:
$83,346
Change in median household income between 2000 and 2022:
Northlake, Illinois:
+58.7%
State:
+67.5%
Number of households with income < $10k:
Northlake:
9.0% (198)
State:
4.5% (149,895)
Number of households with income $10k - 20k:
Northlake:
8.1% (178)
State:
5.5% (184,529)
Number of households with income $20k - 30k:
Northlake:
5.6% (122)
State:
6.1% (205,767)
Number of households with income $30k - 40k:
Northlake:
5.7% (126)
State:
6.7% (225,572)
Number of households with income $40k - 50k:
Northlake:
6.7% (146)
State:
6.5% (216,965)
Number of households with income $50k - 60k:
Northlake:
4.9% (108)
Illinois:
6.6% (222,841)
Number of households with income $60k - 75k:
Northlake:
8.7% (190)
State:
9.3% (312,758)
Number of households with income $75k - 100k:
Northlake:
19.9% (437)
State:
12.9% (433,180)
Number of households with income $100k - 125k:
Northlake:
13.7% (301)
Illinois:
10.7% (360,753)
Number of households with income $125k - 150k:
Northlake:
3.6% (79)
State:
7.9% (266,532)
Number of households with income $150k - 200k:
Northlake:
9.2% (202)
State:
10.0% (337,357)
Number of households with income > $200k:
Northlake:
4.9% (108)
State:
13.3% (446,069)
Aggregate household income in Northlake in 2022: $176,743,643
Median family income in Northlake in 2022:
Northlake:
$91,080
Illinois:
$107,938
Number of families with income < $10k:
Northlake:
3.2% (39)
State:
2.2% (45,983)
Number of families with income $10k - 20k:
Northlake:
1.3% (16)
Illinois:
2.5% (50,574)
Number of families with income $20k - 30k:
Northlake:
3.1% (38)
Illinois:
3.5% (70,927)
Number of families with income $30k - 40k:
Northlake:
4.8% (59)
Illinois:
4.4% (90,563)
Number of families with income $40k - 50k:
Northlake:
3.7% (45)
State:
5.0% (102,597)
Number of families with income $50k - 60k:
Northlake:
9.7% (118)
State:
5.8% (119,129)
Number of families with income $60k - 75k:
Northlake:
6.4% (78)
Illinois:
8.8% (179,665)
Number of families with income $75k - 100k:
Northlake:
24.7% (302)
State:
13.5% (276,887)
Number of families with income $100k - 125k:
Northlake:
16.3% (200)
State:
12.5% (256,099)
Number of families with income $125k - 150k:
Northlake:
6.1% (75)
Illinois:
9.8% (199,855)
Number of families with income $150k - 200k:
Northlake:
12.0% (147)
State:
13.4% (274,569)
Number of families with income > $200k:
Northlake:
8.7% (107)
State:
18.6% (381,354)
Median non-family income in Northlake in 2022:
Northlake:
$39,252
Illinois:
$50,934
Change in median non-family income between 2000 and 2022:
Northlake, Illinois:
+60.6%
State:
+70.7%
Median per capita income in Northlake in 2022:
Northlake:
$37,271
Illinois:
$50,738
Change in median per capita income between 2000 and 2022:
Northlake, Illinois:
+95.8%
State:
+95.5%
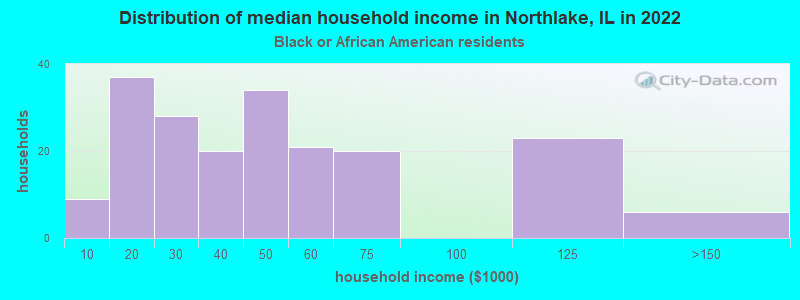
Income statistics for Black or African American residents
Median household income in Northlake, IL in 2022:
Northlake:
$39,112
State:
$45,019
Change in median household income between 2000 and 2022:: -9.9%
Northlake, Illinois:
-9.9%
Illinois:
+42.0%
Number of households with income < $10k:
Northlake:
4.5% (9)
State:
13.3% (92,224)
Number of households with income $10k - 20k:
Northlake:
18.7% (37)
State:
13.5% (93,732)
Number of households with income $20k - 30k:
Northlake:
14.1% (28)
Illinois:
9.9% (68,453)
Number of households with income $30k - 40k:
Northlake:
10.1% (20)
State:
8.5% (59,072)
Number of households with income $40k - 50k:
Northlake:
17.2% (34)
State:
7.9% (55,033)
Number of households with income $50k - 60k:
Northlake:
10.6% (21)
Illinois:
7.2% (49,556)
Number of households with income $60k - 75k:
Northlake:
10.1% (20)
State:
7.8% (53,726)
Number of households with income $75k - 100k:
Northlake:
0.0% (0)
State:
11.6% (80,439)
Number of households with income $100k - 125k:
Northlake:
11.6% (23)
State:
7.5% (52,244)
Number of households with income $125k - 150k:
Northlake:
3.0% (6)
State:
3.9% (27,058)
Number of households with income $150k - 200k:
Northlake:
0.0% (0)
State:
4.6% (32,057)
Number of households with income > $200k:
Northlake:
0.0% (0)
State:
4.1% (28,731)
Aggregate household income in Northlake in 2022: $8,917,401
Median family income in Northlake in 2022:
Northlake:
$44,160
State:
$60,661
Number of families with income $10k - 20k:
Northlake:
14.8% (11)
State:
7.9% (29,324)
Number of families with income $30k - 40k:
Northlake:
25.8% (19)
State:
7.8% (28,775)
Number of families with income $40k - 50k:
Northlake:
12.8% (9)
State:
8.5% (31,429)
Number of families with income $50k - 60k:
Northlake:
18.4% (13)
Illinois:
7.1% (26,341)
Number of families with income $60k - 75k:
Northlake:
28.2% (20)
Illinois:
8.3% (30,626)
Median non-family income in Northlake in 2022:
Northlake:
$28,386
State:
$29,966
Change in median non-family income between 2000 and 2022:: -28.3%
Northlake, Illinois:
-28.3%
State:
+44.4%
Median per capita income in Northlake in 2022:
Northlake:
$18,933
State:
$28,045
Change in median per capita income between 2000 and 2022:: -31.2%
Northlake, Illinois:
-31.2%
Illinois:
+90.2%
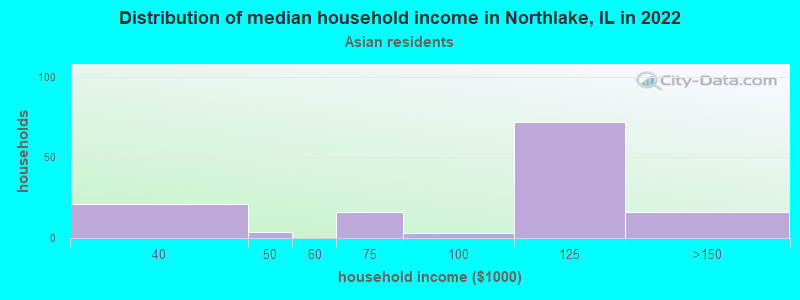
Income statistics for Asian residents
Median household income in Northlake, IL in 2022:
Northlake:
$102,101
State:
$104,287
Change in median household income between 2000 and 2022:
Northlake, Illinois:
+61.3%
State:
+81.9%
Number of households with income < $10k:
Northlake:
0.0% (0)
Illinois:
5.3% (14,653)
Number of households with income $10k - 20k:
Northlake:
0.0% (0)
State:
4.5% (12,283)
Number of households with income $20k - 30k:
Northlake:
0.0% (0)
State:
4.8% (13,135)
Number of households with income $30k - 40k:
Northlake:
15.9% (21)
State:
5.0% (13,655)
Number of households with income $40k - 50k:
Northlake:
3.0% (4)
Illinois:
4.5% (12,357)
Number of households with income $50k - 60k:
Northlake:
0.0% (0)
State:
4.9% (13,568)
Number of households with income $60k - 75k:
Northlake:
12.1% (16)
Illinois:
7.1% (19,606)
Number of households with income $75k - 100k:
Northlake:
2.3% (3)
State:
12.1% (33,349)
Number of households with income $100k - 125k:
Northlake:
54.5% (72)
Illinois:
9.7% (26,669)
Number of households with income $125k - 150k:
Northlake:
12.1% (16)
State:
7.3% (20,172)
Number of households with income $150k - 200k:
Northlake:
0.0% (0)
State:
11.5% (31,711)
Number of households with income > $200k:
Northlake:
0.0% (0)
Illinois:
23.1% (63,411)
Aggregate household income in Northlake in 2022: $13,510,972
Median family income in Northlake in 2022:
Northlake:
$105,203
Illinois:
$124,630
Number of families with income $30k - 40k:
Northlake:
18.7% (21)
State:
4.4% (8,628)
Number of families with income $40k - 50k:
Northlake:
2.6% (3)
State:
3.9% (7,584)
Number of families with income $60k - 75k:
Northlake:
16.7% (19)
Illinois:
7.0% (13,773)
Number of families with income $75k - 100k:
Northlake:
3.1% (3)
State:
12.3% (24,156)
Number of families with income $100k - 125k:
Northlake:
45.5% (52)
State:
9.6% (18,808)
Number of families with income $125k - 150k:
Northlake:
13.4% (15)
Illinois:
8.0% (15,639)
Median per capita income in Northlake in 2022:
Northlake:
$32,675
State:
$52,977
Change in median per capita income between 2000 and 2022:
Northlake, Illinois:
+70.9%
State:
+119.5%
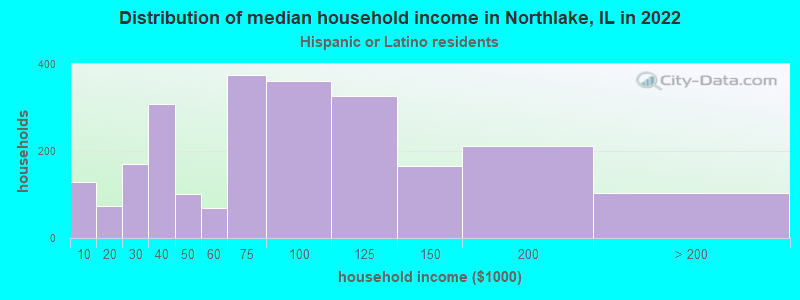
Income statistics for Hispanic or Latino residents
Median household income in Northlake, IL in 2022:
Northlake:
$73,638
State:
$72,139
Change in median household income between 2000 and 2022:
Northlake, Illinois:
+48.2%
Illinois:
+75.7%
Number of households with income < $10k:
Northlake:
5.4% (129)
Illinois:
4.9% (33,145)
Number of households with income $10k - 20k:
Northlake:
3.1% (74)
Illinois:
5.4% (36,345)
Number of households with income $20k - 30k:
Northlake:
7.1% (171)
Illinois:
7.5% (50,677)
Number of households with income $30k - 40k:
Northlake:
12.9% (308)
State:
7.7% (52,008)
Number of households with income $40k - 50k:
Northlake:
4.2% (101)
Illinois:
8.1% (54,702)
Number of households with income $50k - 60k:
Northlake:
2.9% (69)
State:
7.5% (51,062)
Number of households with income $60k - 75k:
Northlake:
15.6% (374)
Illinois:
11.3% (76,576)
Number of households with income $75k - 100k:
Northlake:
15.1% (362)
State:
15.5% (105,152)
Number of households with income $100k - 125k:
Northlake:
13.7% (327)
State:
11.5% (77,760)
Number of households with income $125k - 150k:
Northlake:
6.9% (165)
Illinois:
7.3% (49,310)
Number of households with income $150k - 200k:
Northlake:
8.9% (212)
State:
7.6% (51,233)
Number of households with income > $200k:
Northlake:
4.3% (103)
State:
5.9% (40,028)
Aggregate household income in Northlake in 2022: $202,978,272
Median family income in Northlake in 2022:
Northlake:
$88,960
State:
$76,467
Number of families with income < $10k:
Northlake:
3.7% (70)
State:
3.8% (19,330)
Number of families with income $10k - 20k:
Northlake:
2.5% (47)
State:
3.8% (19,314)
Number of families with income $20k - 30k:
Northlake:
7.5% (142)
State:
6.8% (34,467)
Number of families with income $30k - 40k:
Northlake:
8.2% (154)
State:
7.5% (37,976)
Number of families with income $40k - 50k:
Northlake:
3.8% (72)
State:
7.7% (38,858)
Number of families with income $50k - 60k:
Northlake:
4.1% (77)
State:
7.6% (38,606)
Number of families with income $60k - 75k:
Northlake:
13.6% (256)
State:
11.5% (58,164)
Number of families with income $75k - 100k:
Northlake:
18.7% (351)
Illinois:
16.0% (81,055)
Number of families with income $100k - 125k:
Northlake:
13.7% (258)
State:
12.1% (61,491)
Number of families with income $125k - 150k:
Northlake:
10.4% (196)
State:
8.0% (40,271)
Number of families with income $150k - 200k:
Northlake:
8.4% (157)
State:
8.6% (43,536)
Number of families with income > $200k:
Northlake:
5.4% (101)
State:
6.6% (33,240)
Median non-family income in Northlake in 2022:
Northlake:
$40,564
Illinois:
$45,965
Change in median non-family income between 2000 and 2022:
Northlake, Illinois:
+93.5%
Illinois:
+75.9%
Median per capita income in Northlake in 2022:
Northlake:
$26,042
State:
$26,551
Change in median per capita income between 2000 and 2022:
Northlake, Illinois:
+105.3%
Illinois:
+111.0%
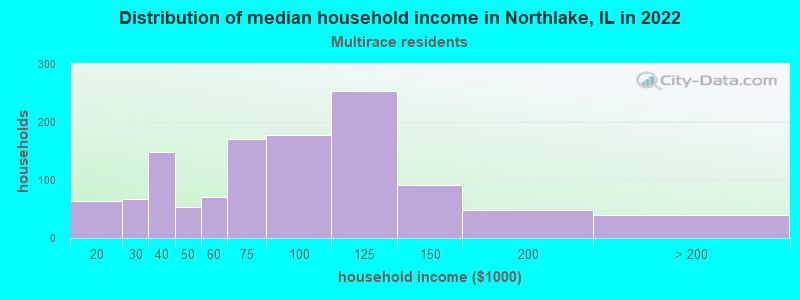
Income statistics for Multirace residents
Median household income in Northlake, IL in 2022:
Northlake:
$80,619
Illinois:
$71,185
Change in median household income between 2000 and 2022:
Northlake, Illinois:
+47.7%
Illinois:
+81.4%
Number of households with income < $10k:
Northlake:
0.0% (0)
State:
5.3% (21,595)
Number of households with income $10k - 20k:
Northlake:
5.3% (63)
Illinois:
6.5% (26,720)
Number of households with income $20k - 30k:
Northlake:
5.7% (67)
State:
8.0% (32,573)
Number of households with income $30k - 40k:
Northlake:
12.6% (149)
State:
8.4% (34,383)
Number of households with income $40k - 50k:
Northlake:
4.6% (54)
State:
7.4% (30,234)
Number of households with income $50k - 60k:
Northlake:
5.9% (70)
State:
6.9% (28,432)
Number of households with income $60k - 75k:
Northlake:
14.4% (170)
Illinois:
10.2% (41,780)
Number of households with income $75k - 100k:
Northlake:
15.0% (178)
State:
13.0% (53,426)
Number of households with income $100k - 125k:
Northlake:
21.4% (253)
Illinois:
10.5% (43,126)
Number of households with income $125k - 150k:
Northlake:
7.8% (92)
State:
7.6% (31,153)
Number of households with income $150k - 200k:
Northlake:
4.1% (49)
Illinois:
7.6% (30,946)
Number of households with income > $200k:
Northlake:
3.3% (39)
State:
8.6% (35,208)
Aggregate household income in Northlake in 2022: $96,408,045
Median family income in Northlake in 2022:
Northlake:
$100,290
State:
$84,400
Number of families with income $10k - 20k:
Northlake:
5.1% (44)
State:
4.2% (11,692)
Number of families with income $20k - 30k:
Northlake:
2.0% (17)
State:
6.3% (17,559)
Number of families with income $30k - 40k:
Northlake:
0.7% (6)
State:
7.5% (20,780)
Number of families with income $40k - 50k:
Northlake:
6.1% (53)
State:
7.1% (19,595)
Number of families with income $50k - 60k:
Northlake:
8.6% (74)
Illinois:
6.9% (19,177)
Number of families with income $60k - 75k:
Northlake:
5.2% (44)
Illinois:
9.3% (25,936)
Number of families with income $75k - 100k:
Northlake:
19.8% (170)
State:
13.6% (37,857)
Number of families with income $100k - 125k:
Northlake:
30.9% (266)
State:
12.2% (33,852)
Number of families with income $125k - 150k:
Northlake:
10.9% (94)
Illinois:
9.0% (25,085)
Number of families with income $150k - 200k:
Northlake:
6.0% (51)
State:
9.5% (26,306)
Number of families with income > $200k:
Northlake:
4.6% (39)
State:
10.4% (28,926)
Median non-family income in Northlake in 2022:
Northlake:
$36,549
Illinois:
$43,615
Change in median non-family income between 2000 and 2022:
Northlake, Illinois:
+72.0%
Illinois:
+77.3%
Median per capita income in Northlake in 2022:
Northlake:
$28,950
Illinois:
$29,285
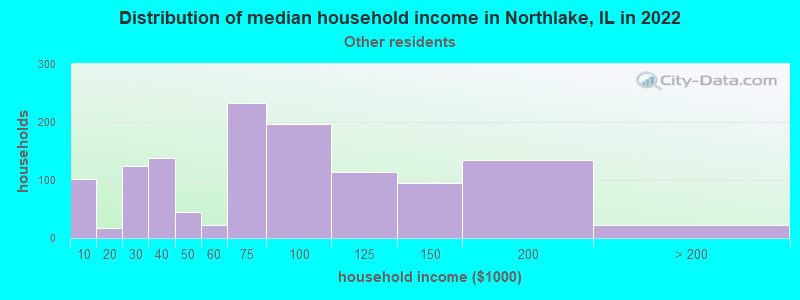
Income statistics for other residents
Median household income in Northlake, IL in 2022:
Northlake:
$73,897
Illinois:
$71,711
Number of households with income < $10k:
Northlake:
8.2% (102)
State:
5.7% (16,383)
Number of households with income $10k - 20k:
Northlake:
1.4% (17)
State:
4.8% (13,886)
Number of households with income $20k - 30k:
Northlake:
10.1% (125)
Illinois:
7.0% (20,054)
Number of households with income $30k - 40k:
Northlake:
11.1% (138)
State:
7.0% (20,038)
Number of households with income $40k - 50k:
Northlake:
3.6% (45)
State:
8.3% (23,759)
Number of households with income $50k - 60k:
Northlake:
1.9% (23)
Illinois:
7.8% (22,410)
Number of households with income $60k - 75k:
Northlake:
18.7% (232)
State:
12.0% (34,448)
Number of households with income $75k - 100k:
Northlake:
15.8% (196)
Illinois:
16.2% (46,508)
Number of households with income $100k - 125k:
Northlake:
9.2% (114)
State:
12.5% (35,952)
Number of households with income $125k - 150k:
Northlake:
7.6% (94)
Illinois:
6.9% (19,732)
Number of households with income $150k - 200k:
Northlake:
10.8% (134)
State:
7.5% (21,422)
Number of households with income > $200k:
Northlake:
1.8% (22)
State:
4.3% (12,194)
Aggregate household income in Northlake in 2022: $98,692,397
Median family income in Northlake in 2022:
Northlake:
$74,260
Illinois:
$74,069
Number of families with income < $10k:
Northlake:
5.7% (63)
Illinois:
4.1% (9,256)
Number of families with income $10k - 20k:
Northlake:
0.3% (4)
State:
3.3% (7,467)
Number of families with income $20k - 30k:
Northlake:
9.7% (107)
Illinois:
6.8% (15,193)
Number of families with income $30k - 40k:
Northlake:
8.2% (91)
Illinois:
7.6% (17,087)
Number of families with income $40k - 50k:
Northlake:
4.8% (53)
State:
8.1% (18,155)
Number of families with income $50k - 60k:
Northlake:
3.0% (33)
Illinois:
7.4% (16,614)
Number of families with income $60k - 75k:
Northlake:
20.4% (226)
State:
13.4% (30,011)
Number of families with income $75k - 100k:
Northlake:
23.2% (256)
State:
17.2% (38,560)
Number of families with income $100k - 125k:
Northlake:
3.1% (34)
Illinois:
12.3% (27,638)
Number of families with income $125k - 150k:
Northlake:
10.2% (113)
Illinois:
7.3% (16,287)
Number of families with income $150k - 200k:
Northlake:
9.4% (104)
Illinois:
7.7% (17,122)
Number of families with income > $200k:
Northlake:
1.9% (21)
State:
4.6% (10,400)
Median non-family income in Northlake in 2022:
Northlake:
$34,897
State:
$44,975
Change in median non-family income between 2000 and 2022:: -28.4%
Northlake, Illinois:
-28.4%
Illinois:
+80.6%
Median per capita income in Northlake in 2022:
Northlake:
$21,437
Illinois:
$25,392
Change in median per capita income between 2000 and 2022:
Northlake, Illinois:
+69.8%
Illinois:
+117.4%
Discuss Northlake, Illinois (IL) on our hugely popular Illinois forum.