The median household income in Northwest Harborcreek, PA in 2022 was $74,616, which was 3.8% greater than the median annual income of $71,798 across the entire state of Pennsylvania. Compared to the median income of $48,620 in 2000 this represents an increase of 34.8%. The per capita income in 2022 was $37,569, which means an increase of 43.7% compared to 2000 when it was $21,135.
Whole page based on the data from 2000 / 2022 when the population of Northwest Harborcreek, Pennsylvania was 8,658 / 8,960
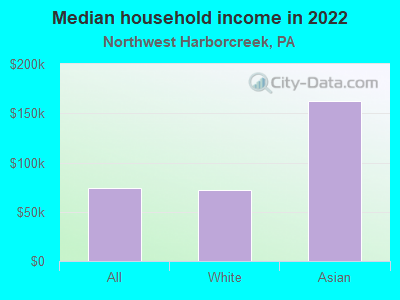
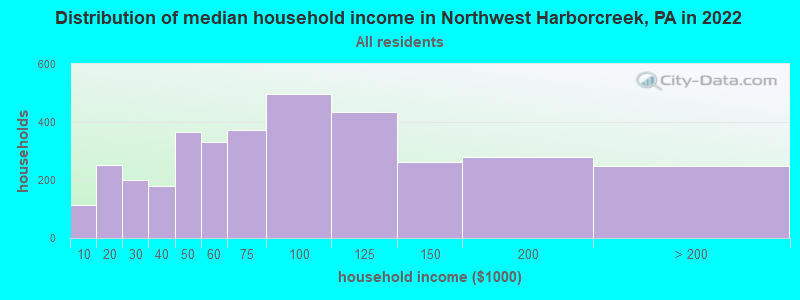
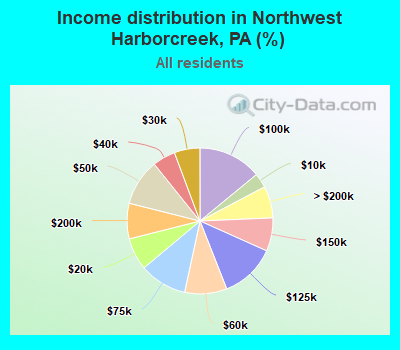
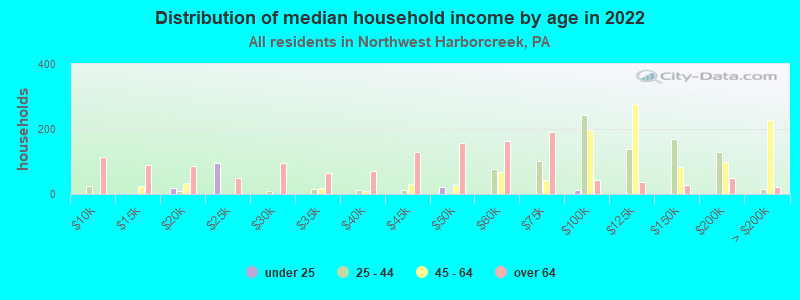
Income statistics for all residents
Median household income in Northwest Harborcreek, PA in 2022:
Northwest Harborcreek:
$74,617
Pennsylvania:
$71,798
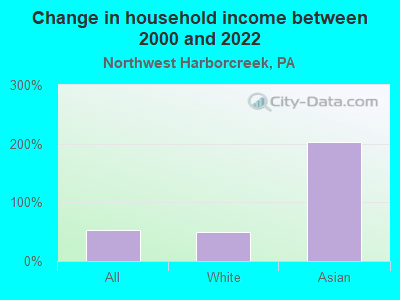
Change in median household income between 2000 and 2022:
Northwest Harborcreek, Pennsylvania:
+53.5%
State:
+79.0%
Number of households with income < $10k:
Northwest Harborcreek:
3.2% (114)
State:
5.5% (291,562)
Number of households with income $10k - 20k:
Northwest Harborcreek:
7.2% (253)
Pennsylvania:
7.3% (384,726)
Number of households with income $20k - 30k:
Northwest Harborcreek:
5.7% (201)
State:
7.4% (389,464)
Number of households with income $30k - 40k:
Northwest Harborcreek:
5.1% (180)
State:
7.6% (402,138)
Number of households with income $40k - 50k:
Northwest Harborcreek:
10.3% (365)
Pennsylvania:
7.3% (387,945)
Number of households with income $50k - 60k:
Northwest Harborcreek:
9.4% (331)
State:
7.0% (372,468)
Number of households with income $60k - 75k:
Northwest Harborcreek:
10.5% (372)
Pennsylvania:
9.9% (524,786)
Number of households with income $75k - 100k:
Northwest Harborcreek:
14.0% (497)
State:
12.6% (666,253)
Number of households with income $100k - 125k:
Northwest Harborcreek:
12.3% (436)
Pennsylvania:
9.9% (526,402)
Number of households with income $125k - 150k:
Northwest Harborcreek:
7.4% (261)
State:
6.9% (362,702)
Number of households with income $150k - 200k:
Northwest Harborcreek:
7.9% (278)
State:
8.3% (440,827)
Number of households with income > $200k:
Northwest Harborcreek:
7.1% (250)
Pennsylvania:
10.3% (544,792)
Aggregate household income in Northwest Harborcreek in 2022: $334,934,834
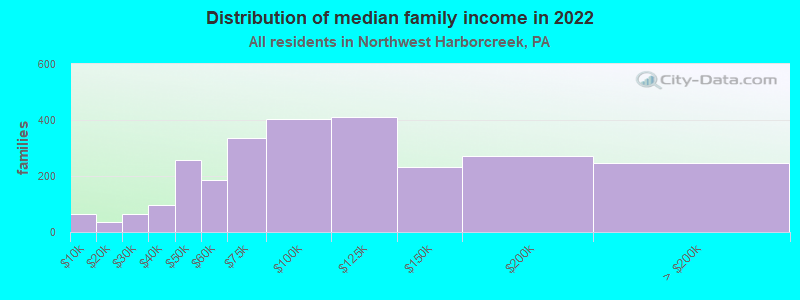
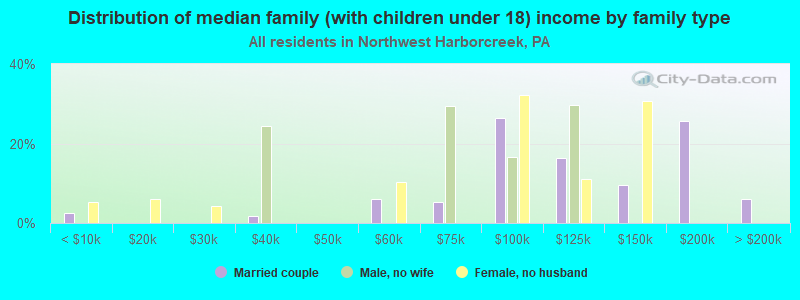
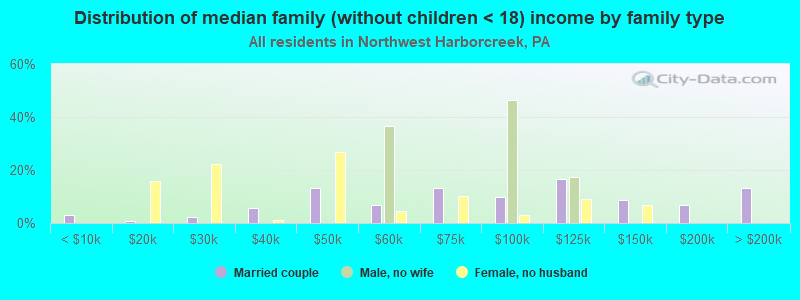
Median family income in Northwest Harborcreek in 2022:
Northwest Harborcreek:
$90,314
Pennsylvania:
$93,029
Number of families with income < $10k:
Northwest Harborcreek:
2.5% (64)
State:
3.1% (101,868)
Number of families with income $10k - 20k:
Northwest Harborcreek:
1.4% (35)
Pennsylvania:
3.5% (115,881)
Number of families with income $20k - 30k:
Northwest Harborcreek:
2.4% (63)
Pennsylvania:
4.8% (156,521)
Number of families with income $30k - 40k:
Northwest Harborcreek:
3.8% (98)
State:
5.8% (191,305)
Number of families with income $40k - 50k:
Northwest Harborcreek:
9.9% (257)
Pennsylvania:
6.4% (211,380)
Number of families with income $50k - 60k:
Northwest Harborcreek:
7.1% (185)
State:
6.4% (209,910)
Number of families with income $60k - 75k:
Northwest Harborcreek:
12.9% (336)
State:
9.7% (318,991)
Number of families with income $75k - 100k:
Northwest Harborcreek:
15.5% (403)
Pennsylvania:
14.0% (461,021)
Number of families with income $100k - 125k:
Northwest Harborcreek:
15.8% (412)
Pennsylvania:
12.2% (400,961)
Number of families with income $125k - 150k:
Northwest Harborcreek:
8.9% (233)
Pennsylvania:
8.8% (288,471)
Number of families with income $150k - 200k:
Northwest Harborcreek:
10.4% (270)
State:
11.2% (367,642)
Number of families with income > $200k:
Northwest Harborcreek:
9.4% (245)
State:
14.3% (470,863)
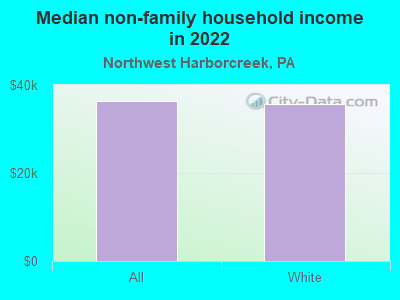
Median non-family income in Northwest Harborcreek in 2022:
Northwest Harborcreek:
$36,445
State:
$42,203
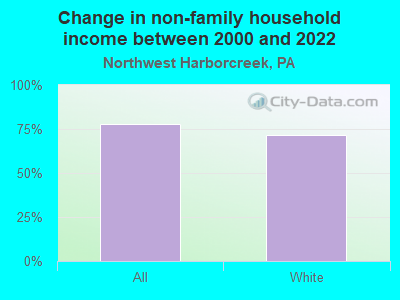
Change in median non-family income between 2000 and 2022:
Northwest Harborcreek, Pennsylvania:
+77.7%
Pennsylvania:
+90.1%
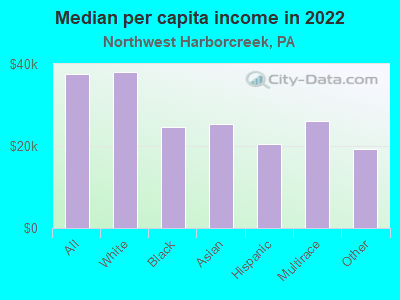
Median per capita income in Northwest Harborcreek in 2022:
Northwest Harborcreek:
$37,569
State:
$41,489
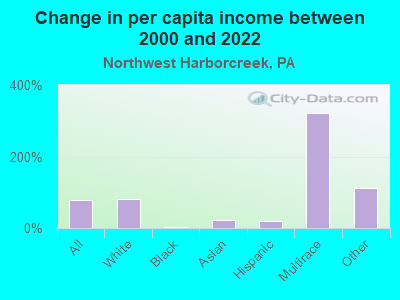
Change in median per capita income between 2000 and 2022:
Northwest Harborcreek, Pennsylvania:
+77.8%
State:
+98.7%
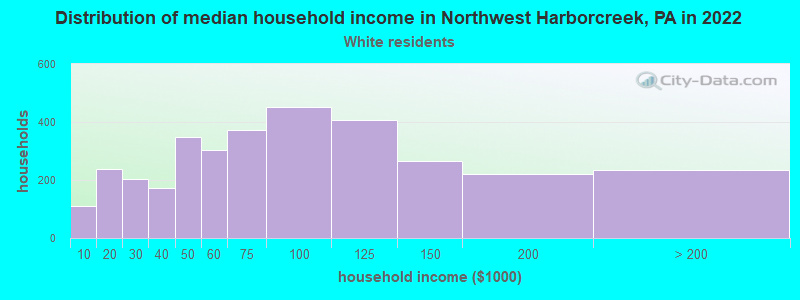
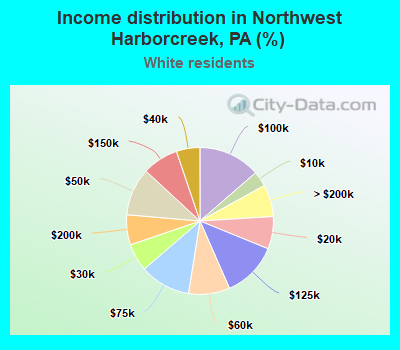
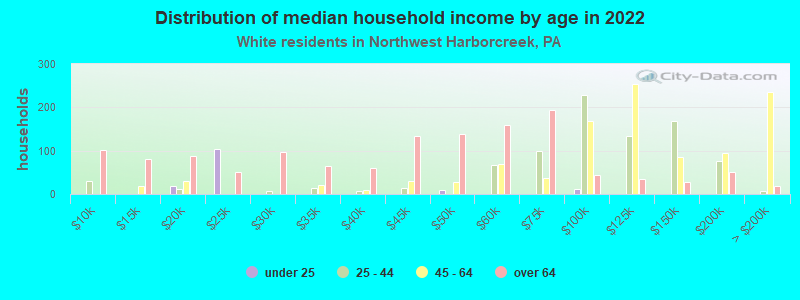
Income statistics for White residents
Median household income in Northwest Harborcreek, PA in 2022:
Northwest Harborcreek:
$72,555
State:
$76,765
Change in median household income between 2000 and 2022:
Northwest Harborcreek, Pennsylvania:
+49.3%
Pennsylvania:
+84.3%
Number of households with income < $10k:
Northwest Harborcreek:
3.3% (111)
Pennsylvania:
4.3% (179,792)
Number of households with income $10k - 20k:
Northwest Harborcreek:
7.1% (237)
Pennsylvania:
6.5% (268,738)
Number of households with income $20k - 30k:
Northwest Harborcreek:
6.1% (202)
Pennsylvania:
7.0% (288,138)
Number of households with income $30k - 40k:
Northwest Harborcreek:
5.2% (172)
Pennsylvania:
7.2% (300,208)
Number of households with income $40k - 50k:
Northwest Harborcreek:
10.5% (349)
Pennsylvania:
7.2% (298,756)
Number of households with income $50k - 60k:
Northwest Harborcreek:
9.1% (302)
State:
6.8% (283,251)
Number of households with income $60k - 75k:
Northwest Harborcreek:
11.2% (371)
State:
9.9% (408,159)
Number of households with income $75k - 100k:
Northwest Harborcreek:
13.6% (453)
State:
13.2% (547,809)
Number of households with income $100k - 125k:
Northwest Harborcreek:
12.2% (407)
Pennsylvania:
10.5% (436,652)
Number of households with income $125k - 150k:
Northwest Harborcreek:
7.9% (264)
Pennsylvania:
7.3% (304,132)
Number of households with income $150k - 200k:
Northwest Harborcreek:
6.6% (220)
Pennsylvania:
9.0% (374,658)
Number of households with income > $200k:
Northwest Harborcreek:
7.1% (235)
Pennsylvania:
10.9% (452,618)
Aggregate household income in Northwest Harborcreek in 2022: $309,258,572
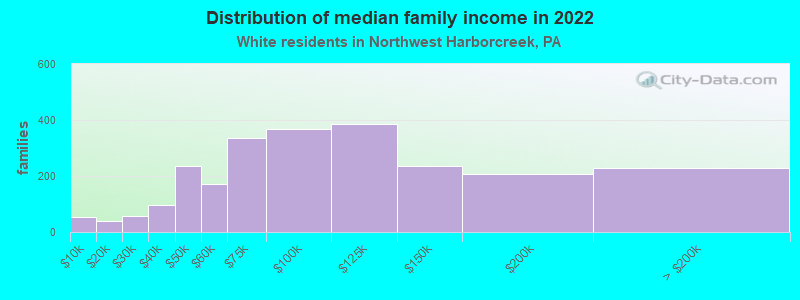
Median family income in Northwest Harborcreek in 2022:
Northwest Harborcreek:
$86,722
State:
$99,396
Number of families with income < $10k:
Northwest Harborcreek:
2.3% (55)
State:
2.2% (56,136)
Number of families with income $10k - 20k:
Northwest Harborcreek:
1.7% (41)
State:
2.7% (69,032)
Number of families with income $20k - 30k:
Northwest Harborcreek:
2.3% (57)
State:
3.9% (100,065)
Number of families with income $30k - 40k:
Northwest Harborcreek:
4.0% (97)
State:
5.2% (134,367)
Number of families with income $40k - 50k:
Northwest Harborcreek:
9.8% (237)
State:
6.0% (154,327)
Number of families with income $50k - 60k:
Northwest Harborcreek:
7.1% (173)
State:
6.1% (157,983)
Number of families with income $60k - 75k:
Northwest Harborcreek:
13.9% (337)
State:
9.6% (249,292)
Number of families with income $75k - 100k:
Northwest Harborcreek:
15.2% (368)
State:
14.7% (379,316)
Number of families with income $100k - 125k:
Northwest Harborcreek:
16.0% (387)
State:
12.9% (333,626)
Number of families with income $125k - 150k:
Northwest Harborcreek:
9.7% (236)
State:
9.4% (243,915)
Number of families with income $150k - 200k:
Northwest Harborcreek:
8.6% (208)
State:
12.2% (314,926)
Number of families with income > $200k:
Northwest Harborcreek:
9.4% (227)
State:
15.1% (390,885)
Median non-family income in Northwest Harborcreek in 2022:
Northwest Harborcreek:
$35,666
State:
$44,251
Change in median non-family income between 2000 and 2022:
Northwest Harborcreek, Pennsylvania:
+71.7%
State:
+94.2%
Median per capita income in Northwest Harborcreek in 2022:
Northwest Harborcreek:
$38,086
State:
$45,306
Change in median per capita income between 2000 and 2022:
Northwest Harborcreek, Pennsylvania:
+79.7%
State:
+105.4%
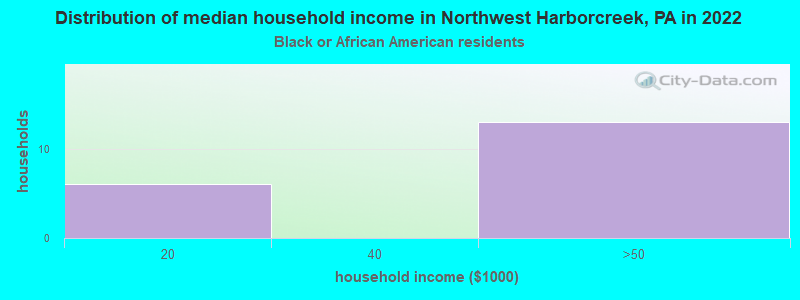
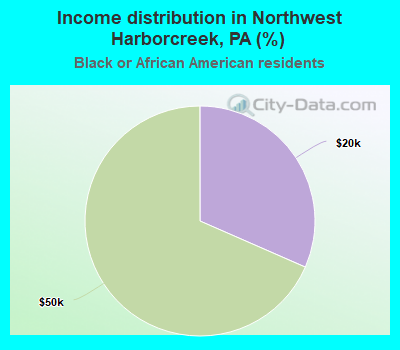
Income statistics for Black or African American residents
Number of households with income < $10k:
Northwest Harborcreek:
0.0% (0)
State:
12.0% (64,705)
Number of households with income $10k - 20k:
Northwest Harborcreek:
31.6% (6)
State:
12.7% (68,459)
Number of households with income $20k - 30k:
Northwest Harborcreek:
0.0% (0)
State:
9.3% (49,778)
Number of households with income $30k - 40k:
Northwest Harborcreek:
0.0% (0)
Pennsylvania:
10.0% (53,629)
Number of households with income $40k - 50k:
Northwest Harborcreek:
68.4% (13)
State:
8.5% (45,601)
Number of households with income $50k - 60k:
Northwest Harborcreek:
0.0% (0)
State:
7.8% (41,725)
Number of households with income $60k - 75k:
Northwest Harborcreek:
0.0% (0)
Pennsylvania:
10.4% (55,653)
Number of households with income $75k - 100k:
Northwest Harborcreek:
0.0% (0)
Pennsylvania:
9.5% (51,281)
Number of households with income $100k - 125k:
Northwest Harborcreek:
0.0% (0)
State:
7.1% (38,125)
Number of households with income $125k - 150k:
Northwest Harborcreek:
0.0% (0)
Pennsylvania:
4.5% (24,172)
Number of households with income $150k - 200k:
Northwest Harborcreek:
0.0% (0)
State:
4.0% (21,749)
Number of households with income > $200k:
Northwest Harborcreek:
0.0% (0)
State:
4.2% (22,562)
Aggregate household income in Northwest Harborcreek in 2022: $1,447,582
Median per capita income in Northwest Harborcreek in 2022:
Northwest Harborcreek:
$24,695
Pennsylvania:
$28,010
Change in median per capita income between 2000 and 2022:
Northwest Harborcreek, Pennsylvania:
+2.5%
State:
+101.5%
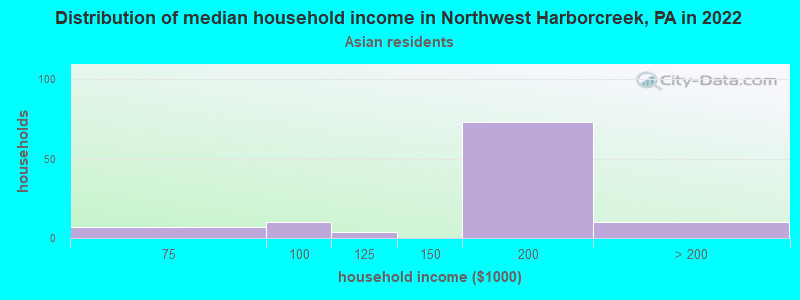
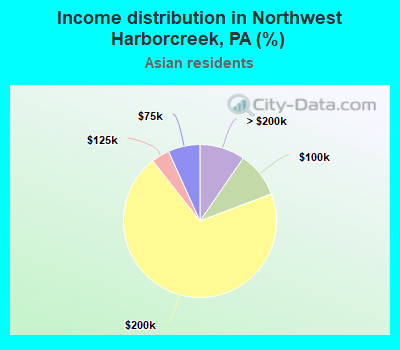
Income statistics for Asian residents
Median household income in Northwest Harborcreek, PA in 2022:
Northwest Harborcreek:
$162,347
State:
$98,296
Number of households with income < $10k:
Northwest Harborcreek:
0.0% (0)
State:
5.8% (9,650)
Number of households with income $10k - 20k:
Northwest Harborcreek:
0.0% (0)
State:
4.3% (7,158)
Number of households with income $20k - 30k:
Northwest Harborcreek:
0.0% (0)
Pennsylvania:
5.7% (9,531)
Number of households with income $30k - 40k:
Northwest Harborcreek:
0.0% (0)
State:
5.7% (9,580)
Number of households with income $40k - 50k:
Northwest Harborcreek:
0.0% (0)
Pennsylvania:
5.4% (9,050)
Number of households with income $50k - 60k:
Northwest Harborcreek:
0.0% (0)
State:
6.1% (10,189)
Number of households with income $60k - 75k:
Northwest Harborcreek:
6.7% (7)
Pennsylvania:
7.8% (13,008)
Number of households with income $75k - 100k:
Northwest Harborcreek:
9.6% (10)
State:
10.1% (16,923)
Number of households with income $100k - 125k:
Northwest Harborcreek:
3.8% (4)
Pennsylvania:
8.8% (14,765)
Number of households with income $125k - 150k:
Northwest Harborcreek:
0.0% (0)
State:
7.5% (12,634)
Number of households with income $150k - 200k:
Northwest Harborcreek:
70.2% (73)
Pennsylvania:
10.0% (16,823)
Number of households with income > $200k:
Northwest Harborcreek:
9.6% (10)
State:
22.9% (38,426)
Aggregate household income in Northwest Harborcreek in 2022: $15,327,516
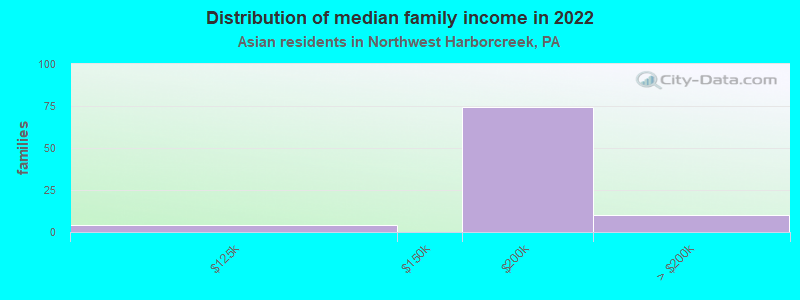
Median family income in Northwest Harborcreek in 2022:
Northwest Harborcreek:
$161,397
State:
$115,357
Number of families with income $100k - 125k:
Northwest Harborcreek:
4.6% (4)
State:
9.4% (11,585)
Number of families with income $150k - 200k:
Northwest Harborcreek:
84.1% (74)
State:
11.4% (14,081)
Number of families with income > $200k:
Northwest Harborcreek:
11.3% (10)
State:
27.8% (34,149)
Median per capita income in Northwest Harborcreek in 2022:
Northwest Harborcreek:
$25,415
State:
$48,341
Change in median per capita income between 2000 and 2022:
Northwest Harborcreek, Pennsylvania:
+22.7%
State:
+140.6%
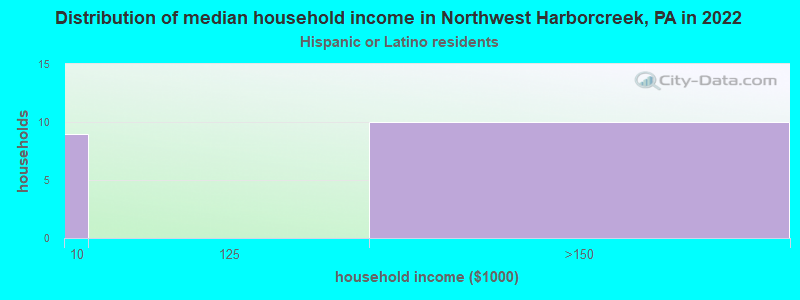
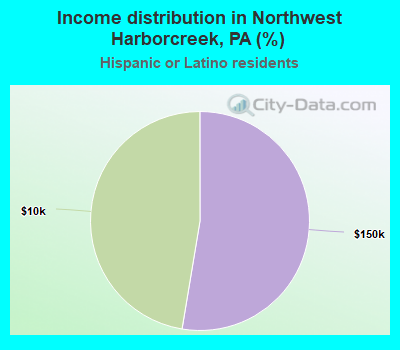
Income statistics for Hispanic or Latino residents
Number of households with income < $10k:
Northwest Harborcreek:
47.4% (9)
Pennsylvania:
8.7% (29,517)
Number of households with income $10k - 20k:
Northwest Harborcreek:
0.0% (0)
Pennsylvania:
10.0% (33,785)
Number of households with income $20k - 30k:
Northwest Harborcreek:
0.0% (0)
Pennsylvania:
9.9% (33,399)
Number of households with income $30k - 40k:
Northwest Harborcreek:
0.0% (0)
State:
8.8% (29,878)
Number of households with income $40k - 50k:
Northwest Harborcreek:
0.0% (0)
State:
8.5% (28,549)
Number of households with income $50k - 60k:
Northwest Harborcreek:
0.0% (0)
State:
7.6% (25,792)
Number of households with income $60k - 75k:
Northwest Harborcreek:
0.0% (0)
State:
10.6% (35,808)
Number of households with income $75k - 100k:
Northwest Harborcreek:
0.0% (0)
Pennsylvania:
11.9% (40,287)
Number of households with income $100k - 125k:
Northwest Harborcreek:
0.0% (0)
State:
8.0% (27,028)
Number of households with income $125k - 150k:
Northwest Harborcreek:
52.6% (10)
Pennsylvania:
5.2% (17,622)
Number of households with income $150k - 200k:
Northwest Harborcreek:
0.0% (0)
State:
5.2% (17,563)
Number of households with income > $200k:
Northwest Harborcreek:
0.0% (0)
Pennsylvania:
5.5% (18,469)
Aggregate household income in Northwest Harborcreek in 2022: $4,523,299
Median per capita income in Northwest Harborcreek in 2022:
Northwest Harborcreek:
$20,468
State:
$23,829
Change in median per capita income between 2000 and 2022:
Northwest Harborcreek, Pennsylvania:
+20.0%
State:
+116.4%
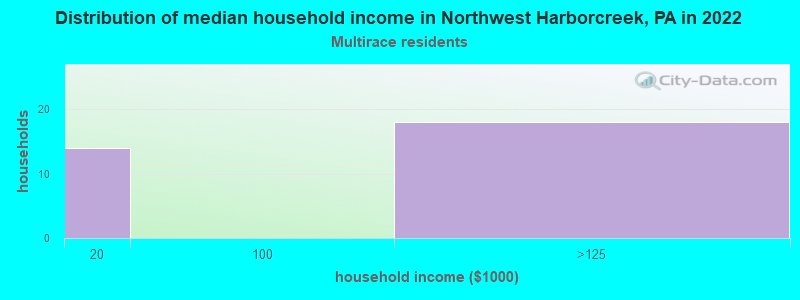
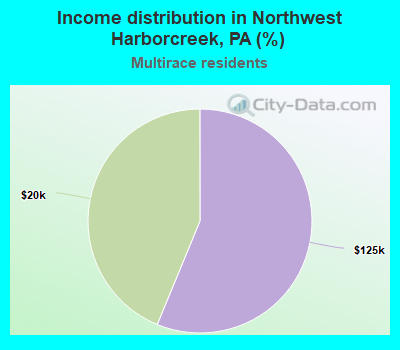
Income statistics for Multirace residents
Number of households with income < $10k:
Northwest Harborcreek:
0.0% (0)
Pennsylvania:
7.8% (21,911)
Number of households with income $10k - 20k:
Northwest Harborcreek:
43.8% (14)
State:
8.2% (22,847)
Number of households with income $20k - 30k:
Northwest Harborcreek:
0.0% (0)
State:
8.7% (24,252)
Number of households with income $30k - 40k:
Northwest Harborcreek:
0.0% (0)
State:
7.3% (20,502)
Number of households with income $40k - 50k:
Northwest Harborcreek:
0.0% (0)
State:
7.7% (21,525)
Number of households with income $50k - 60k:
Northwest Harborcreek:
0.0% (0)
State:
8.6% (24,174)
Number of households with income $60k - 75k:
Northwest Harborcreek:
0.0% (0)
State:
11.9% (33,350)
Number of households with income $75k - 100k:
Northwest Harborcreek:
0.0% (0)
Pennsylvania:
11.5% (32,274)
Number of households with income $100k - 125k:
Northwest Harborcreek:
56.2% (18)
Pennsylvania:
8.3% (23,361)
Number of households with income $125k - 150k:
Northwest Harborcreek:
0.0% (0)
State:
5.3% (14,784)
Number of households with income $150k - 200k:
Northwest Harborcreek:
0.0% (0)
Pennsylvania:
6.9% (19,314)
Number of households with income > $200k:
Northwest Harborcreek:
0.0% (0)
Pennsylvania:
7.8% (21,759)
Aggregate household income in Northwest Harborcreek in 2022: $3,181,290
Median per capita income in Northwest Harborcreek in 2022:
Northwest Harborcreek:
$26,075
State:
$27,581
Income statistics for other residents
Median per capita income in Northwest Harborcreek in 2022:
Northwest Harborcreek:
$19,201
State:
$24,779
Change in median per capita income between 2000 and 2022:
Northwest Harborcreek, Pennsylvania:
+113.3%
State:
+157.6%
Discuss Northwest Harborcreek, Pennsylvania (PA) on our hugely popular Pennsylvania forum.