Northwood, Pennsylvania (PA) income map, earnings map, and wages data

Data:
The per capita income in 2022 was $25,028, which means an increase of 33.1% compared to 2000 when it was $16,743.
Whole page based on the data from 2000 / 2022 when the population of Northwood, Pennsylvania was 296 / 145
Income statistics for all residents
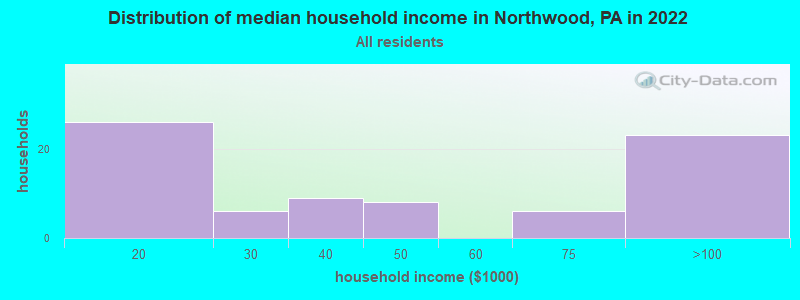
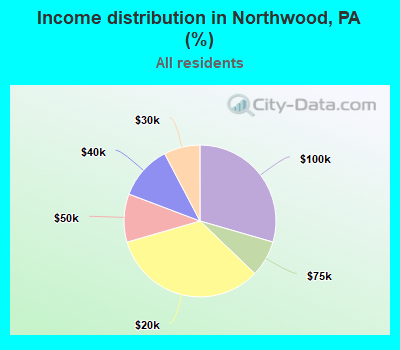
Number of households with income < $10k:| Northwood: | 0.0% (0) |
| State: | 5.5% (291,562) |
Number of households with income $10k - 20k:| Northwood: | 33.3% (26) |
| Pennsylvania: | 7.3% (384,726) |
Number of households with income $20k - 30k:| Northwood: | 7.7% (6) |
| Pennsylvania: | 7.4% (389,464) |
Number of households with income $30k - 40k:| Northwood: | 11.5% (9) |
| Pennsylvania: | 7.6% (402,138) |
Number of households with income $40k - 50k:| Northwood: | 10.3% (8) |
| State: | 7.3% (387,945) |
Number of households with income $50k - 60k:| Northwood: | 0.0% (0) |
| State: | 7.0% (372,468) |
Number of households with income $60k - 75k:| Northwood: | 7.7% (6) |
| Pennsylvania: | 9.9% (524,786) |
Number of households with income $75k - 100k:| Northwood: | 29.5% (23) |
| State: | 12.6% (666,253) |
Number of households with income $100k - 125k:| Northwood: | 0.0% (0) |
| State: | 9.9% (526,402) |
Number of households with income $125k - 150k:| Northwood: | 0.0% (0) |
| State: | 6.9% (362,702) |
Number of households with income $150k - 200k:| Northwood: | 0.0% (0) |
| State: | 8.3% (440,827) |
Number of households with income > $200k:| Northwood: | 0.0% (0) |
| State: | 10.3% (544,792) |
Aggregate household income in Northwood in 2022: $3,501,556
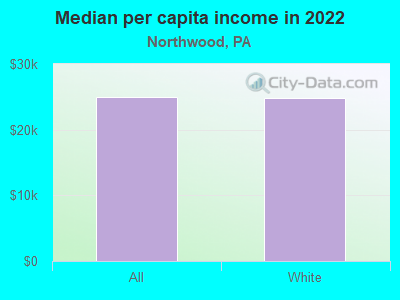
Median per capita income in Northwood in 2022:| Northwood: | $25,029 |
| State: | $41,489 |
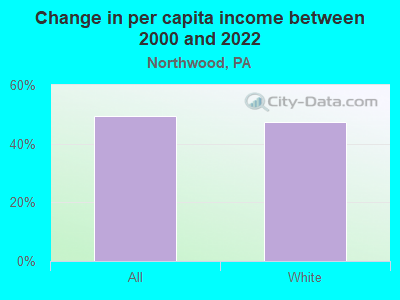
Change in median per capita income between 2000 and 2022:| Northwood, Pennsylvania: | +49.5% |
| State: | +98.7% |
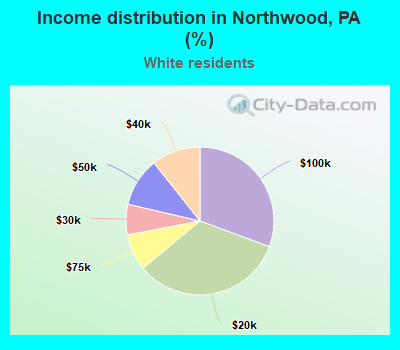
Income statistics for White residents
Number of households with income < $10k:| Northwood: | 0.0% (0) |
| Pennsylvania: | 4.3% (179,792) |
Number of households with income $10k - 20k:| Northwood: | 33.3% (25) |
| Pennsylvania: | 6.5% (268,738) |
Number of households with income $20k - 30k:| Northwood: | 6.7% (5) |
| Pennsylvania: | 7.0% (288,138) |
Number of households with income $30k - 40k:| Northwood: | 10.7% (8) |
| State: | 7.2% (300,208) |
Number of households with income $40k - 50k:| Northwood: | 10.7% (8) |
| Pennsylvania: | 7.2% (298,756) |
Number of households with income $50k - 60k:| Northwood: | 0.0% (0) |
| Pennsylvania: | 6.8% (283,251) |
Number of households with income $60k - 75k:| Northwood: | 8.0% (6) |
| State: | 9.9% (408,159) |
Number of households with income $75k - 100k:| Northwood: | 30.7% (23) |
| State: | 13.2% (547,809) |
Number of households with income $100k - 125k:| Northwood: | 0.0% (0) |
| State: | 10.5% (436,652) |
Number of households with income $125k - 150k:| Northwood: | 0.0% (0) |
| Pennsylvania: | 7.3% (304,132) |
Number of households with income $150k - 200k:| Northwood: | 0.0% (0) |
| State: | 9.0% (374,658) |
Number of households with income > $200k:| Northwood: | 0.0% (0) |
| State: | 10.9% (452,618) |
Aggregate household income in Northwood in 2022: $3,382,808
Median per capita income in Northwood in 2022:| Northwood: | $24,760 |
| Pennsylvania: | $45,306 |
Change in median per capita income between 2000 and 2022:| Northwood, Pennsylvania: | +47.4% |
| State: | +105.4% |