The median household income in Old Orchard Beach, ME in 2022 was $64,043, which was 8.6% less than the median annual income of $69,543 across the entire state of Maine. Compared to the median income of $36,568 in 2000 this represents an increase of 42.9%. The per capita income in 2022 was $45,799, which means an increase of 54.3% compared to 2000 when it was $20,929.
Whole page based on the data from 2000 / 2022 when the population of Old Orchard Beach, Maine was 8,856 / 9,212
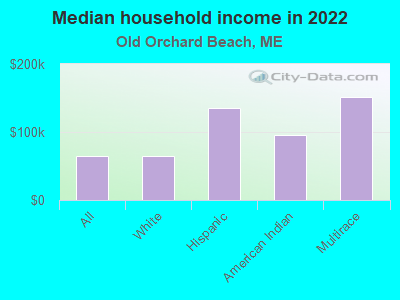
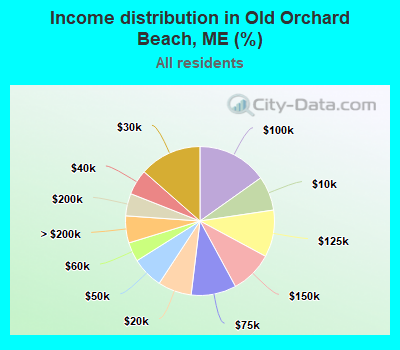
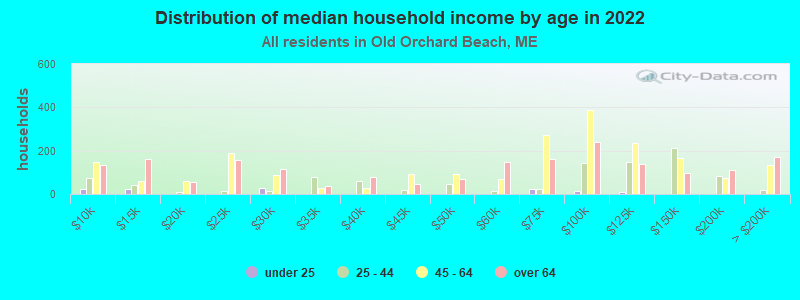
Income statistics for all residents
Median household income in Old Orchard Beach, ME in 2022:
Old Orchard Beach:
$64,043
State:
$69,543
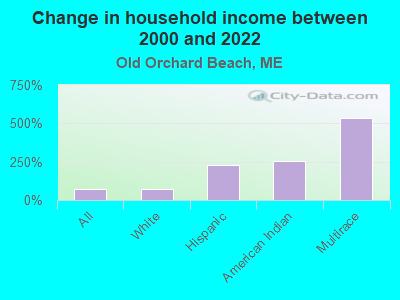
Change in median household income between 2000 and 2022:
Old Orchard Beach, Maine:
+75.1%
State:
+86.7%
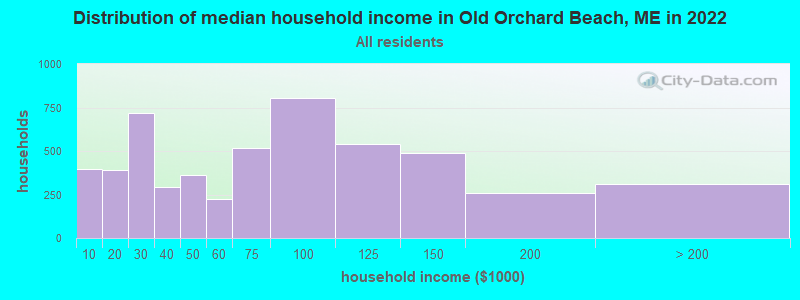
Number of households with income < $10k:
Old Orchard Beach:
7.5% (396)
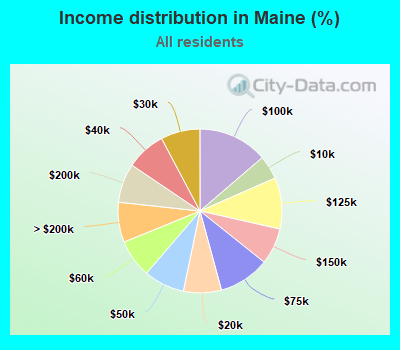
Maine:
4.7% (28,445)
Number of households with income $10k - 20k:
Old Orchard Beach:
7.3% (388)
Maine:
7.5% (45,280)
Number of households with income $20k - 30k:
Old Orchard Beach:
13.5% (716)
State:
7.7% (46,813)
Number of households with income $30k - 40k:
Old Orchard Beach:
5.5% (292)
State:
7.8% (47,357)
Number of households with income $40k - 50k:
Old Orchard Beach:
6.8% (362)
Maine:
8.0% (48,625)
Number of households with income $50k - 60k:
Old Orchard Beach:
4.2% (222)
Maine:
7.5% (45,566)
Number of households with income $60k - 75k:
Old Orchard Beach:
9.8% (520)
State:
10.1% (60,924)
Number of households with income $75k - 100k:
Old Orchard Beach:
15.2% (805)
State:
13.7% (83,142)
Number of households with income $100k - 125k:
Old Orchard Beach:
10.2% (542)
State:
10.1% (61,186)
Number of households with income $125k - 150k:
Old Orchard Beach:
9.2% (489)
State:
7.2% (43,500)
Number of households with income $150k - 200k:
Old Orchard Beach:
4.9% (258)
State:
7.7% (46,696)
Number of households with income > $200k:
Old Orchard Beach:
5.9% (311)
State:
7.9% (47,804)
Aggregate household income in Old Orchard Beach in 2022: $424,918,061
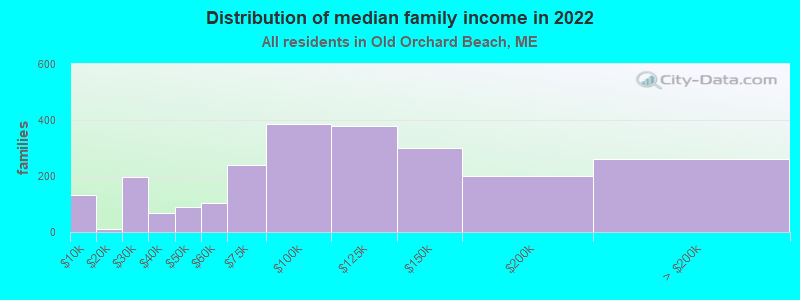
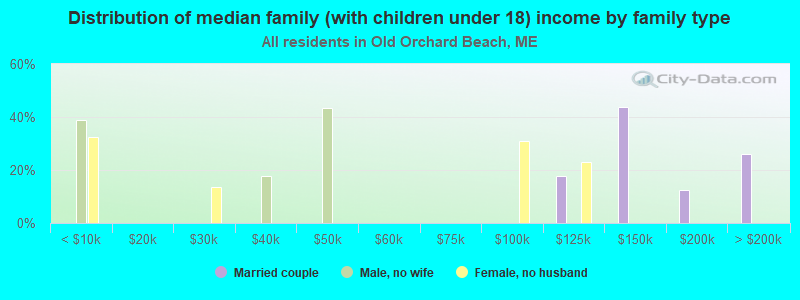
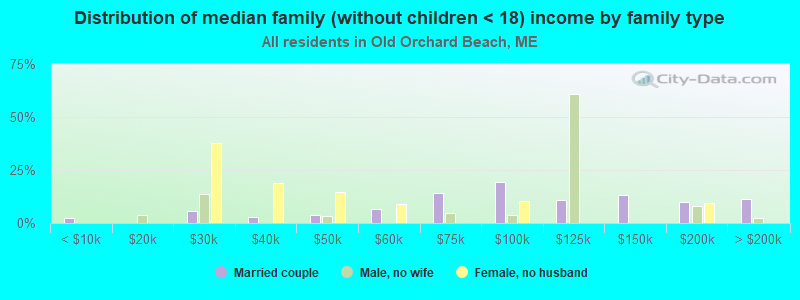
Median family income in Old Orchard Beach in 2022:
Old Orchard Beach:
$97,679
State:
$88,063
Number of families with income < $10k:
Old Orchard Beach:
5.6% (133)
State:
2.1% (7,963)
Number of families with income $10k - 20k:
Old Orchard Beach:
0.5% (12)
Maine:
3.1% (11,615)
Number of families with income $20k - 30k:
Old Orchard Beach:
8.3% (196)
State:
4.6% (17,138)
Number of families with income $30k - 40k:
Old Orchard Beach:
2.9% (67)
State:
6.2% (22,860)
Number of families with income $40k - 50k:
Old Orchard Beach:
3.8% (90)
State:
7.1% (26,244)
Number of families with income $50k - 60k:
Old Orchard Beach:
4.4% (105)
State:
7.5% (27,679)
Number of families with income $60k - 75k:
Old Orchard Beach:
10.0% (238)
State:
10.8% (39,930)
Number of families with income $75k - 100k:
Old Orchard Beach:
16.3% (385)
State:
15.4% (57,091)
Number of families with income $100k - 125k:
Old Orchard Beach:
16.0% (378)
Maine:
12.8% (47,435)
Number of families with income $125k - 150k:
Old Orchard Beach:
12.7% (300)
Maine:
9.0% (33,513)
Number of families with income $150k - 200k:
Old Orchard Beach:
8.4% (200)
State:
10.2% (37,888)
Number of families with income > $200k:
Old Orchard Beach:
11.1% (262)
State:
11.2% (41,579)
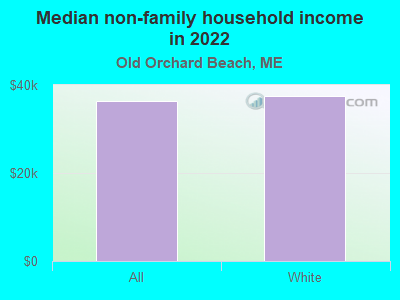
Median non-family income in Old Orchard Beach in 2022:
Old Orchard Beach:
$36,313
State:
$40,639
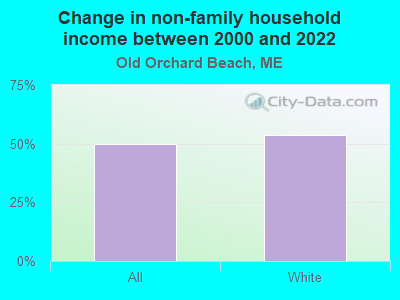
Change in median non-family income between 2000 and 2022:
Old Orchard Beach, Maine:
+49.7%
State:
+87.1%
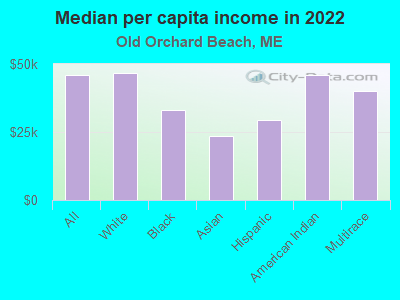
Median per capita income in Old Orchard Beach in 2022:
Old Orchard Beach:
$45,799
Maine:
$41,188
Change in median per capita income between 2000 and 2022:
Old Orchard Beach, Maine:
+118.8%
Maine:
+110.9%
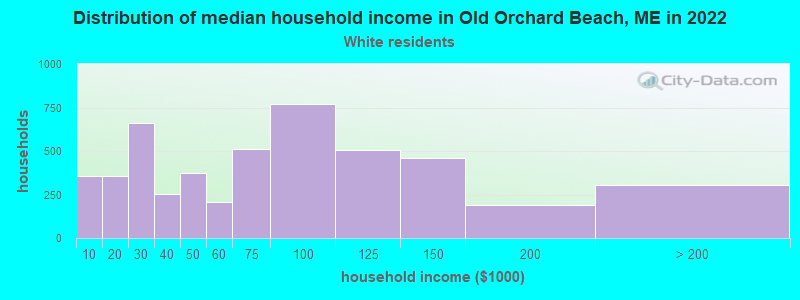
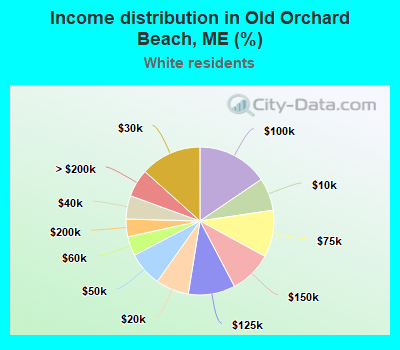
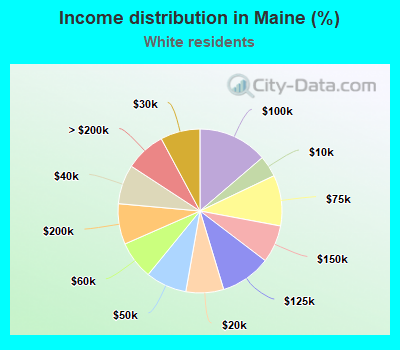
Income statistics for White residents
Median household income in Old Orchard Beach, ME in 2022:
Old Orchard Beach:
$64,116
Maine:
$70,228
Change in median household income between 2000 and 2022:
Old Orchard Beach, Maine:
+74.5%
State:
+87.7%
Number of households with income < $10k:
Old Orchard Beach:
7.2% (355)
State:
4.2% (23,567)
Number of households with income $10k - 20k:
Old Orchard Beach:
7.2% (358)
State:
7.4% (41,770)
Number of households with income $20k - 30k:
Old Orchard Beach:
13.4% (661)
State:
7.8% (43,842)
Number of households with income $30k - 40k:
Old Orchard Beach:
5.1% (253)
State:
7.8% (43,575)
Number of households with income $40k - 50k:
Old Orchard Beach:
7.6% (374)
Maine:
8.1% (45,444)
Number of households with income $50k - 60k:
Old Orchard Beach:
4.2% (209)
State:
7.5% (42,240)
Number of households with income $60k - 75k:
Old Orchard Beach:
10.3% (509)
Maine:
10.0% (56,153)
Number of households with income $75k - 100k:
Old Orchard Beach:
15.5% (768)
Maine:
13.7% (76,982)
Number of households with income $100k - 125k:
Old Orchard Beach:
10.3% (508)
Maine:
10.0% (55,945)
Number of households with income $125k - 150k:
Old Orchard Beach:
9.3% (462)
Maine:
7.4% (41,559)
Number of households with income $150k - 200k:
Old Orchard Beach:
3.9% (192)
State:
8.0% (44,909)
Number of households with income > $200k:
Old Orchard Beach:
6.1% (302)
State:
8.0% (44,738)
Aggregate household income in Old Orchard Beach in 2022: $395,737,434
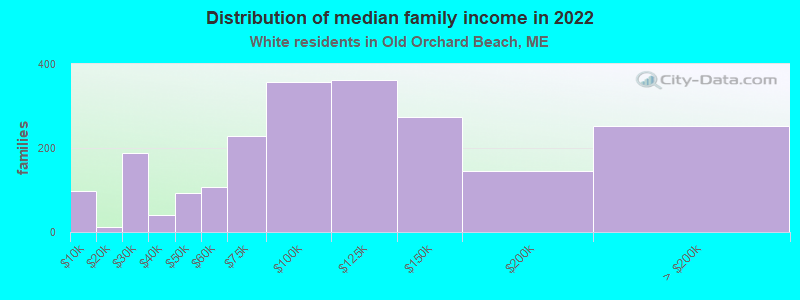
Median family income in Old Orchard Beach in 2022:
Old Orchard Beach:
$96,700
Maine:
$89,589
Number of families with income < $10k:
Old Orchard Beach:
4.5% (98)
Maine:
1.7% (5,845)
Number of families with income $10k - 20k:
Old Orchard Beach:
0.6% (12)
State:
3.2% (10,865)
Number of families with income $20k - 30k:
Old Orchard Beach:
8.7% (189)
State:
4.4% (15,170)
Number of families with income $30k - 40k:
Old Orchard Beach:
1.9% (41)
State:
6.2% (21,234)
Number of families with income $40k - 50k:
Old Orchard Beach:
4.4% (94)
State:
7.0% (23,965)
Number of families with income $50k - 60k:
Old Orchard Beach:
4.9% (107)
State:
7.6% (26,226)
Number of families with income $60k - 75k:
Old Orchard Beach:
10.6% (229)
State:
10.6% (36,513)
Number of families with income $75k - 100k:
Old Orchard Beach:
16.6% (358)
Maine:
15.3% (52,781)
Number of families with income $100k - 125k:
Old Orchard Beach:
16.8% (363)
State:
12.7% (43,845)
Number of families with income $125k - 150k:
Old Orchard Beach:
12.7% (274)
State:
9.4% (32,319)
Number of families with income $150k - 200k:
Old Orchard Beach:
6.7% (145)
State:
10.6% (36,366)
Number of families with income > $200k:
Old Orchard Beach:
11.7% (253)
Maine:
11.3% (39,003)
Median non-family income in Old Orchard Beach in 2022:
Old Orchard Beach:
$37,434
State:
$40,779
Change in median non-family income between 2000 and 2022:
Old Orchard Beach, Maine:
+53.8%
Maine:
+87.4%
Median per capita income in Old Orchard Beach in 2022:
Old Orchard Beach:
$46,545
State:
$41,797
Change in median per capita income between 2000 and 2022:
Old Orchard Beach, Maine:
+119.8%
Maine:
+111.9%
Income statistics for Black or African American residents
Median per capita income in Old Orchard Beach in 2022:
Old Orchard Beach:
$32,989
State:
$30,454
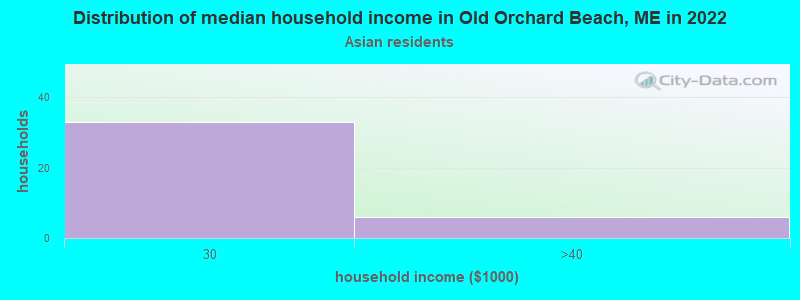
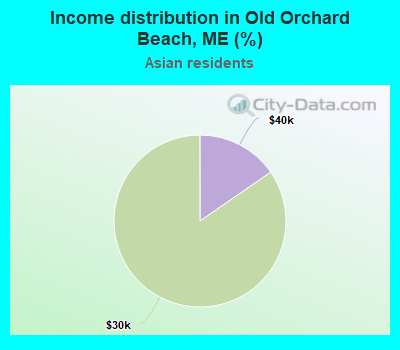
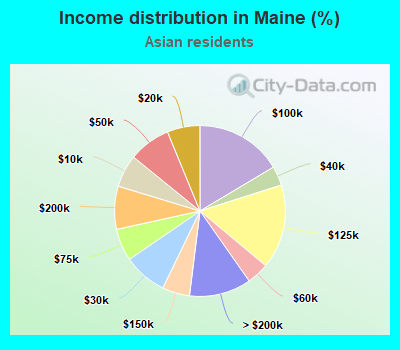
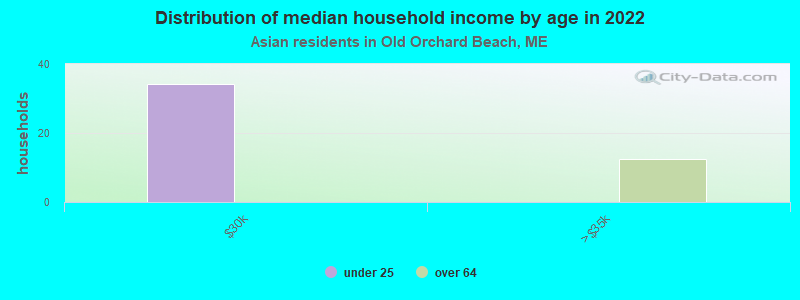
Income statistics for Asian residents
Number of households with income < $10k:
Old Orchard Beach:
0.0% (0)
State:
6.2% (326)
Number of households with income $10k - 20k:
Old Orchard Beach:
0.0% (0)
Maine:
6.2% (328)
Number of households with income $20k - 30k:
Old Orchard Beach:
84.6% (33)
State:
8.3% (438)
Number of households with income $30k - 40k:
Old Orchard Beach:
15.4% (6)
State:
3.7% (194)
Number of households with income $40k - 50k:
Old Orchard Beach:
0.0% (0)
Maine:
7.9% (420)
Number of households with income $50k - 60k:
Old Orchard Beach:
0.0% (0)
State:
4.2% (222)
Number of households with income $60k - 75k:
Old Orchard Beach:
0.0% (0)
Maine:
6.1% (323)
Number of households with income $75k - 100k:
Old Orchard Beach:
0.0% (0)
State:
16.4% (870)
Number of households with income $100k - 125k:
Old Orchard Beach:
0.0% (0)
Maine:
16.0% (845)
Number of households with income $125k - 150k:
Old Orchard Beach:
0.0% (0)
State:
5.2% (275)
Number of households with income $150k - 200k:
Old Orchard Beach:
0.0% (0)
State:
8.2% (432)
Number of households with income > $200k:
Old Orchard Beach:
0.0% (0)
Maine:
11.7% (620)
Median per capita income in Old Orchard Beach in 2022:
Old Orchard Beach:
$23,391
State:
$49,725
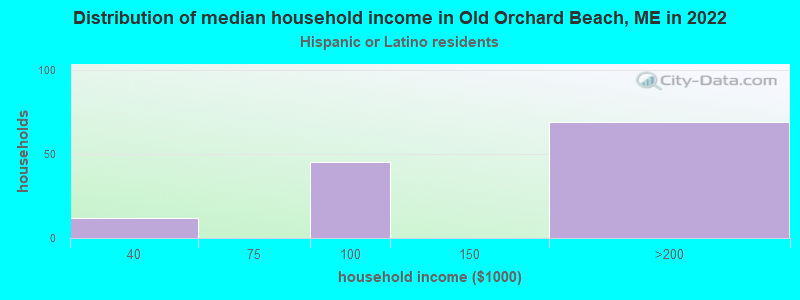
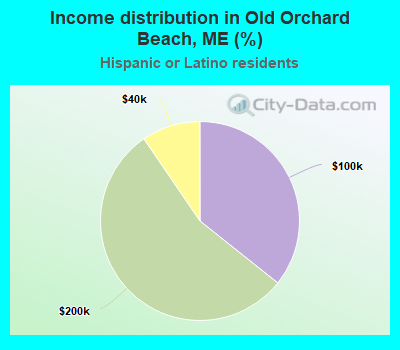
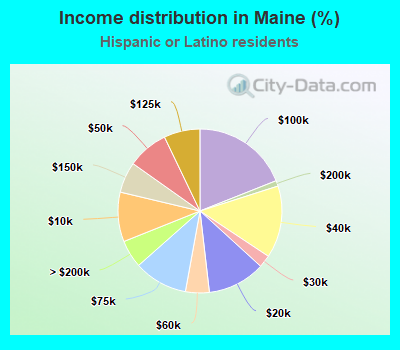
Income statistics for Hispanic or Latino residents
Median household income in Old Orchard Beach, ME in 2022:
Old Orchard Beach:
$134,824
State:
$58,750
Number of households with income < $10k:
Old Orchard Beach:
0.0% (0)
State:
9.8% (882)
Number of households with income $10k - 20k:
Old Orchard Beach:
0.0% (0)
Maine:
11.4% (1,027)
Number of households with income $20k - 30k:
Old Orchard Beach:
0.0% (0)
Maine:
2.5% (221)
Number of households with income $30k - 40k:
Old Orchard Beach:
9.5% (12)
State:
14.2% (1,284)
Number of households with income $40k - 50k:
Old Orchard Beach:
0.0% (0)
State:
8.1% (727)
Number of households with income $50k - 60k:
Old Orchard Beach:
0.0% (0)
State:
4.7% (423)
Number of households with income $60k - 75k:
Old Orchard Beach:
0.0% (0)
State:
10.6% (956)
Number of households with income $75k - 100k:
Old Orchard Beach:
35.7% (45)
Maine:
19.0% (1,711)
Number of households with income $100k - 125k:
Old Orchard Beach:
0.0% (0)
State:
7.1% (642)
Number of households with income $125k - 150k:
Old Orchard Beach:
0.0% (0)
State:
6.1% (549)
Number of households with income $150k - 200k:
Old Orchard Beach:
54.8% (69)
State:
1.1% (99)
Number of households with income > $200k:
Old Orchard Beach:
0.0% (0)
State:
5.5% (493)
Aggregate household income in Old Orchard Beach in 2022: $7,464,921
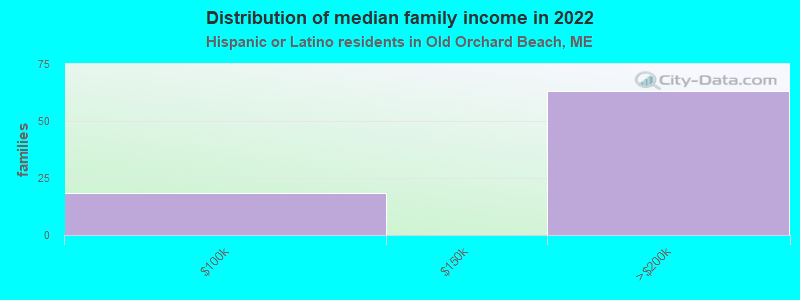
Median family income in Old Orchard Beach in 2022:
Old Orchard Beach:
$112,618
State:
$60,202
Number of families with income $75k - 100k:
Old Orchard Beach:
22.5% (18)
Maine:
12.2% (602)
Number of families with income $150k - 200k:
Old Orchard Beach:
77.5% (63)
State:
0.0% (0)
Median per capita income in Old Orchard Beach in 2022:
Old Orchard Beach:
$29,365
State:
$31,794
Change in median per capita income between 2000 and 2022:: -11.3%
Old Orchard Beach, Maine:
-11.3%
Maine:
+114.2%
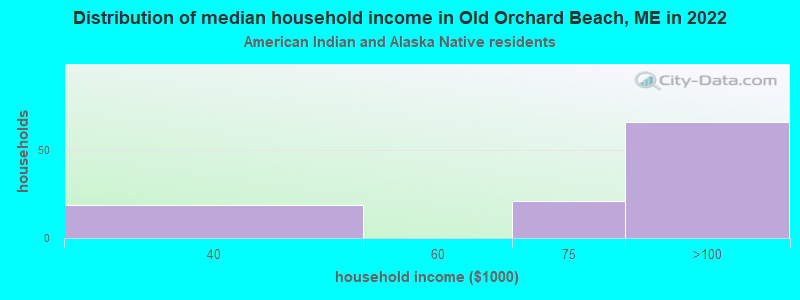
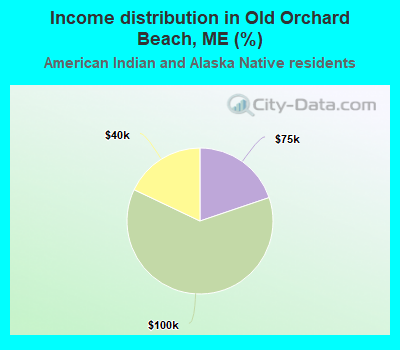
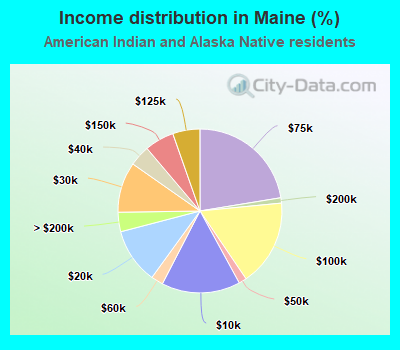
Income statistics for American Indian and Alaska Native residents
Median household income in Old Orchard Beach, ME in 2022:
Old Orchard Beach:
$95,436
State:
$61,365
Number of households with income < $10k:
Old Orchard Beach:
0.0% (0)
State:
15.5% (498)
Number of households with income $10k - 20k:
Old Orchard Beach:
0.0% (0)
Maine:
11.0% (351)
Number of households with income $20k - 30k:
Old Orchard Beach:
0.0% (0)
State:
10.0% (319)
Number of households with income $30k - 40k:
Old Orchard Beach:
17.9% (19)
State:
4.1% (131)
Number of households with income $40k - 50k:
Old Orchard Beach:
0.0% (0)
State:
1.5% (49)
Number of households with income $50k - 60k:
Old Orchard Beach:
0.0% (0)
State:
2.4% (76)
Number of households with income $60k - 75k:
Old Orchard Beach:
19.8% (21)
Maine:
22.4% (718)
Number of households with income $75k - 100k:
Old Orchard Beach:
62.3% (66)
State:
17.0% (546)
Number of households with income $100k - 125k:
Old Orchard Beach:
0.0% (0)
Maine:
5.4% (172)
Number of households with income $125k - 150k:
Old Orchard Beach:
0.0% (0)
State:
5.8% (186)
Number of households with income $150k - 200k:
Old Orchard Beach:
0.0% (0)
State:
1.1% (34)
Number of households with income > $200k:
Old Orchard Beach:
0.0% (0)
State:
3.8% (123)
Aggregate household income in Old Orchard Beach in 2022: $5,239,467
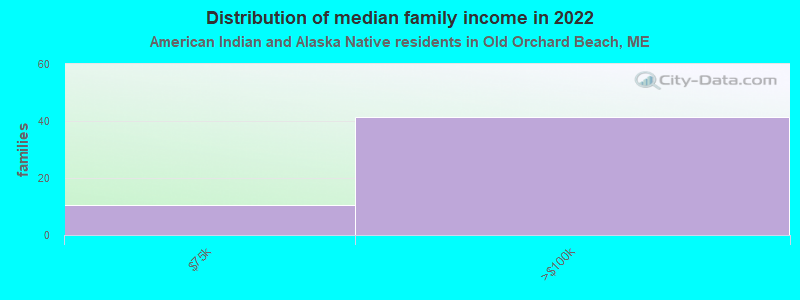
Median family income in Old Orchard Beach in 2022:
Old Orchard Beach:
$94,969
Maine:
$60,255
Number of families with income $60k - 75k:
Old Orchard Beach:
20.1% (10)
State:
13.7% (230)
Number of families with income $75k - 100k:
Old Orchard Beach:
79.9% (42)
State:
12.7% (213)
Median per capita income in Old Orchard Beach in 2022:
Old Orchard Beach:
$46,004
Maine:
$30,025
Change in median per capita income between 2000 and 2022:
Old Orchard Beach, Maine:
+108.3%
State:
+136.4%
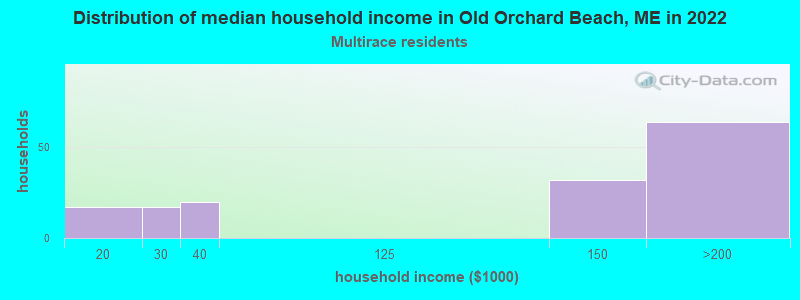
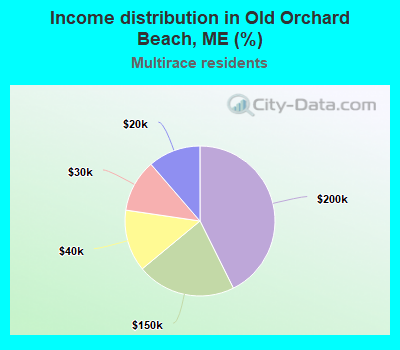
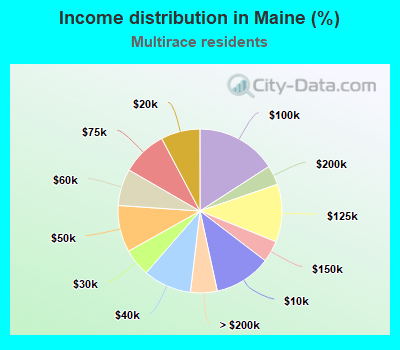
Income statistics for Multirace residents
Median household income in Old Orchard Beach, ME in 2022:
Old Orchard Beach:
$151,794
State:
$59,540
Number of households with income < $10k:
Old Orchard Beach:
0.0% (0)
Maine:
11.2% (2,930)
Number of households with income $10k - 20k:
Old Orchard Beach:
11.3% (17)
Maine:
7.7% (2,015)
Number of households with income $20k - 30k:
Old Orchard Beach:
11.3% (17)
State:
5.5% (1,422)
Number of households with income $30k - 40k:
Old Orchard Beach:
13.3% (20)
State:
9.5% (2,484)
Number of households with income $40k - 50k:
Old Orchard Beach:
0.0% (0)
State:
9.2% (2,405)
Number of households with income $50k - 60k:
Old Orchard Beach:
0.0% (0)
State:
7.3% (1,893)
Number of households with income $60k - 75k:
Old Orchard Beach:
0.0% (0)
State:
8.9% (2,330)
Number of households with income $75k - 100k:
Old Orchard Beach:
0.0% (0)
Maine:
15.9% (4,140)
Number of households with income $100k - 125k:
Old Orchard Beach:
0.0% (0)
Maine:
11.4% (2,972)
Number of households with income $125k - 150k:
Old Orchard Beach:
21.3% (32)
State:
4.2% (1,106)
Number of households with income $150k - 200k:
Old Orchard Beach:
42.7% (64)
Maine:
3.9% (1,008)
Number of households with income > $200k:
Old Orchard Beach:
0.0% (0)
Maine:
5.3% (1,377)
Aggregate household income in Old Orchard Beach in 2022: $20,369,633
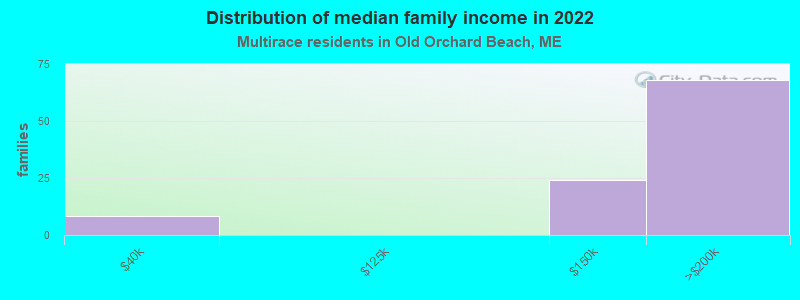
Median family income in Old Orchard Beach in 2022:
Old Orchard Beach:
$152,055
State:
$74,759
Number of families with income $30k - 40k:
Old Orchard Beach:
8.3% (8)
Maine:
7.9% (1,160)
Number of families with income $125k - 150k:
Old Orchard Beach:
23.9% (24)
State:
3.7% (545)
Number of families with income $150k - 200k:
Old Orchard Beach:
67.8% (68)
State:
6.4% (940)
Median per capita income in Old Orchard Beach in 2022:
Old Orchard Beach:
$40,129
Maine:
$32,995
Discuss Old Orchard Beach, Maine (ME) on our hugely popular Maine forum.