The median household income in Oliver Springs, TN in 2022 was $48,597, which was 34.3% less than the median annual income of $65,254 across the entire state of Tennessee. Compared to the median income of $32,620 in 2000 this represents an increase of 32.9%. The per capita income in 2022 was $23,909, which means an increase of 33.8% compared to 2000 when it was $15,818.
Whole page based on the data from 2000 / 2022 when the population of Oliver Springs, Tennessee was 3,303 / 3,796
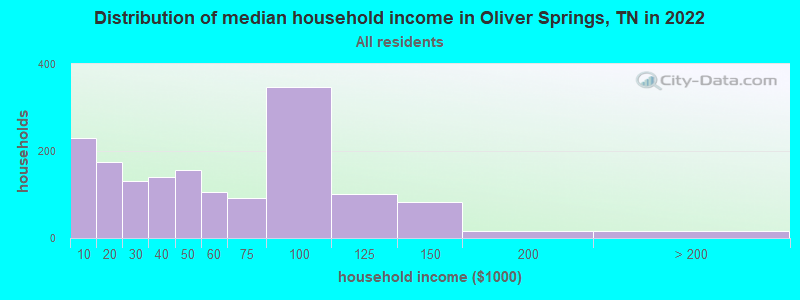
Income statistics for all residents
Median household income in Oliver Springs, TN in 2022:
Oliver Springs:
$48,598
State:
$65,254
Change in median household income between 2000 and 2022:
Oliver Springs, Tennessee:
+49.0%
State:
+79.5%
Number of households with income < $10k:
Oliver Springs:
14.4% (229)
Tennessee:
5.4% (154,793)
Number of households with income $10k - 20k:
Oliver Springs:
10.9% (174)
State:
8.0% (228,599)
Number of households with income $20k - 30k:
Oliver Springs:
8.2% (130)
Tennessee:
7.9% (224,908)
Number of households with income $30k - 40k:
Oliver Springs:
8.9% (141)
State:
8.6% (244,297)
Number of households with income $40k - 50k:
Oliver Springs:
9.9% (157)
State:
8.4% (238,949)
Number of households with income $50k - 60k:
Oliver Springs:
6.7% (106)
State:
7.7% (218,438)
Number of households with income $60k - 75k:
Oliver Springs:
5.8% (92)
State:
10.3% (294,172)
Number of households with income $75k - 100k:
Oliver Springs:
21.7% (346)
State:
13.3% (377,310)
Number of households with income $100k - 125k:
Oliver Springs:
6.3% (101)
Tennessee:
9.5% (269,124)
Number of households with income $125k - 150k:
Oliver Springs:
5.2% (83)
State:
6.3% (178,328)
Number of households with income $150k - 200k:
Oliver Springs:
1.0% (16)
State:
7.2% (204,030)
Number of households with income > $200k:
Oliver Springs:
1.0% (16)
State:
7.5% (213,736)
Aggregate household income in Oliver Springs in 2022: $89,565,663
Median family income in Oliver Springs in 2022:
Oliver Springs:
$56,007
Tennessee:
$80,910
Number of families with income < $10k:
Oliver Springs:
10.0% (97)
Tennessee:
3.9% (72,917)
Number of families with income $10k - 20k:
Oliver Springs:
3.8% (37)
Tennessee:
4.0% (73,770)
Number of families with income $20k - 30k:
Oliver Springs:
9.7% (94)
State:
5.6% (104,070)
Number of families with income $30k - 40k:
Oliver Springs:
11.9% (116)
Tennessee:
7.2% (133,292)
Number of families with income $40k - 50k:
Oliver Springs:
14.0% (137)
State:
7.4% (136,997)
Number of families with income $50k - 60k:
Oliver Springs:
5.8% (57)
State:
7.1% (131,374)
Number of families with income $60k - 75k:
Oliver Springs:
4.2% (41)
State:
10.8% (198,685)
Number of families with income $75k - 100k:
Oliver Springs:
24.3% (237)
State:
15.1% (279,195)
Number of families with income $100k - 125k:
Oliver Springs:
10.4% (101)
Tennessee:
11.7% (216,356)
Number of families with income $125k - 150k:
Oliver Springs:
4.3% (42)
Tennessee:
7.8% (144,000)
Number of families with income $150k - 200k:
Oliver Springs:
1.6% (16)
State:
9.3% (172,160)
Median per capita income in Oliver Springs in 2022:
Oliver Springs:
$23,910
Tennessee:
$36,704
Change in median per capita income between 2000 and 2022:
Oliver Springs, Tennessee:
+51.2%
Tennessee:
+89.3%
Income statistics for White residents
Median household income in Oliver Springs, TN in 2022:
Oliver Springs:
$49,323
State:
$69,826
Change in median household income between 2000 and 2022:
Oliver Springs, Tennessee:
+46.5%
State:
+82.9%
Number of households with income < $10k:
Oliver Springs:
15.3% (231)
State:
4.6% (100,279)
Number of households with income $10k - 20k:
Oliver Springs:
11.8% (177)
State:
7.6% (165,031)
Number of households with income $20k - 30k:
Oliver Springs:
7.9% (119)
Tennessee:
7.4% (160,229)
Number of households with income $30k - 40k:
Oliver Springs:
6.8% (103)
Tennessee:
8.1% (174,784)
Number of households with income $40k - 50k:
Oliver Springs:
9.8% (147)
State:
7.8% (169,622)
Number of households with income $50k - 60k:
Oliver Springs:
7.0% (106)
Tennessee:
7.6% (165,508)
Number of households with income $60k - 75k:
Oliver Springs:
6.0% (91)
State:
10.3% (223,937)
Number of households with income $75k - 100k:
Oliver Springs:
22.3% (336)
Tennessee:
13.5% (292,688)
Number of households with income $100k - 125k:
Oliver Springs:
6.6% (100)
State:
10.1% (219,251)
Number of households with income $125k - 150k:
Oliver Springs:
5.3% (80)
Tennessee:
6.6% (142,574)
Number of households with income $150k - 200k:
Oliver Springs:
0.0% (0)
Tennessee:
7.7% (166,039)
Number of households with income > $200k:
Oliver Springs:
1.1% (16)
Tennessee:
8.5% (184,546)
Aggregate household income in Oliver Springs in 2022: $84,256,133
Median family income in Oliver Springs in 2022:
Oliver Springs:
$57,367
State:
$86,015
Number of families with income < $10k:
Oliver Springs:
10.8% (97)
State:
3.1% (43,751)
Number of families with income $10k - 20k:
Oliver Springs:
4.2% (38)
State:
3.5% (49,925)
Number of families with income $20k - 30k:
Oliver Springs:
10.2% (92)
Tennessee:
5.0% (70,431)
Number of families with income $30k - 40k:
Oliver Springs:
8.7% (78)
State:
6.6% (93,498)
Number of families with income $40k - 50k:
Oliver Springs:
14.3% (128)
State:
6.8% (96,726)
Number of families with income $50k - 60k:
Oliver Springs:
6.3% (57)
Tennessee:
7.2% (101,879)
Number of families with income $60k - 75k:
Oliver Springs:
4.4% (40)
Tennessee:
10.7% (151,997)
Number of families with income $75k - 100k:
Oliver Springs:
25.4% (228)
State:
15.4% (218,373)
Number of families with income $100k - 125k:
Oliver Springs:
11.1% (100)
Tennessee:
12.6% (178,761)
Number of families with income $125k - 150k:
Oliver Springs:
4.6% (41)
State:
8.2% (116,575)
Median per capita income in Oliver Springs in 2022:
Oliver Springs:
$24,406
State:
$40,126
Change in median per capita income between 2000 and 2022:
Oliver Springs, Tennessee:
+56.2%
Tennessee:
+92.6%
Income statistics for Multirace residents
Number of households with income < $10k:
Oliver Springs:
0.0% (0)
State:
6.7% (9,867)
Number of households with income $10k - 20k:
Oliver Springs:
0.0% (0)
State:
8.6% (12,639)
Number of households with income $20k - 30k:
Oliver Springs:
25.7% (9)
State:
9.2% (13,555)
Number of households with income $30k - 40k:
Oliver Springs:
0.0% (0)
Tennessee:
10.3% (15,117)
Number of households with income $40k - 50k:
Oliver Springs:
0.0% (0)
Tennessee:
9.4% (13,829)
Number of households with income $50k - 60k:
Oliver Springs:
0.0% (0)
Tennessee:
7.5% (10,969)
Number of households with income $60k - 75k:
Oliver Springs:
0.0% (0)
Tennessee:
9.2% (13,568)
Number of households with income $75k - 100k:
Oliver Springs:
0.0% (0)
State:
12.6% (18,516)
Number of households with income $100k - 125k:
Oliver Springs:
0.0% (0)
State:
8.6% (12,656)
Number of households with income $125k - 150k:
Oliver Springs:
0.0% (0)
Tennessee:
5.9% (8,674)
Number of households with income $150k - 200k:
Oliver Springs:
74.3% (26)
Tennessee:
7.2% (10,611)
Number of households with income > $200k:
Oliver Springs:
0.0% (0)
State:
4.8% (6,986)
Aggregate household income in Oliver Springs in 2022: $14,364,268
Median per capita income in Oliver Springs in 2022:
Oliver Springs:
$25,815
State:
$24,436
Change in median per capita income between 2000 and 2022:
Oliver Springs, Tennessee:
+18.5%
State:
+84.3%
Discuss Oliver Springs, Tennessee (TN) on our hugely popular Tennessee forum.