The median household income in Olney, IL in 2022 was $56,000, which was 37.0% less than the median annual income of $76,708 across the entire state of Illinois. Compared to the median income of $28,084 in 2000 this represents an increase of 49.9%. The per capita income in 2022 was $28,425, which means an increase of 42.9% compared to 2000 when it was $16,218.
Whole page based on the data from 2000 / 2022 when the population of Olney, Illinois was 8,631 / 8,871
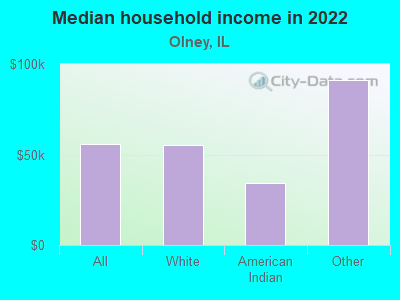
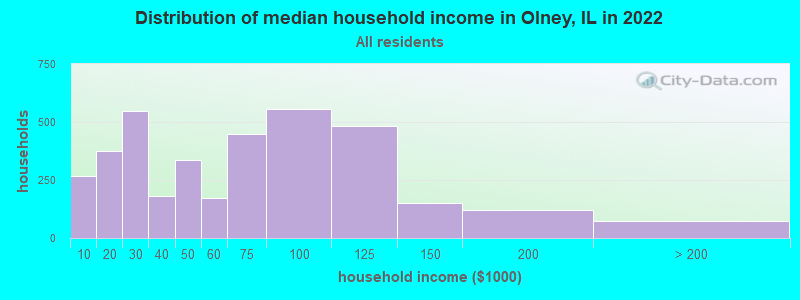
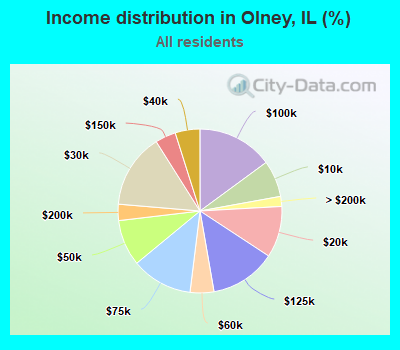
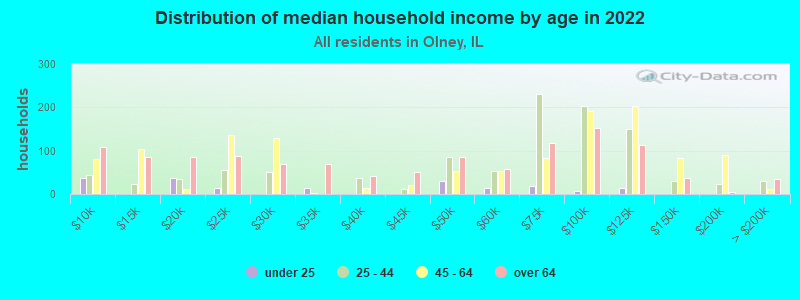
Income statistics for all residents
Median household income in Olney, IL in 2022:
Olney:
$56,001
State:
$76,708
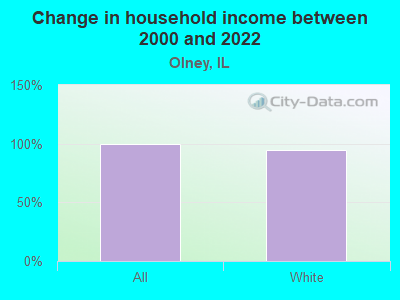
Change in median household income between 2000 and 2022:
Olney, Illinois:
+99.4%
State:
+64.6%
Number of households with income < $10k:
Olney:
7.2% (268)
State:
5.9% (296,090)
Number of households with income $10k - 20k:
Olney:
10.1% (376)
State:
6.6% (333,259)
Number of households with income $20k - 30k:
Olney:
14.7% (546)
Illinois:
6.8% (342,921)
Number of households with income $30k - 40k:
Olney:
4.9% (181)
State:
7.0% (355,254)
Number of households with income $40k - 50k:
Olney:
9.1% (338)
State:
6.7% (340,678)
Number of households with income $50k - 60k:
Olney:
4.7% (174)
Illinois:
6.7% (339,405)
Number of households with income $60k - 75k:
Olney:
12.1% (448)
State:
9.2% (465,709)
Number of households with income $75k - 100k:
Olney:
14.9% (554)
State:
12.9% (651,353)
Number of households with income $100k - 125k:
Olney:
13.0% (483)
Illinois:
10.3% (522,359)
Number of households with income $125k - 150k:
Olney:
4.1% (151)
Illinois:
7.3% (367,136)
Number of households with income $150k - 200k:
Olney:
3.2% (119)
State:
9.0% (455,249)
Number of households with income > $200k:
Olney:
2.0% (73)
Illinois:
11.6% (586,947)
Aggregate household income in Olney in 2022: $242,968,906
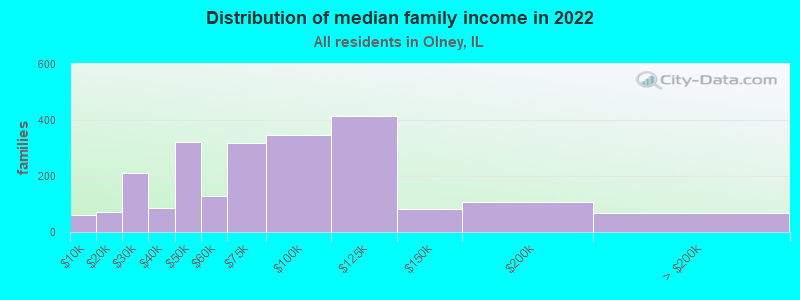
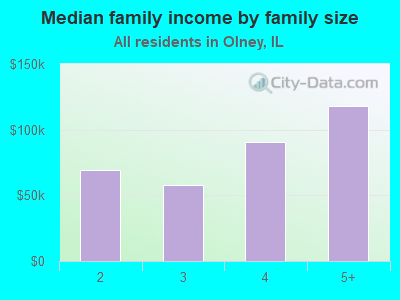
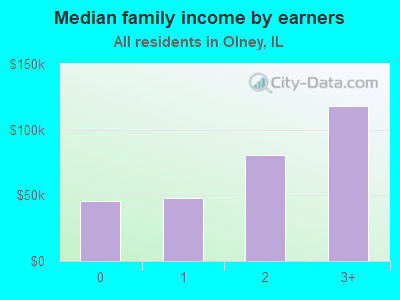
Median family income in Olney in 2022:
Olney:
$69,778
State:
$96,948
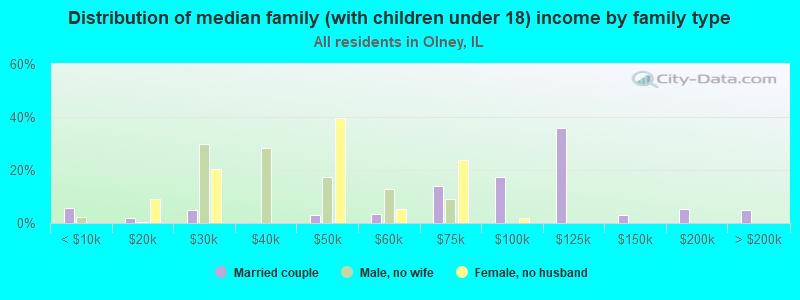
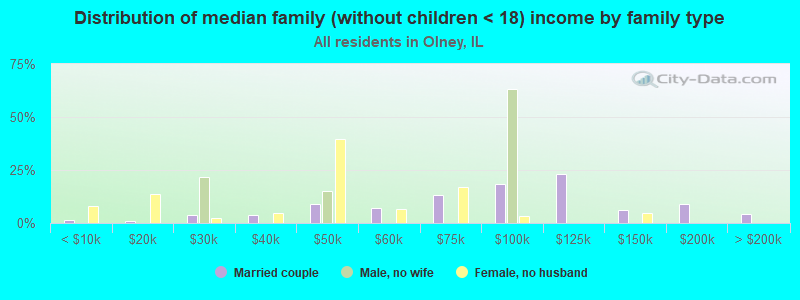
Number of families with income < $10k:
Olney:
2.7% (59)
Illinois:
3.4% (105,875)
Number of families with income $10k - 20k:
Olney:
3.3% (72)
Illinois:
3.3% (105,017)
Number of families with income $20k - 30k:
Olney:
9.5% (211)
Illinois:
4.7% (146,403)
Number of families with income $30k - 40k:
Olney:
3.8% (84)
State:
5.3% (167,069)
Number of families with income $40k - 50k:
Olney:
14.5% (321)
State:
5.8% (181,164)
Number of families with income $50k - 60k:
Olney:
5.8% (129)
State:
6.1% (191,561)
Number of families with income $60k - 75k:
Olney:
14.5% (319)
Illinois:
9.0% (282,985)
Number of families with income $75k - 100k:
Olney:
15.6% (345)
State:
13.8% (432,725)
Number of families with income $100k - 125k:
Olney:
18.8% (414)
Illinois:
11.9% (373,296)
Number of families with income $125k - 150k:
Olney:
3.7% (81)
State:
8.9% (279,791)
Number of families with income $150k - 200k:
Olney:
4.8% (107)
Illinois:
11.9% (372,004)
Number of families with income > $200k:
Olney:
3.0% (67)
Illinois:
15.9% (500,033)
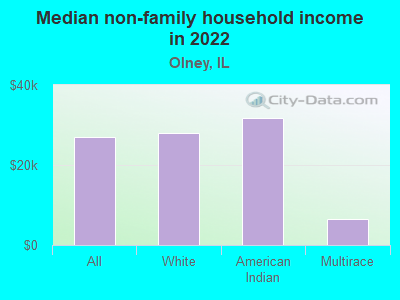
Median non-family income in Olney in 2022:
Olney:
$26,972
State:
$46,533
Change in median non-family income between 2000 and 2022:
Olney, Illinois:
+70.6%
Illinois:
+64.0%
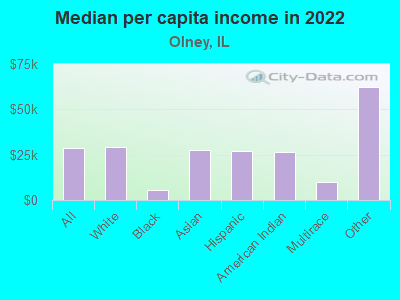
Median per capita income in Olney in 2022:
Olney:
$28,425
Illinois:
$43,317
Change in median per capita income between 2000 and 2022:
Olney, Illinois:
+75.3%
State:
+87.5%
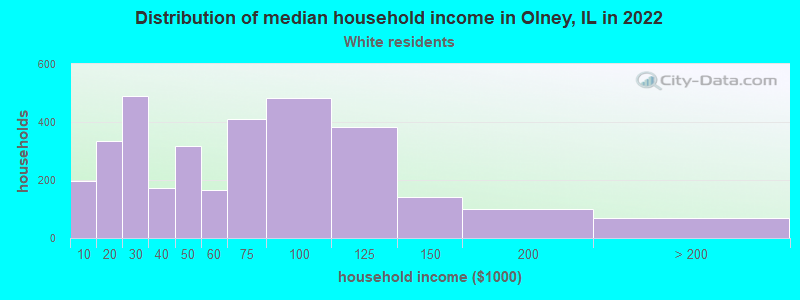
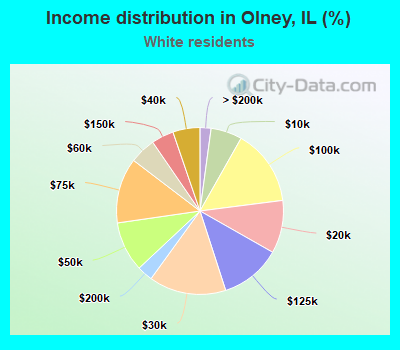
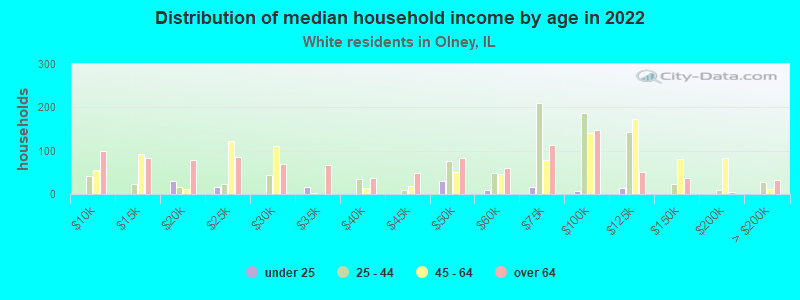
Income statistics for White residents
Median household income in Olney, IL in 2022:
Olney:
$55,187
State:
$83,346
Change in median household income between 2000 and 2022:
Olney, Illinois:
+94.3%
Illinois:
+67.5%
Number of households with income < $10k:
Olney:
6.0% (197)
State:
4.5% (149,895)
Number of households with income $10k - 20k:
Olney:
10.2% (334)
State:
5.5% (184,529)
Number of households with income $20k - 30k:
Olney:
15.0% (488)
State:
6.1% (205,767)
Number of households with income $30k - 40k:
Olney:
5.2% (171)
Illinois:
6.7% (225,572)
Number of households with income $40k - 50k:
Olney:
9.7% (316)
State:
6.5% (216,965)
Number of households with income $50k - 60k:
Olney:
5.1% (165)
State:
6.6% (222,841)
Number of households with income $60k - 75k:
Olney:
12.6% (412)
State:
9.3% (312,758)
Number of households with income $75k - 100k:
Olney:
14.8% (482)
State:
12.9% (433,180)
Number of households with income $100k - 125k:
Olney:
11.8% (384)
State:
10.7% (360,753)
Number of households with income $125k - 150k:
Olney:
4.3% (141)
State:
7.9% (266,532)
Number of households with income $150k - 200k:
Olney:
3.0% (99)
State:
10.0% (337,357)
Number of households with income > $200k:
Olney:
2.1% (70)
State:
13.3% (446,069)
Aggregate household income in Olney in 2022: $215,033,092
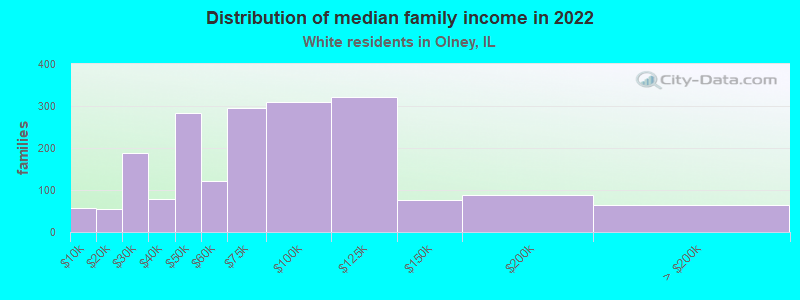
Median family income in Olney in 2022:
Olney:
$69,493
State:
$107,938
Number of families with income < $10k:
Olney:
3.0% (57)
State:
2.2% (45,983)
Number of families with income $10k - 20k:
Olney:
2.8% (54)
State:
2.5% (50,574)
Number of families with income $20k - 30k:
Olney:
9.8% (189)
State:
3.5% (70,927)
Number of families with income $30k - 40k:
Olney:
4.0% (78)
Illinois:
4.4% (90,563)
Number of families with income $40k - 50k:
Olney:
14.6% (283)
State:
5.0% (102,597)
Number of families with income $50k - 60k:
Olney:
6.3% (122)
State:
5.8% (119,129)
Number of families with income $60k - 75k:
Olney:
15.3% (296)
Illinois:
8.8% (179,665)
Number of families with income $75k - 100k:
Olney:
16.0% (309)
State:
13.5% (276,887)
Number of families with income $100k - 125k:
Olney:
16.6% (321)
State:
12.5% (256,099)
Number of families with income $125k - 150k:
Olney:
3.9% (76)
State:
9.8% (199,855)
Number of families with income $150k - 200k:
Olney:
4.5% (87)
Illinois:
13.4% (274,569)
Number of families with income > $200k:
Olney:
3.3% (64)
State:
18.6% (381,354)
Median non-family income in Olney in 2022:
Olney:
$28,123
Illinois:
$50,934
Change in median non-family income between 2000 and 2022:
Olney, Illinois:
+76.0%
Illinois:
+70.7%
Median per capita income in Olney in 2022:
Olney:
$29,498
Illinois:
$50,738
Change in median per capita income between 2000 and 2022:
Olney, Illinois:
+80.8%
State:
+95.5%
Income statistics for Black or African American residents
Number of households with income < $10k:
Olney:
0.0% (0)
State:
13.3% (92,224)
Number of households with income $10k - 20k:
Olney:
100.0% (17)
Illinois:
13.5% (93,732)
Number of households with income $20k - 30k:
Olney:
0.0% (0)
State:
9.9% (68,453)
Number of households with income $30k - 40k:
Olney:
0.0% (0)
State:
8.5% (59,072)
Number of households with income $40k - 50k:
Olney:
0.0% (0)
Illinois:
7.9% (55,033)
Number of households with income $50k - 60k:
Olney:
0.0% (0)
State:
7.2% (49,556)
Number of households with income $60k - 75k:
Olney:
0.0% (0)
State:
7.8% (53,726)
Number of households with income $75k - 100k:
Olney:
0.0% (0)
Illinois:
11.6% (80,439)
Number of households with income $100k - 125k:
Olney:
0.0% (0)
State:
7.5% (52,244)
Number of households with income $125k - 150k:
Olney:
0.0% (0)
Illinois:
3.9% (27,058)
Number of households with income $150k - 200k:
Olney:
0.0% (0)
State:
4.6% (32,057)
Number of households with income > $200k:
Olney:
0.0% (0)
State:
4.1% (28,731)
Aggregate household income in Olney in 2022: $1,223,624
Median per capita income in Olney in 2022:
Olney:
$5,333
Illinois:
$28,045
Change in median per capita income between 2000 and 2022:: -19.1%
Olney, Illinois:
-19.1%
State:
+90.2%
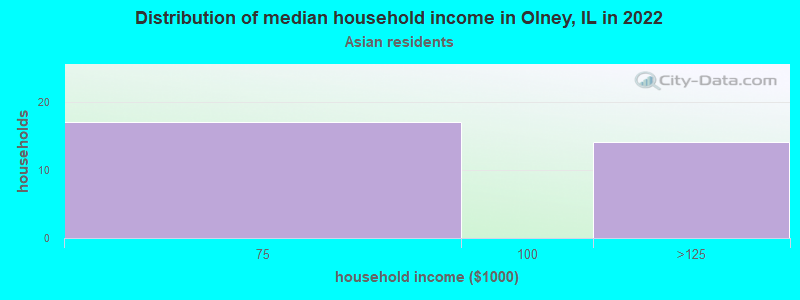
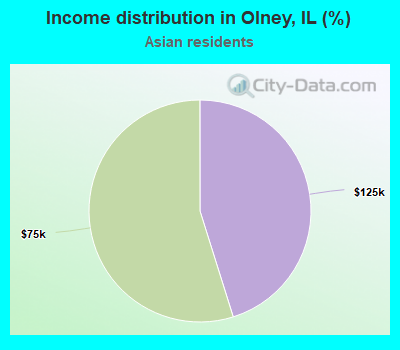
Income statistics for Asian residents
Number of households with income < $10k:
Olney:
0.0% (0)
State:
5.3% (14,653)
Number of households with income $10k - 20k:
Olney:
0.0% (0)
Illinois:
4.5% (12,283)
Number of households with income $20k - 30k:
Olney:
0.0% (0)
State:
4.8% (13,135)
Number of households with income $30k - 40k:
Olney:
0.0% (0)
State:
5.0% (13,655)
Number of households with income $40k - 50k:
Olney:
0.0% (0)
Illinois:
4.5% (12,357)
Number of households with income $50k - 60k:
Olney:
0.0% (0)
State:
4.9% (13,568)
Number of households with income $60k - 75k:
Olney:
54.8% (17)
State:
7.1% (19,606)
Number of households with income $75k - 100k:
Olney:
0.0% (0)
State:
12.1% (33,349)
Number of households with income $100k - 125k:
Olney:
45.2% (14)
State:
9.7% (26,669)
Number of households with income $125k - 150k:
Olney:
0.0% (0)
State:
7.3% (20,172)
Number of households with income $150k - 200k:
Olney:
0.0% (0)
State:
11.5% (31,711)
Number of households with income > $200k:
Olney:
0.0% (0)
State:
23.1% (63,411)
Aggregate household income in Olney in 2022: $1,844,349
Median per capita income in Olney in 2022:
Olney:
$27,449
State:
$52,977
Change in median per capita income between 2000 and 2022:
Olney, Illinois:
+44.2%
State:
+119.5%
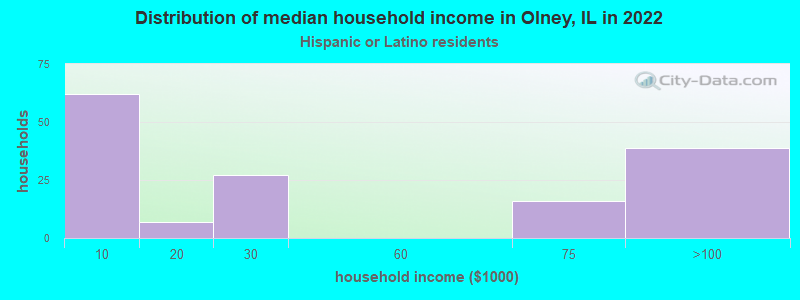
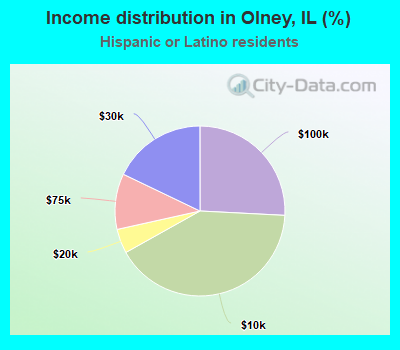
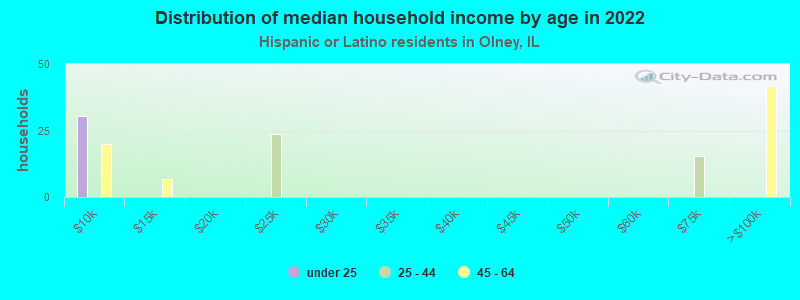
Income statistics for Hispanic or Latino residents
Number of households with income < $10k:
Olney:
41.1% (62)
State:
4.9% (33,145)
Number of households with income $10k - 20k:
Olney:
4.6% (7)
Illinois:
5.4% (36,345)
Number of households with income $20k - 30k:
Olney:
17.9% (27)
Illinois:
7.5% (50,677)
Number of households with income $30k - 40k:
Olney:
0.0% (0)
State:
7.7% (52,008)
Number of households with income $40k - 50k:
Olney:
0.0% (0)
State:
8.1% (54,702)
Number of households with income $50k - 60k:
Olney:
0.0% (0)
State:
7.5% (51,062)
Number of households with income $60k - 75k:
Olney:
10.6% (16)
Illinois:
11.3% (76,576)
Number of households with income $75k - 100k:
Olney:
25.8% (39)
State:
15.5% (105,152)
Number of households with income $100k - 125k:
Olney:
0.0% (0)
State:
11.5% (77,760)
Number of households with income $125k - 150k:
Olney:
0.0% (0)
Illinois:
7.3% (49,310)
Number of households with income $150k - 200k:
Olney:
0.0% (0)
State:
7.6% (51,233)
Number of households with income > $200k:
Olney:
0.0% (0)
State:
5.9% (40,028)
Aggregate household income in Olney in 2022: $5,437,766
Median per capita income in Olney in 2022:
Olney:
$27,053
State:
$26,551
Income statistics for American Indian and Alaska Native residents
Median household income in Olney, IL in 2022:
Olney:
$34,000
Illinois:
$66,282
Aggregate household income in Olney in 2022: $244,716
Median non-family income in Olney in 2022:
Olney:
$31,782
State:
$34,674
Median per capita income in Olney in 2022:
Olney:
$26,615
Illinois:
$26,979
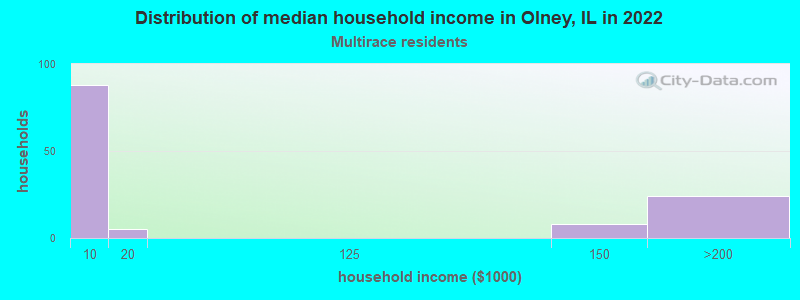
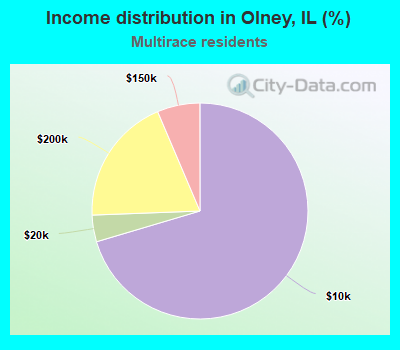
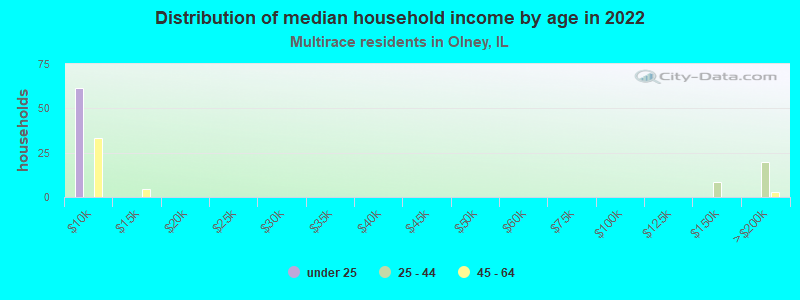
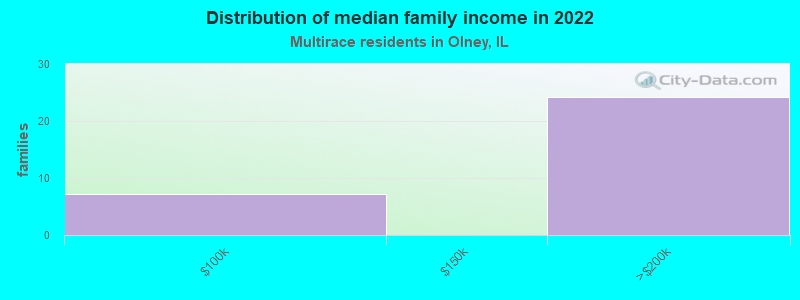
Income statistics for Multirace residents
Number of households with income < $10k:
Olney:
70.4% (88)
State:
5.3% (21,595)
Number of households with income $10k - 20k:
Olney:
4.0% (5)
Illinois:
6.5% (26,720)
Number of households with income $20k - 30k:
Olney:
0.0% (0)
State:
8.0% (32,573)
Number of households with income $30k - 40k:
Olney:
0.0% (0)
State:
8.4% (34,383)
Number of households with income $40k - 50k:
Olney:
0.0% (0)
Illinois:
7.4% (30,234)
Number of households with income $50k - 60k:
Olney:
0.0% (0)
Illinois:
6.9% (28,432)
Number of households with income $60k - 75k:
Olney:
0.0% (0)
State:
10.2% (41,780)
Number of households with income $75k - 100k:
Olney:
0.0% (0)
State:
13.0% (53,426)
Number of households with income $100k - 125k:
Olney:
0.0% (0)
Illinois:
10.5% (43,126)
Number of households with income $125k - 150k:
Olney:
6.4% (8)
State:
7.6% (31,153)
Number of households with income $150k - 200k:
Olney:
19.2% (24)
State:
7.6% (30,946)
Number of households with income > $200k:
Olney:
0.0% (0)
Illinois:
8.6% (35,208)
Aggregate household income in Olney in 2022: $5,480,690
Median family income in Olney in 2022:
Olney:
$153,745
State:
$84,400
Number of families with income $75k - 100k:
Olney:
22.9% (7)
State:
13.6% (37,857)
Number of families with income $150k - 200k:
Olney:
77.1% (24)
State:
9.5% (26,306)
Median non-family income in Olney in 2022:
Olney:
$6,531
Illinois:
$43,615
Change in median non-family income between 2000 and 2022:: -58.2%
Olney, Illinois:
-58.2%
Illinois:
+77.3%
Median per capita income in Olney in 2022:
Olney:
$10,078
Illinois:
$29,285
Change in median per capita income between 2000 and 2022:: -26.0%
Olney, Illinois:
-26.0%
Illinois:
+112.9%
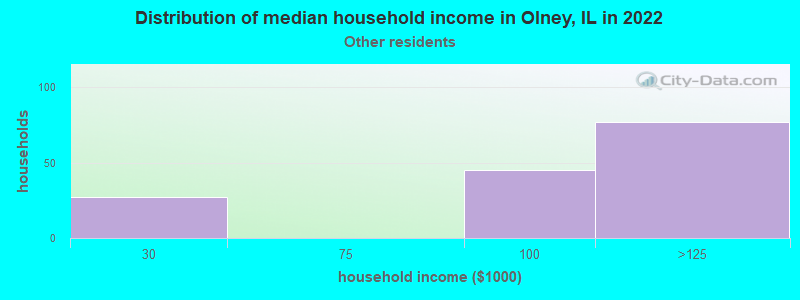
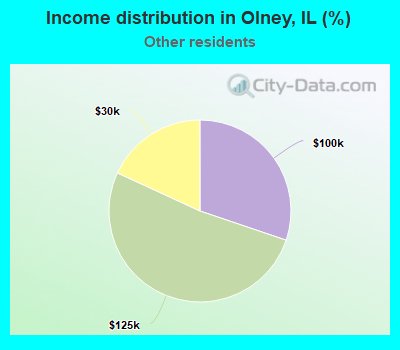
Income statistics for other residents
Median household income in Olney, IL in 2022:
Olney:
$91,128
State:
$71,711
Number of households with income < $10k:
Olney:
0.0% (0)
Illinois:
5.7% (16,383)
Number of households with income $10k - 20k:
Olney:
0.0% (0)
State:
4.8% (13,886)
Number of households with income $20k - 30k:
Olney:
18.1% (27)
Illinois:
7.0% (20,054)
Number of households with income $30k - 40k:
Olney:
0.0% (0)
State:
7.0% (20,038)
Number of households with income $40k - 50k:
Olney:
0.0% (0)
State:
8.3% (23,759)
Number of households with income $50k - 60k:
Olney:
0.0% (0)
Illinois:
7.8% (22,410)
Number of households with income $60k - 75k:
Olney:
0.0% (0)
State:
12.0% (34,448)
Number of households with income $75k - 100k:
Olney:
30.2% (45)
State:
16.2% (46,508)
Number of households with income $100k - 125k:
Olney:
51.7% (77)
State:
12.5% (35,952)
Number of households with income $125k - 150k:
Olney:
0.0% (0)
State:
6.9% (19,732)
Number of households with income $150k - 200k:
Olney:
0.0% (0)
State:
7.5% (21,422)
Number of households with income > $200k:
Olney:
0.0% (0)
State:
4.3% (12,194)
Aggregate household income in Olney in 2022: $12,589,130
Median per capita income in Olney in 2022:
Olney:
$62,409
State:
$25,392
Discuss Olney, Illinois (IL) on our hugely popular Illinois forum.