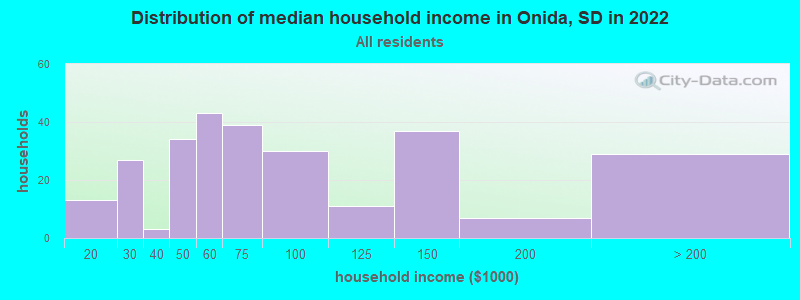
The median household income in Onida, SD in 2022 was $67,763, which was 2.9% less than the median annual income of $69,728 across the entire state of South Dakota. Compared to the median income of $35,750 in 2000 this represents an increase of 47.2%. The per capita income in 2022 was $42,444, which means an increase of 54.4% compared to 2000 when it was $19,340.
Whole page based on the data from 2000 / 2022 when the population of Onida, South Dakota was 740 / 599
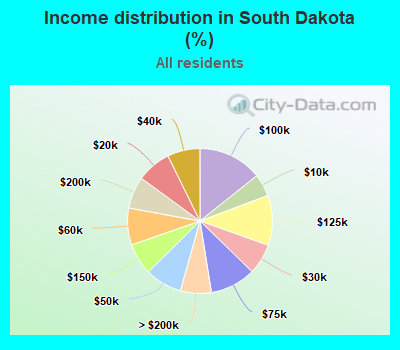
Income statistics for all residents
Median household income in Onida, SD in 2022:
Onida:
$67,763
State:
$69,728
Change in median household income between 2000 and 2022:
Onida, South Dakota:
+89.5%
South Dakota:
+97.6%
Number of households with income < $10k:
Onida:
0.0% (0)
State:
5.0% (18,379)
Number of households with income $10k - 20k:
Onida:
4.8% (13)
State:
7.7% (28,298)
Number of households with income $20k - 30k:
Onida:
9.9% (27)
State:
6.9% (25,234)
Number of households with income $30k - 40k:
Onida:
1.1% (3)
State:
7.3% (26,825)
Number of households with income $40k - 50k:
Onida:
12.5% (34)
State:
8.3% (30,386)
Number of households with income $50k - 60k:
Onida:
15.8% (43)
South Dakota:
8.2% (30,304)
Number of households with income $60k - 75k:
Onida:
14.3% (39)
South Dakota:
10.2% (37,507)
Number of households with income $75k - 100k:
Onida:
11.0% (30)
South Dakota:
14.3% (52,640)
Number of households with income $100k - 125k:
Onida:
4.0% (11)
State:
11.2% (41,135)
Number of households with income $125k - 150k:
Onida:
13.6% (37)
South Dakota:
7.0% (25,877)
Number of households with income $150k - 200k:
Onida:
2.6% (7)
State:
7.1% (26,303)
Number of households with income > $200k:
Onida:
10.6% (29)
State:
6.9% (25,412)
Aggregate household income in Onida in 2022: $24,894,654
Median family income in Onida in 2022:
Onida:
$100,229
South Dakota:
$89,573
Number of families with income < $10k:
Onida:
2.8% (4)
State:
2.8% (6,303)
Number of families with income $10k - 20k:
Onida:
2.6% (4)
South Dakota:
3.6% (8,079)
Number of families with income $30k - 40k:
Onida:
1.6% (3)
State:
5.3% (11,987)
Number of families with income $40k - 50k:
Onida:
5.1% (8)
State:
6.5% (14,582)
Number of families with income $50k - 60k:
Onida:
5.0% (8)
State:
7.6% (17,042)
Number of families with income $60k - 75k:
Onida:
17.0% (26)
State:
10.3% (23,221)
Number of families with income $75k - 100k:
Onida:
15.3% (24)
State:
16.8% (37,721)
Number of families with income $100k - 125k:
Onida:
11.0% (17)
State:
14.3% (32,147)
Number of families with income $125k - 150k:
Onida:
17.0% (26)
South Dakota:
9.6% (21,589)
Number of families with income $150k - 200k:
Onida:
4.5% (7)
State:
10.0% (22,561)
Number of families with income > $200k:
Onida:
18.1% (28)
State:
9.5% (21,442)
Median non-family income in Onida in 2022:
Onida:
$47,717
South Dakota:
$42,028
Change in median non-family income between 2000 and 2022:
Onida, South Dakota:
+97.4%
State:
+103.3%
Median per capita income in Onida in 2022:
Onida:
$42,445
State:
$37,618
Change in median per capita income between 2000 and 2022:
Onida, South Dakota:
+119.5%
State:
+114.2%
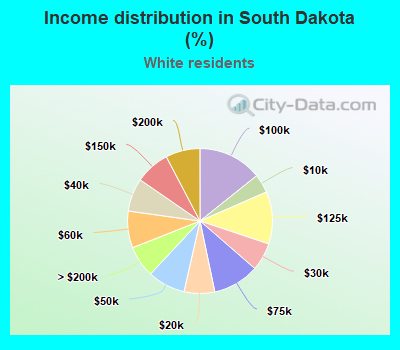
Income statistics for White residents
Median household income in Onida, SD in 2022:
Onida:
$67,736
State:
$72,751
Change in median household income between 2000 and 2022:
Onida, South Dakota:
+88.2%
State:
+99.8%
Number of households with income < $10k:
Onida:
0.0% (0)
South Dakota:
4.2% (13,247)
Number of households with income $10k - 20k:
Onida:
4.9% (13)
State:
6.8% (21,574)
Number of households with income $20k - 30k:
Onida:
9.4% (25)
State:
6.2% (19,719)
Number of households with income $30k - 40k:
Onida:
1.1% (3)
State:
7.4% (23,368)
Number of households with income $40k - 50k:
Onida:
12.7% (34)
State:
8.4% (26,589)
Number of households with income $50k - 60k:
Onida:
15.7% (42)
State:
8.2% (25,939)
Number of households with income $60k - 75k:
Onida:
14.2% (38)
State:
10.3% (32,725)
Number of households with income $75k - 100k:
Onida:
10.9% (29)
State:
14.3% (45,125)
Number of households with income $100k - 125k:
Onida:
4.1% (11)
South Dakota:
11.7% (36,951)
Number of households with income $125k - 150k:
Onida:
13.9% (37)
State:
7.7% (24,425)
Number of households with income $150k - 200k:
Onida:
2.6% (7)
State:
7.7% (24,275)
Number of households with income > $200k:
Onida:
10.5% (28)
State:
7.1% (22,318)
Aggregate household income in Onida in 2022: $24,366,887
Median family income in Onida in 2022:
Onida:
$100,907
State:
$95,160
Number of families with income < $10k:
Onida:
2.8% (4)
State:
1.8% (3,490)
Number of families with income $10k - 20k:
Onida:
3.0% (4)
State:
2.7% (5,120)
Number of families with income $30k - 40k:
Onida:
1.8% (3)
South Dakota:
5.3% (10,125)
Number of families with income $40k - 50k:
Onida:
5.4% (8)
State:
6.2% (11,888)
Number of families with income $50k - 60k:
Onida:
5.0% (8)
State:
7.4% (14,244)
Number of families with income $60k - 75k:
Onida:
16.4% (25)
State:
10.2% (19,593)
Number of families with income $75k - 100k:
Onida:
15.0% (23)
State:
16.9% (32,564)
Number of families with income $100k - 125k:
Onida:
10.9% (17)
State:
15.2% (29,279)
Number of families with income $125k - 150k:
Onida:
17.3% (26)
South Dakota:
10.6% (20,421)
Number of families with income $150k - 200k:
Onida:
4.5% (7)
State:
10.9% (20,890)
Number of families with income > $200k:
Onida:
18.0% (27)
South Dakota:
10.0% (19,175)
Median non-family income in Onida in 2022:
Onida:
$48,342
South Dakota:
$43,283
Change in median non-family income between 2000 and 2022:
Onida, South Dakota:
+93.4%
State:
+106.8%
Median per capita income in Onida in 2022:
Onida:
$43,399
South Dakota:
$40,853
Change in median per capita income between 2000 and 2022:
Onida, South Dakota:
+121.8%
State:
+117.4%
Income statistics for Multirace residents
Median per capita income in Onida in 2022:
Onida:
$92,815
State:
$29,178
Discuss Onida, South Dakota (SD) on our hugely popular South Dakota forum.